Same theme not quite the alarm .Macro View
Complacency in Uncharted Waters The next challenge for central bankers is changing monetary policy when the economy has come to depend on it.
May 03, 2016 Global CIO Commentary by Scott Minerd
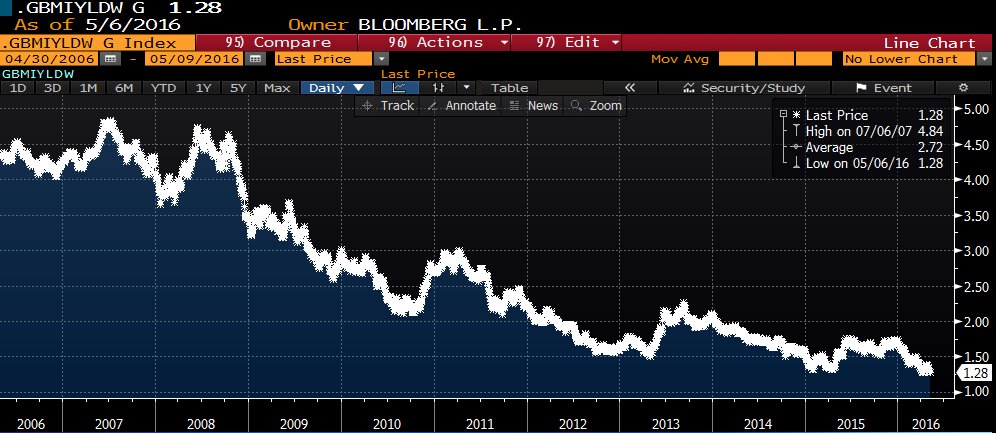
...Another market area that is clearly not behaving according to the central banks’ script is foreign exchange. Japan’s current laundry list of woes is topped by the strengthening yen, which is a major headwind for its moribund economy. The Bank of Japan is due to convene later this month, and may decide that the best course of action is to intervene directly to drive down the value of its currency. Such direct intervention basically will entail selling yen and buying U.S. dollars, and typically those dollars go to buy U.S. Treasurys. Europe is probably not far behind: It has tepid growth, a strengthening currency, and more potential downside to their policy rates. This means there is a high likelihood of a fairly good bid on Treasurys in the coming weeks that could be sufficient to push the 10-year U.S. Treasury note lower.
My message to central bankers is the following: Although the waters at the present time might seem calm, they are still uncharted and there are risks beneath the surface. QE and negative interest rates, once thought to be extraordinary measures, have become the new monetary policy orthodoxy in the largest developed economies. The data on the long-run effects are limited, but real-time experience with these policies offers a few lessons.
...we learned from Japan that ever larger doses of unconventional monetary policy may be required in the absence of growth-enhancing structural reforms. Moreover, it is incredibly difficult to reverse these policies from an economy that has come to depend on them. Second, in Europe we are learning that such policies offer limited benefits unless paired with a coordinated fiscal plan. Finally, we have learned here at home that trying to “normalize” policy, even in a gradual manner, can strain financial markets.
https://guggenheimpartners.com/perspectives/macroview/complacency-in-uncharted-watersAlso
Markets and life since 2006.10 Stats About the Last 10 YearsMay 02, 2016 By Nicholas Colas who is is Chief Market Strategist for Convergex.
Summary: The headline today that Goldman Sachs’ stock has gone nowhere for a decade got us thinking about general market performance over the last 10 years. The key contours are straightforward: subpar price returns (a 4.9% compounded annual growth rate for the S&P 500) with increased volatility (a VIX that is 25% more volatile than average). From there, things get funky.
Think back over the last 10 years - how different was your life in April 2006? While you may think your daily existence is largely the same (maybe the kids are older or you’re married now, but that about it…), consider what was actually different about your life in the spring of 2006:
No iPhone. Steve Jobs unveiled the first iPhone in January 2007, and it didn’t ship until June of that year.
No Facebook (unless you were in college at the time). Facebook only opened to the general population in September 2006.
No Twitter. The full version of the product launched in July 2006.
No Instagram. The picture sharing site only launched in 2010.
No Kim Kardashian. “Keeping up With The Kardashians” debuted in October 2007.
No Uber. The company received its seed funding in 2009.
No iPad. Apple started taking pre-orders on the first-gen product in March 2010.
It feels like April 2006 demarcates the last days of some Dark Age, or at least a simpler time without the manifold distractions of today. And while you might opt for a world without the Kardashians, imagine it without your smartphone, Facebook/social media, and an iPad to entertain the kids (or yourself). It’s ok – don’t panic. You have them now.
The journey from April 2006 to April 2016 in financial markets has, of course, been a wild ride. But just as it is hard to remember what daily life was like a decade ago, it is also easy to forget some of the important waypoints that capital markets took from there to here.
Here are 10 data points about the last 10 years we hope you will find useful:http://www.convergex.com/the-share/10-stats-about-the-last-10-years