It looks like you're new here. If you want to get involved, click one of these buttons!
https://blocktower.substack.com/Originally known as “open finance”, the advent of DeFi represents yet another innovation on the rapidly evolving world of cryptoassets and blockchain technology. As with most new innovations, there is the growing litany of new announcements, innovative solutions and industry mania as these offerings progress throughout the landscape. For many, it seems a chance for new business models and rapid wealth creation. For the more sober minded, it is yet another step in the swift transformation happening across financial markets, and indeed across all industries in the global economy. As always, change and disruption require us to revert back to first principles. And these first principles demand that we ask the question: why? Why decentralized finance? What problems does it solve? And what, in truth, do we actually mean by “decentralized finance”?
These inquiries bring us to the motivation for this publication. It is our hope that this primer can offer a proposed definition for DeFi, in all of its forms, as well as share with the reader current and future DeFi use cases. It also touches on the challenges of DeFi, not least of these being the uncertain and evolving regulatory and legislative challenges coming to the fore. As a product of the WSBA Accounting Working Group, this work also delves into the
very complex accounting considerations that DeFi poses, both now and in the future. Finally, we conclude with some thoughts on what the future holds and offer some resources to keep pace with this future.
It is our goal that this be the first in a series of thought leadership publications that continue to aid the advancement of the cryptoassets and blockchain ecosystems, the accounting profession and global markets around the world. We welcome your thoughts and feedback and hope that you find this document informative as well as useful.
positioning-for-new-economic-landscape.pdf
Key Insights
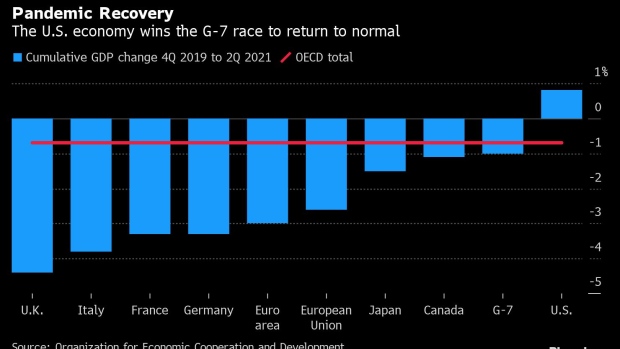
Global growth accelerated in early 2021, led by China and the U.S. The economic recovery from the pandemic appears set to broaden in the second half.
Despite strong growth, earnings expectations could be difficult to meet. But there may be potential for earnings outperformance in some non-U.S. markets.
Strong institutional demand for U.S. Treasuries is holding yields down. Fixed income investors may want to consider credit sectors for opportunities.
China’s tighter corporate governance standards, better capital allocation, and technical innovation are expanding the opportunity set for investors.
Not every company makes explicit public statements of policy but are there really any companies that don’t have a position on public issues?Is there any escape, or partial escape from the wokeness?
What companies do you know of that don't take sides on political social and moral issues?
Also, which of the fund families do you think is least woke?
https://reuters.com/article/us-china-alibaba/alibaba-shrugs-off-2-75-billion-antitrust-fine-shares-rally-idUSKBN2BZ01PBeijing wants Alibaba to stop requiring merchants to chose between doing business with it and rival platforms, a practice known as ‘merchant exclusivity’, which critics say helped it become China’s largest e-commerce operation.
Aside from imposing the fine, among the highest ever antitrust penalties globally, the State Administration for Market Regulation (SAMR) ordered Alibaba to make “thorough rectifications” to strengthen internal compliance and protect consumer rights.
“The required corrective measures will likely limit Alibaba’s revenue growth as a further expansion in market share will be constrained,” said Lina Choi, Senior Vice President at Moody’s Investors Service.
“Investments to retain merchants and upgrade products and services will also reduce its profit margins.”
SAMR said it had determined Alibaba, which is also listed in New York, had prevented its merchants from using other online e-commerce platforms since 2015.
The practice, which the SAMR has previously spelt out as illegal, violates China’s antimonopoly law by hindering the free circulation of goods and infringing on the business interests of merchants, the regulator said.
The probe comes as China bolsters SAMR with extra staff and a wider jurisdiction amid a crackdown on technology conglomerates, signalling a new era after years of laissez-faire approach.
The agency has taken aim recently at China’s large tech giants in particular, mirroring increased scrutiny of the sector in the United States and Europe.
© 2015 Mutual Fund Observer. All rights reserved.
© 2015 Mutual Fund Observer. All rights reserved. Powered by Vanilla