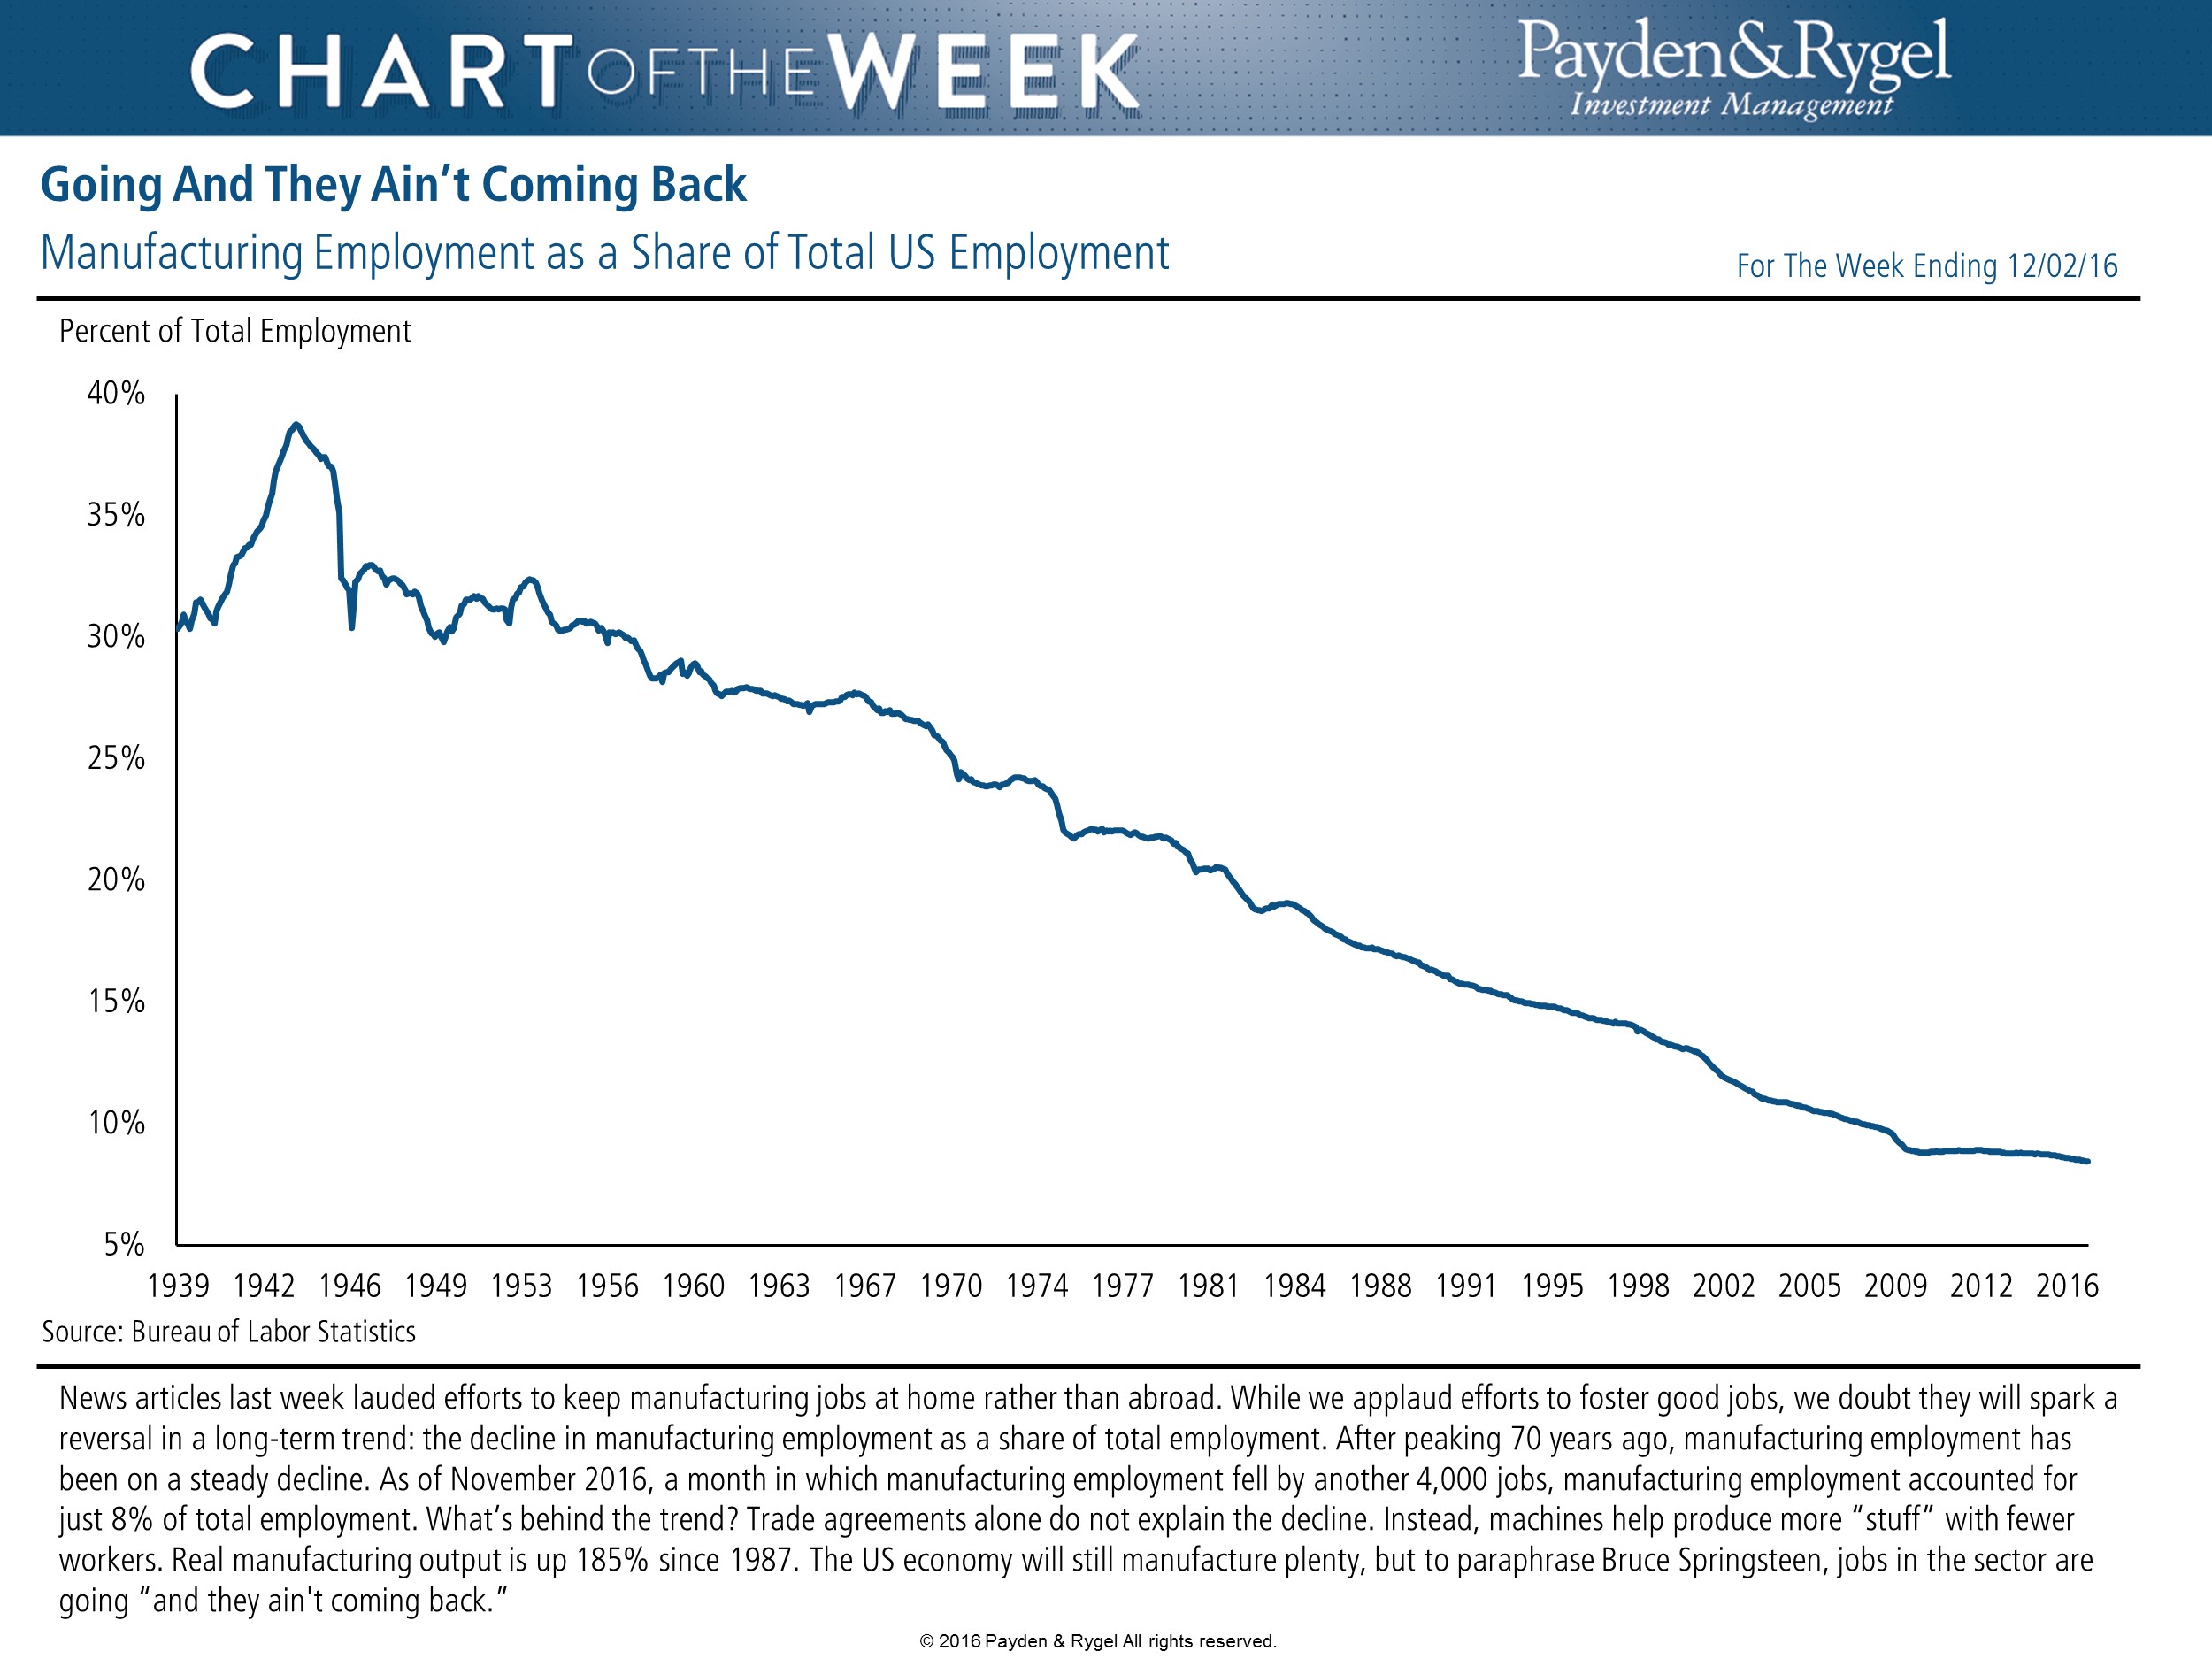
Howdy, Stranger!

It looks like you're new here. If you want to get involved, click one of these buttons!

Here's a statement of the obvious: The opinions expressed here are those of the participants, not those of the Mutual Fund Observer. We cannot vouch for the accuracy or appropriateness of any of it, though we do encourage civility and good humor.
  • Two Top Health-Care Funds
    "(ETHSX) is one of just a handful of funds that has consistently beaten the market over virtually every time period."
    Statements like this always leave me wondering what "consistent" means, and what "market" means.
    As an example, has a fund that underperformed by 2% in each of 2011, 2012, 2013, and 2014, but outperformed by 15% in 2015 "consistently" outperformed? Its 1, 3, 5 year records say that it has done well, but I'd hardly call it consistent.
    ETHSX's record is somewhat like that, only it has done well in the past three calendar years. Though it has done poorly this short YTD (as has the entire sector) relative to "the market". It did not fare well relative to "the market" in 2012, while 2010 and 2006 were relative disasters. Here I'm using the S&P 500 and MSCI ACWI to represent "the market".
    IMHO more significant (for any fund) is how well it has done relative to its sector. ETHSX's rankings are in the bottom half (M* category) for 3, 5, 10, and 15 year periods. With this statement I'm guilty of the same cherry picking as Barron's - I'm not looking year by year (or rolling periods). Though year by year, still it has ended only two of the last ten calendar years in the top two quintiles.
    Lipper says pretty much the same thing, ranking it a 3 on consistency (3, 5, 10, and overall) within its Lipper category.
    Note that Lipper divides the health care fund universe into two parts - domestic and global. This is another illustration of why defining terms, i.e. "the market" matters. Lipper considers ETHSX a global fund (JAGLX being a more consistent peer), while Lipper considers FSPHX to be a consistent domestic health care fund.
  • Two Top Health-Care Funds
    FYI: (Click On Article title At Top Of Google Search)
    This year’s market has not been good for anyone’s health. After the rockiest start ever to a new year, the volatility has continued such that even the recent three-day rally still has stocks down more than 6% as of Thursday. Health-care stocks, after five years of market-beating gains, have been hit particularly hard, down 8.6% for the year so far. The only sector in worse shape is financials, down 12.3%.
    In our Jan. 30 cover story, Barron’s told readers it was “Time to Buy Bank Stocks.” Investors would be wise to look at health-care funds as well.
    Regards,
    Ted
    https://www.google.com/#q=Two+Top+Health-Care+Funds+Barron's
  • VBINX
    hmm. Not seeing that as much as you are. I know about the Pimco classes, thanks. Just was looking at performance of the various bond funds I mentioned, not seeing clearly how to make a true diversification decision.
    >> You wanted to be heavy in VGLT till this week.
    Not starting in the fall of 2010 or two years later, or the spring of 2013. Or indeed the spring of last year. How far back are you looking?
    David, I don't know about others...but for me yes, I prefer to be UP 7% (VGLT) when the stock market is down 6.5% (VTI). As for how far back...well ytd VGLT UP 7% PIMIX DOWN .8%; 3yrs VGLT UP 6.1% PIMIX UP 3.8%; 5yrs VGLT UP 9.7% PIMIX UP 7.7% Over the longer term I expect PIMIX will beat VGLT since rates will likely rise slowly over time (though who really knows), but it will likely run in the direction of the stock market and hence is not what one looks for in the bond portion of a balanced portfolio.
  • VBINX
    hmm. Not seeing that as much as you are. I know about the Pimco classes, thanks. Just was looking at performance of the various bond funds I mentioned, not seeing clearly how to make a true diversification decision.
    >> You wanted to be heavy in VGLT till this week.
    Not starting in the fall of 2010 or two years later, or the spring of 2013. Or indeed the spring of last year. How far back are you looking?
  • California Muni Bond Funds Here I Come
    http://finance.yahoo.com/q?s=NCATX paying 3.20%
    http://finance.yahoo.com/q?s=HYD 4.79%
    The gold rush might be over as the interest rates (especially for non Californians) are low for the Cali munis.
    Was it 5 years ago that Cali was having financial problems? So, could their performance be coming from that low point and they have caught up with the market?
  • California Muni Bond Funds Here I Come
    @DavidV: Yes, excellent point ! Example PCK 11.02% 5-Years
    Regards,
    Ted
  • California Muni Bond Funds Here I Come
    FYI John Waggoner on Twitter just reported the following:
    Regards,
    Ted
    Long-term Cali muni bond funds up an average 7.54% the past five years, beating all of Morningstar's diversified stock fund. categories.
    M* California Mumi Bond Fund Returns:
    http://news.morningstar.com/fund-category-returns/muni-california-long/$FOCA$MC.aspx
    U.S. Equity Fund Returns:
    :http://news.morningstar.com/fund-category-returns/
  • VBINX
    Lipper puts VBINX in the Growth Allocation category. There are 113 such funds in its database ending January 2016, at least 10 years old, oldest share class only, open and closed.
    VBINX stacks up pretty well. Here is list from top, sorted by 10 year annualized total return (APR), which includes expenses, reinvested dividends, and any max front load. (As always, no accounting for category drift or survivorship.)
    It beat out Dodge & Cox Balanced DODBX, which has delivered 5% APR, placing it 41 out of 113.
    Here is same list based a Martin Ratio, which is the risk return adjusted metric used to computed MFO Return Group ratings. Martin is excess total return over 90 day TBill divided by Ulcer Index, as described in the paper by Peter Martin, entitlded: An Alternative Approach to the Measurement of Investment Risk & Risk-Adjusted Performance.
    If we look across all the asset allocation categories, VBINX ranks even better.
    Great post, Charles. Thanks for clearing things up !
  • VBINX
    Lipper puts VBINX in the Growth Allocation category. There are 113 such funds in its database ending January 2016, at least 10 years old, oldest share class only, open and closed.
    VBINX stacks up pretty well. Here is list from top, sorted by 10 year annualized total return (APR), which includes expenses, reinvested dividends, and any max front load. (As always, no accounting for category drift or survivorship.)
    image
    It beat out Dodge & Cox Balanced DODBX, which has delivered 5% APR, placing it 41 out of 113.
    Here is same list based a Martin Ratio, which is the risk return adjusted metric used to computed MFO Return Group ratings. Martin is excess total return over 90 day TBill divided by Ulcer Index, as described in the paper by Peter Martin, entitlded: An Alternative Approach to the Measurement of Investment Risk & Risk-Adjusted Performance.
    image
    If we look across all the asset allocation categories, VBINX ranks even better.
    MFO groups the following categories as Asset Allocation (AA) type: Target Today, Target 2010, Target 2015, Target 2020, Target 2025, Target 2030, Target 2035, Target 2040, Target 2045, Target 2050, Target 2055+, Conservative Allocation, Moderate Allocation, Growth Allocation, Aggressive Growth Allocation, Absolute Return, Convertible Securities, Flexible Portfolio, Retirement Income.
    There are 470 such funds ending January 2016, at least 10 years old, oldest share class only, open and closed.
    Here's how VBINX stack up on that list, again, by APR:
    image
  • VBINX
    What confusion and pointlessness.
    Is the question seriously being heatedly asked if PPGFR (past performance guarantees etc.)? We know the answer to that: No.
    Is it likely that outperforming balanced funds with long records and the same management will continue to outperform? We know the answer to that too --- sure it is likely in some sense, ... for the most part, ... within limits, ... given luck, ... and a whole host of other variables. This is the essence of mutual fund investing.
    Will they do it every year, or every n years? No. Over the long haul, will GLRBX outperform, given the same decisionmakers? Likely.
    How likely is likely? Who knows? It is unknowable. PPDNGFR.
    If you're uncomfortable or flummoxed or upset with all this mishmash of variables, hopes, predictions, anxieties, but still determined to make some conclusive statements or other, forget it --- and please, please, please do go w indexing, and stop publicly fretting the odds. Horse is buried, dug up, eaten, then reburied.
  • VBINX
    The main takeaway point in my view is this: "My thesis is this: Can you say you can pick the top 3.0% to 7.4% of all balanced funds over the next 10 years that will outperform VBINX"? Sure there will be a few out performers, but knowing which ones they are in advance, well that's the hard part. Going with something like VBINV or VWINX (my personal favorite, though actively managed) is a MUCH Better bet. Even those with long records of success can stumble badly...as I've learned over time that out performance by straying from benchmarks inevitably carries risk, which can bite one in the a$$ in time.
  • VBINX
    Do you believe GLRBX, FPACX, OAKBX and BERIX will still be the best performing funds 20 years from now? If the answer is no, then can you give me the names of the 4 funds that will outperform so I can buy them today? VBINX outperforms 90% of everything else so do you want to risk your capital attempting to pick the best youngest managers you have never heard of today from 1000 balanced funds? How many start up balanced funds have come into existence since 1997? Double that? So you would have had to pick the best 4 out of 2000 in 1997 in order to get the returns you speak of.
  • VBINX
    What I don't understand is why there is something important about looking back at the ten year returns of mutual funds in the same general group. As if it offers some kind of prediction of future returns. I compared the results of glrbx, fpacx, oakbx and berix going back to 1997. These funds are generally regarded as being good funds, not necessarily the best. All of the funds mentioned soundly beat vbinx. So we have a general idea that vbinx did very well compared to it's peers in the last 10 years. In the last 20, vbinx didn't do nearly as well as the above mentioned funds. How can we use this information regarding the future?
  • VBINX
    "find a way to do it accurately" Accurate conclusions is what you want... but you persist that VBINX ranks 24 out of 148 when you know many funds have closed over the last 10 years due to underperformance and you ignore adding that to your calculation.
    Just 5 closures a year would bring it back to high 88% outperformance.
    Worst case/your best case.....83% is a number that would still be hard to beat amigo.
  • VBINX
    You trust M*'s statistics more than mine. Good idea. Seriously. Just as I would trust M*'s suggestion that 12% of funds beat VBINX over your claim that just 7.4% did. It's large discrepancies like that (1.5x) which raise credibility issues.
    Over time, you'll find that a fair number of people here don't trust M* either, at least when it comes to which funds to count. You just hinted at that yourself with PRWCX.
    Though closing a fund for years strikes me as a funny way to gather assets. Sooner or later you'll learn that TROW is the most investor-friendly publicly traded investment company (yeah, I know, faint praise).
    Regarding which funds to count, you dismissed my selection of VBIAX as being the same fund as VBINX. Fine with me, I agree with your thought that funds should only be counted once. But then you turned right around and referenced a M* figure (12th percentile) based on 501 moderate allocation "funds" with ten year records. Two of the funds in that list of ten year funds are VBIAX and VBINX. You were the one who picked the list of funds, I just selected a fund off your sanctioned list.
    You don't have to believe me. The 148 unique fund figure I cited came straight from M*. You can get it yourself. There may be around 500 moderate fund share classes with ten year records, but there are only around 150 funds (using your understanding of funds - counting VBIAX and VBINX as one fund).
    One doesn't need a M* premium membership to figure this out. Just use their basic fund screener. Though it is limited to returning 200 funds (i.e. share classes), one can coax all 500-ish out by asking for them in three pieces - 4* and 5* funds, 3* funds, and then 2* & 1* funds. (Any ten year fund should have a star rating, so that captures all of them.)
    Ask for moderate allocation funds with ten year performance exceeding (-10%), and do the star breakdown described. The neat thing about this exercise is that because the results come back alphabetically, it's very easy to scan for unique funds (as opposed to share classes). While this will still double count some funds (if a single fund has one share class with 3 stars and another with 4 starts), it gets you in the right ballpark.
    It will show how exaggerated that M* 500 fund figure is, at least if you're not going to allow me to pick VBIAX :-) (i.e. if you're going to stick with counting unique funds only once).
    I count around 70 unique 4 and 5 star funds (out of 191 share classes, including three instances of Vanguard Balanced Index). I could be off by a couple of unique funds as I counted quickly. The point is to see, in front of your eyes, M*'s (not my) data - how many unique funds there are, how some funds get counted many more times than others. Just look at that first page - it's nearly filled with different share classes of a single fund - American Funds American Balanced.
    Along with 76 unique 3 star funds (out of 176 share classes) , and 43 unique 1-2* funds (out of 124 share classes), this totals 189 potentially unique funds out of 491 share classes.
    We can eliminate much of the double counting by performing two more screens - checking for 2 and 3 star funds (and subtracting any fund that shows up with both 2 and 3 stars), and then checking 3 and 4 star funds.
    Unfortunately, there are more than 200 2* and 3* funds combined, but even working with the 200 returned, there appear to be at least 18 duplicates there, and at least 19 duplicates between 3* and 4* share classes. Subtract 37 from 189, and we get 152 - darn close to the 148 unique funds that I said came from M* data.
    Notice what I did. I showed how to reproduce the results and provided the methodology - what the definitions were, what was being counted. This adds to both comprehension and credibility. I showed that you too can come up with figures similar to the ones I gave above.
    This exercise demonstrates just how much shrinkage there is going from share classes to unique funds. It offers a glimpse into how much distortion there is, when a single fund like American Funds American Balanced can get counted 16 times, while a fund like T. Rowe Price Cap Ap is counted only twice. This insight can lead to better understanding of what the numbers mean (and what the odds really are, and what factors can improve those odds).
    Don't follow your 322 funds. They're not unique funds (by your definition), and they're skewed (I hope by now you're at least considering the possibility that by using Fidelity's screener to eliminate closed funds, you may be distorting your results by excluding funds like PRWCX and Wellington). Spend some time figuring out what you do want to observe, find a way to do it accurately.
  • VBINX
    PRWCX is a great great fund, but possibly an equity fund cloaked as a balanced fund in order to gather assets. I will spend some time researching in that area.
    @shipwreckedandalone: Please share the results of your research when you have finished. I have myself long suspected this is really an equity fund. And having held PRWCX since the mid-'90s, I've always considered it part of my equity allocation. This has caused more than a little consternation and second-guessing as to whether I have it placed correctly. Seems to me various rating sites have classified the fund over the years at various times as equity, moderate allocation, balanced or even hybrid.
    Observing its performance now for nearly two decades, I can say PRWCX consistently behaves on a daily basis like a balanced fund (the old walks like a duck, quacks like a duck test). However, Price places it among their equity funds at their website, reserving the balanced label for others (seeming to dispute your suggestion they're intentionally misrepresenting the fund). But they put the fund's recent domestic stock component at 60% - exactly where you would expect a 60/40 balanced fund to be.
    Curiouser and curiouser
    From T. Rowe's website: Composition of PRWCX (closed to new investors)
    Asset Allocation as of 01/31/2016
    Domestic Stock 60.0%
    Domestic Bond 21.0%
    Cash 11.1%
    Foreign Bonds 4.5%
    Foreign Stock 2.0%
    Convertibles 1.2%
    Preferreds 0.8%
    Options -0.2%
  • Is There Any Value In Value Investing ? Value vs. Growth Debate
    90 years of academic research shows outperformance of small cap value vs. all other stock universes https://docs.google.com/document/d/1kToqLWLISRk4n4YnSzv1hT5kBN54l5CvhwGgDwJKPJI/edit?usp=sharing. Money may have been flowing into large mega cap growth stocks that pay dividends over the last 12 years because of favorable tax treatment instituted during the G. Bush administration. But that universe has since become overvalued in the last couple years advisorperspectives.com/articles/2015/12/15/why-dividend-paying-stocks-are-riskier-than-you-think/4.
  • Worst 12 months since financial crisis
    Don't know about junk corporates; I'm tempted to first buy more shares in the core low-vol, "quality" equity funds I own when it looks like a general turn toward risk assets is happening.
    On munis, the last WealthTrack guest, Dimella of Mainstay muni funds, said he expects he'll stay fairly junky in his HY muni fund for the time being. He cited munis' yield as 95% of T's of same maturity now, down from the 100% + of the past several years but still above the long term 80-some-%. So, to him they still look good on a tax-equivalent basis.
    That leaves rates, not competition with Treasuries, as the main risk, and rates have taken such a deep dive, seems pretty certain they'll be higher to some degree in the not-too-distant future. Meanwhile, several muni cef's with really overbought signals are still doing fine. There's got to be a momentum swing coming, just a matter of when.
    P.S. Dimella's MMHAX looks like a decent fund - prob'ly competitive with and a little less volatile, up and down, than NHMAX.
  • Why Vanguard Is About To Engulf The Financial Planning Industry
    Centralized advice is ok, but it is often superficial. The fact that Vanguard might be getting some clients from the banks and full-service brokerages is not surprising, since those outlets are all about selling products (load funds and annuities). But the RIA community has been taking market share from the same group for years now.
  • VBINX
    msf, 1. Can you please provide the number of Allocation funds that have closed or merged due to underperformance during those 10 years that VBINX has outperformed?
    Answer: yes. Will I? No. You can spend your own time. Question is ambiguous in any case. I could expound upon that, but it would be pointless. So I'll just give one broad group of "funds" that have vanished in the past ten years for a reason other than underperformance. It's not clear from your phrasing whether you are asking for them to be included in the count or not.
    Many B class shares (you're counting share classes as "funds") have folded in the past decade, because they are no longer easily marketed. They have neither been "closed" or "merged"; they have vanished by attrition. B shares automatically convert to other share classes (typically A, but sometimes other classes) in under ten years. Many fund families have closed purchases of B shares (but not shut down the share class). Consequently, after a few years, there have been no shares left. Of course the funds still exist; that's a muddle one creates by conflating share classes and funds.
    You ignored that number in your misrepresentation of my numbers. Please add those back into your denominator and recalculate.
    Interesting claim. Would you care to say what I misrepresented? Did you not conflate classes and funds? Did you not count index funds among actively managed funds? Did you not omit in your figures any "funds" (i.e. share classes) that one could not purchase at Fidelity despite the fact that Fidelity provided figures on the larger (i.e. M*) universe of moderate allocation funds? Did you not overstate the number of ten year "allocation" funds (without defining that term) by nearly a factor of two by including 550 funds that had not existed for ten years?
    I never suggested intentional deception, just that for these reasons the figures presented were misleading.
    If by "misrepresenting your numbers" you're saying that I didn't point out all your inaccuracies, that is indeed correct. Yes, there are more, such as the vanishing of "funds" (i.e. share classes) that did exist ten years ago. The fact that you had even more inaccuracies than I pointed out, regardless of their numeric impact, hardly strengthens your position that these are meaningful numbers.
    Gosh, instead of ten errors, I made fifteen, and some of those balance out, so my figures are really reliable after all. Sure. If you want people to have faith in your figures, and hence to discuss them, it's incumbent upon you to make them credible. Not me. 98.6% superiority is not credible. Theoretically possible (see below), but not credible.

    2. Do you believe you can pick a fund(s) to invest in today that will outperform VBINX over 10 years?
    Absolutely, and I did - VBIAX. You can't have your cake and eat it too. If you are going to consider and count each share class separately, then I am free to pick VBIAX as competing "fund". If not, think about going back, fixing your "fund" data, and providing credible figures to discuss.

    If VBINX has outperformed 88% over the last 10 years? Morningstar shows a rank of top 12 for 10 year performance for VBINX Moderate Allocation. Also USA Today shows 12. Also both not counting closures due to underperformance.
    Or due to lack of interest by investors for any other reason as well. Glad to see that you found the same data that I pointed out to you at the Fidelity site.
    What you've omitted is the size of the remaining universe outside of Fidelity. The total (per the Fidelity page giving M* figures) is 501 moderate allocation funds. Let's do a little arithmetic. 23 "funds" in the Fidelity universe outperformed VBINX. And 60 funds in the "total" (M*) universe outperformed. That means that 37 funds not in the Fidelity universe (including BTW VBIAX) out performed. That's out of an additional 179 funds (501 minus your 322 figure). So merely by selecting from the funds not offered at Fidelity, we've increased our chance of randomly outperforming from 12% to 20+%.
    Not really, though, because I've built upon one of your errors. Can you identify it? I'll give you the answer at the end of this post.

    I am not asking you if a fund will outperform VBINX over the last/next 10 years. That is a certain.
    It's extremely likely, sure. But mathematically certain? No.
    Say you have a universe of four securities; three of them return 0%, one returns 10%. The index fund invests in all of them, and so it has a positive return. All the other funds invest in some combination of the three securities returning 0%. (They leave the fourth security to the index funds and to individual investors; these are the 98.6% stupid managers you started your post with. We can hypothesize that the other 1.4% are simply inattentive, not stupid.)
    We now have VBINX (or whatever you want to call the index fund) outperforming 100% of all other funds.

    I am asking you are you brash enough to believe that TODAY you could pick a moderate allocation fund that will outperform over the next 10 years?
    Your phrasing ("brash") exposes your preconceptions. You start with the assumption that something is virtually impossible (okay, 98.6% impossible), and therefore any suggestion to the contrary must be brash, as opposed to reasoned.

    This is the basis for my post.
    Yes indeed.

    3. If analyst depth of T Rowe Price works well relative to performance should we blindly assume all funds will behave as such when the manager leaves? The peanut gallery opinion will be a definite "no" on that one. You assume the analysts will not change employment as well or go with the PM to their new employer..
    All funds don't have the same depth of analysts, so no, we should not assume all funds will have the same degree of continuity. You're also disregarding other factors with TRP, both ones I've mentioned and others that are easy enough to discern. One is that TRP ensures a smooth handoff of management, as contrasted with, say Fidelity, where a management change is a warning sign for chaos, portfolio turnover, and changes in fund direction. Another is that when managers leave T. Rowe Price, it is typically to retire. I named the last three fund managers for PRWCX. You could have checked where they went afterward. Arricale stayed with TRP to manage another fund until 2010 when his personal life got really messed up and he was unemployed for sixteen months. Somehow, I doubt analysts followed him down that path. Bosel retired.

    Thank you for alerting me to the 550.
    Any time. Now you can apply that learning to identify the error that I utilized above. The number of 10 year moderate allocation funds in the Fidelity universe is not 322, but just 243. The others don't have ten year records. So the actual percentage of funds (surviving share classes, if you prefer) that beat VBINX was 23/243 ~= 9.5%. And the percentage of non-Fidelity funds beating VBINX was 37/(501 - 243) ~= 14%. Still an improvement over the 9.5% that one would get with Fidelity-sold funds, or the 12% general universe.
    It still shows that one can improve the odds merely by purchasing a fund not sold in a fund supermarket. Not because of the arithmetic, but because of a latent factor - lowest cost funds tend to eschew supermarkets. One can do better still by looking for low cost, well managed funds directly. See my previous post.