Howdy, Stranger!

It looks like you're new here. If you want to get involved, click one of these buttons!

Here's a statement of the obvious: The opinions expressed here are those of the participants, not those of the Mutual Fund Observer. We cannot vouch for the accuracy or appropriateness of any of it, though we do encourage civility and good humor.
  • When it comes to alloaction funds___
    SFAAX. I'm still not with any broker/dealers, so the 5.75% load is a non-starter. Thanks for the info, though, Old Skeet. Others might need it. Also, anything with the Wells name gets a score of zero from me. Screwing customers, opening false accounts... The very culture is toxic. The courts gave them a slap on the wrist "punishment." We bought bedroom furniture through a local store at the mall. Interest rate of zero for 5 years. Through whom? Wells. Shit! OK...
  • NYT on Bond Funds Crisis: Nothing to see here
    Thanks for all of the links above.
    In 2008, I was primarily in equity stocks. I just stopped looking at the market. And given some time, did fine. Stocks did what they were going to do.
    Fast forward to now, in February/early March, having 50% of my retirement portfolio allocated to bonds, I switched from what I thought were riskier bond positions (riskier being credit/liquidity-wise) to more core-like ETFs, but was quite surprised to see how even core bond ETFs ended up being so volatile. There is something different in reading about the risks in a prospectus vs experiencing them. Lesson hopefully learnt.
    The yahoo finance link on ETF bond pricing made clearer what I vaguely knew though was still disconcerting. But for a long term holder of these ETFs or mutual funds, does it actually matter? The interview with Matt Hougan, I thought suggested not, though he certainly seems to favor ETFs over mutual funds because of the price discounts when redemptions are involved.
    With said volatility, it will be interesting to look back & see actual investor returns vs fund performance for bond funds. I suspect it will be more stock-like going forward.
    How much does the ability to trade (individual investors &/or institutions ) bond ETFs throughout the day add to the volatility of pricing? Core mutual fund bond funds seemed to do better until the bailout occurred.
  • T Rowe Price International Funds
    I own PRIDX. ... It fell hard with coronavirus. But it's coming back, down -13% now, ytd. Down to 3 stars, but still with a silver decoration. ... Top 15% among peers, ytd. Not a great showing compared to peers LAST year, but still very good indeed.
    For a few months, I've been promising myself to make a post on being careful about what numbers do and don't represent (i.e. look behind the numbers). Figures like ERs, duration, performance. One of these days.
    Meanwhile, to deconstruct these numbers and ratings a bit:
    PRIDX outperformed both its benchmark and its category 2019 Q4, 2020 Q1 and YTD, so while it fell hard with coronavirus, on a relative basis it performed admirably. It's the whole market that has come back (to some extent), and PRIDX has more or less just kept up its rate of outperformance.
    So why the 3 stars? M* continues to rate its risk as below average (as of March 31) for 3 years, 5 years, and 10 years. Also as of March 31, M* rates 3/5/10 year performance as average, above average, average.
    http://performance.morningstar.com/fund/performance-return.action?t=PRIDX&region=usa&culture=en-US
    Generally, above average return with below average risk gets a fund into, or close to a 4 star rating. Thus, as of March 31, PRIDX was rated 4 stars for the five year period (above average performance), but 3 stars for the three and ten year periods.
    The overall star rating is a weighted average: 3 years (20%), 5 years (30%), and 10 years (50%). So PRIDX gets 3 stars.
    https://www.morningstar.com/content/dam/marketing/shared/research/methodology/771945_Morningstar_Rating_for_Funds_Methodology.pdf
    Now take a look at the 3/5/10 performance figures. To be rated above average, a fund must be in the top 32.5% of its category (but not in the top 10%).
    PRIDX came close to above average performance, but didn't make it over 3 years (38th percentile) or 10 years (33rd percentile). Shift that 10 year performance a little and the 10 year star rating should move up to 4 stars, bringing the overall weighted average rating also up to four stars.
    It looks like this has happened. Take performance rankings through today (April 26). 10 year moves up to 27th percentile, 5 year drops slightly from 14th to 17th percentile, and 3 year moves up to 29th percentile. All above average performances.
    So one should expect the star rating to move back to 4 stars when it's recalculated unless the fund stumbles in the interim.
    All of this goes to show that even when looking at long term performance, what a fund has done lately can have a significant impact.
    The poor showing last year? Over the whole year it underperformed its category by 3.18% where the average gain was 27.78%. Not a great showing, but not as bad as its 71st percentile would superficially suggest. Also, it never had a really bad quarter; it just chugged along, trailing by as much as 1.18% in Q3 and as little as 0.25% in Q4. Not great, but fairly consistent and nothing obvious to get concerned about.
  • Updated Trinity Study for 2020 – More Withdrawal Rates!
    Thank you for the link. Have to read more.
    For example a portfolio of 100% PRWCX would have a "Safe Withdrawal Rate" of 10% and a "Safe Perpetual Withdrawal Rate" of 5.6%. The rule of thumb for a Safe Perpetual Withdrawal Rate is 4% according to the Trinity Study (linked below).
  • A Look At The Current State of the Economy ( & Markets) and Where They May Be Headed -- Heisenberg
    This article provides a useful look at the current situation and possible future trends. (Some may find it useful to glide around the more dystopian/dramatic references in the article.) Here are a few excerpts:
    The manufacturing sector hasn't completely rolled over yet, but the services sector simply ceased to exist starting late last month.....The message is clear: Main Street isn't just hurting, it is disappearing in a very literal sense. As Atlanta Fed boss Raphael Bostic warned earlier this month, "May is going to loom large, in terms of the transition of concern from this being a liquidity issue… to this perhaps translating and transferring into a solvency issue, and whether companies can exist at all."
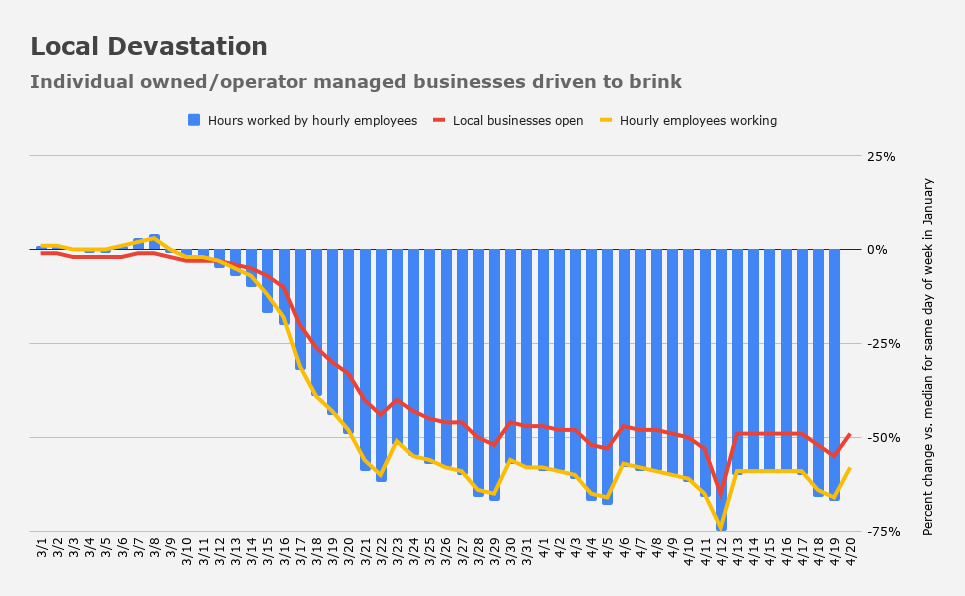
    image
    (...from Homebase, a scheduling and time tracking tool used by more than 100,000 local businesses covering 1 million hourly employees.)
    .
    .
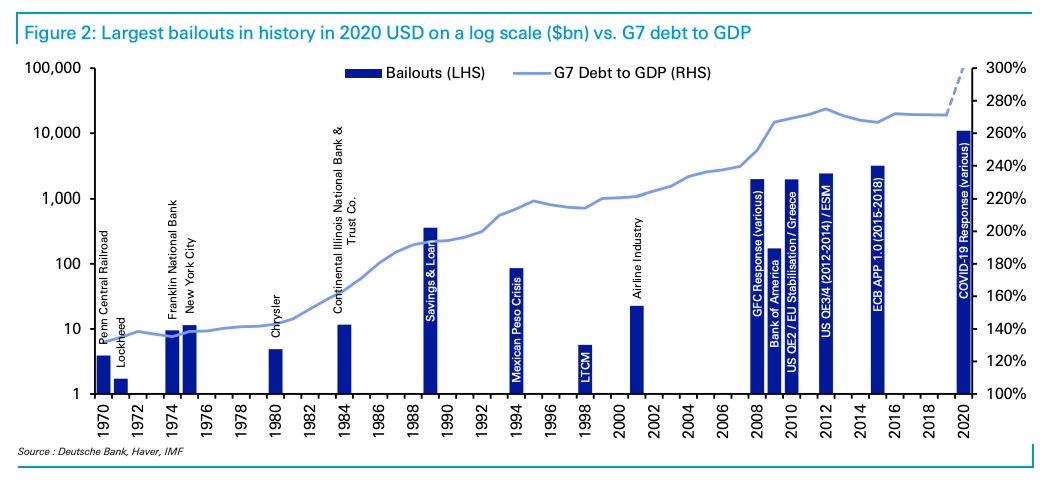
    Deutsche Bank rolled up the fiscal and monetary support programs announced and implemented in the US and Europe into a single "bailout" figure. The sheer size of the COVID-19 response necessitated a log scale (on the left axis) in order to help "better identify the earlier bailouts and get a rough feel visually for the numbers," as the bank put it. ....."Obviously we won’t know how much will be used until much further down the road," the bank cautioned, in the course of presenting the numbers and accompanying visuals.
    image

    ....policymakers have been deliberately suppressing volatility, compressing risk premia, tamping down credit spreads and keeping the market wide-open for borrowers for the better part of a decade....
    Deutsche Bank's George Saravelos.....At the extreme, central banks could become permanent command economy agents administering equity and credit prices, aggressively subduing financial shocks. With unlimited capacity to print money, central banks have unlimited capacity to intervene in asset markets too. Put simply, a central bank that pegs bond, credit and equity markets is highly likely to stabilize portfolio flows as well.
    https://seekingalpha.com/article/4340027-dystopia-now
  • FGDFX - Fidelity Disruptor Fund
    I believe that, unlike many cash back cards, Fido credit card now sends the tax form for these 2%, so it is not 2% cash back (no taxes, just cash return), but 2% minus taxes.
    This has been settled law for decades now. Here's a CNBC page discussing whether rewards are taxable.
    https://www.cnbc.com/select/are-credit-card-rewards-taxable/
    As it states, rewards (whether points, cash, or miles) are not taxable so long as you had to spend something to receive them. So a signing bonus that did not require a min spend would be taxable, but that's about the only exception. (Here's Fidelity's $100 sign up bonus promotion that requires spending $1,000 in the first 90 days.)
    Fidelity does have an option to contribute the rewards to an IRA account. In that case, the reward is considered a contribution. That both reduces the amount of additional money you can contribute to the IRA and permits you to take a deduction for the contribution. Of course, as Fidelity points out, if you are not eligible to make that contribution, then the amount is subject to an excise tax.
    For completeness, I just checked the 2019 Fidelity Combined 1099 for someone I'm helping with taxes. There is no amount entered for cash back from the card. The only entries in these 1099s are for divs received from funds.
    The rules about combining credit card rebates with IRAs could lead one to think that the rewards were taxable. Perhaps this is what you were thinking of, or was there something else?
  • Updated Trinity Study for 2020 – More Withdrawal Rates!
    Using tools like Portfolio Visualizer (click on
    metrics tab) an investor can review historical data on the safe withdrawal rate of their portfolio. For example a portfolio of 100% PRWCX would have a "Safe Withdrawal Rate" of 10% and a "Safe Perpetual Withdrawal Rate" of 5.6%. The rule of thumb for a Safe Perpetual Withdrawal Rate is 4% according to the Trinity Study (linked below).
    Understanding these concepts is an important element of "safely" deriving a portion of one's income in retirement over a time frame of 30 - 50 years.
    From the Article:
    First, I wanted to see how this was working with recent stock market returns. The original study was only covering years up to 1995. I wanted to have more recent data. I wanted to make sure that the results were holding with more recent stock market behavior. So this simulation will cover returns until the end of 2019!
    Secondly, the original study was only covering up to thirty years of retirement. I wanted to be sure that the portfolio can sustain withdrawals for much more extended periods. For people retiring early, I think that 50 years is not unreasonable.
    The Trinity Study:
    https://thepoorswiss.com/trinity-study/
    The Update to the Trinity Study for 2020:
    https://thepoorswiss.com/updated-trinity-study/
    Here's a 4 Part Series on the Topic.
    Part 1:
    safe-withdrawal-rates-guide-part-1-background.html
    Part 2:
    https://fiprofessor.com/2019/07/14/safe-withdrawal-rates-guide-part-2-enough-data.html
    Part 3:
    https://fiprofessor.com/2019/07/21/safe-withdrawal-rates-guide-part-3-more-bootstrapping.html
    Part 4:
    https://fiprofessor.com/2019/07/27/safe-withdrawal-rates-guide-part-4-perpetual-rates.html
  • When it comes to alloaction funds___
    Hi guys. Another asset allocation fund that I like ... but, do not own is SFAAX. They use to be more transparent with posting their positioning but now they just list their baseline asset allocation as a 40/60 (bond/stock) portfolio. However, I know it gets jockeyed from time to time based upon the manager's read on the makret. I have learned that its stock allocation can range from a low of 45% upwards to a high of 75% while its bond allocation can range from a low of 25% to a high of 55%. It is another fund that has performed well in this recent stock market downdraft. In checking it's performance I'm finding that it is down year to date by -2.65% with a ten year average total return of +9.39% as of 4/24/2020. And, as I write, it is off it's 52 week high by 6.68%. In comparison, the S&P 500 Index is off its 52 week high by 16.2% with a ten year average return of around 11.0%. With this, the fund does employ and offer some downside risk measures while providing excellent returns for an asset allocation fund.
    MFO list this as a moderate asset allocation fund with a risk level rating of 3 and with a performance rating of 5. And, yes it made MFO's Honor Roll.
    Anybody on the board own this fund? If so ... perhaps, you would be willing to report its positioning from its latest shareholder report? And, make some additional comments. I'd be most interested in learning of your comments and thoughts.
  • T Rowe Price International Funds
    I own PRIDX. Almost all my stuff is with TRP. "International Discovery." Smid-caps. M* rates it as mostly mid-cap growth. It fell hard with coronavirus. But it's coming back, down -13% now, ytd. Down to 3 stars, but still with a silver decoration. Turnover is 26% in the portfolio. I don't take Morningstar as gospel, but it's what I see most of. You get accustomed to navigating a particular website. Top 15% among peers, ytd. Not a great showing compared to peers LAST year, but still very good indeed. Upside capture is less than the 100 you'd like to see (or better,) but downside-capture is 85, and that's better than peers--- at least as Morningstar has them grouped. I'm sticking with it, but it's just 5.5% of portfolio. My TOTAL ex-USA stocks = only 7% now.
    Here's the US NEWS magazine's TRP listing and ranking of TRP funds:
    https://money.usnews.com/funds/t-rowe-price
  • What's UP in bondland??? , a follow-up
    Howdy,
    A quick look for bond returns since March 20, when the bond markets were having problems.
    As bonds in one form or another are part of many portfolios, the below numbers may provide an overview on the actions of some of your holdings.

    I place the below again from a March 20 post.

    A few views from bondland:
    DAY(March 20) / WEEK / YTD
    --- MINT = -1% / -3.6% / -4.1% (Pimco Enhanced short maturity)
    --- SHY = +.27% /+.24% / +2.5% (1-3 yr bills)
    --- IEI = +1.2% /+.7% /+5.2% (3-7 yr notes)
    --- IEF = +2.6% /+1.5% /+8.4% (7-10 yr notes)
    --- TLT = +7.5% / +3.6% /+18.1% (20+ Yr UST Bond
    --- EDV = +7.15% / -.23% / +19.8% (Vanguard extended duration gov't)
    --- ZROZ = +8.93% /+2.27% /+22.3% (UST., AAA, long duration zero coupon bonds)
    ***Other:
    --- HYG = -2.24% / -12.9 / -20% (high yield bonds, proxy ETF)
    --- LQD = +1.6% / -13.25% / -16.2% (corp. bonds, various quality)
    --- LTPZ = +12.3% /+4.3% / +3.5% (UST, long duration TIPs bonds
    I had also previously noted that EDV, TLT and ZROZ can be very hot potatoes to manage and require a close watch and what may adjust their performance directions.
    Below, week ending April 24 with YTD only, which you may compare to March 20 YTD, above:
    These below are AAA credit, except Other.
    --- MINT = - .57%
    --- SHY = + 2.8%
    --- IEI = + 6.5%
    --- IEF = +11.2%
    --- TLT = +26.7%
    --- EDV = +36%
    --- ZROZ = +39.8%
    ***Other:
    --- HYG = -9.7% (high yield bonds, proxy ETF)
    --- LQD = +2.3% (corp. bonds, various quality)
    --- LTPZ = +19.6% (UST, long duration TIPs bonds
    Take care,
    Catch
  • FGDFX - Fidelity Disruptor Fund
    At Fidelity:
    PTTAX has no fees but min is $1000.
    PTTNA has a fee of $49.95 to purchase
    PTTRX has one million min.
    None is a good choice for most investors.
    At Schwab
    PTTAX has no fees but min is $100.
    PTTNA not available
    PTTRX has one million min and a fee of $49.95.
    You just proved my point.
    Loomis vs Pimco. In the last several years Loomis funds never made my final 5 top funds but Pimco funds many times.
    One example among many: Just several weeks ago we discussed bond funds on M*. One of the funds was CBPSX/SAMFX(instit). At Fidelity, CBPSX has $2500 min no fees, SAMFX $100K min + fee=49.95. At Schwab, CBPSX has $1000 min no fees, SAMFX has no fees + only $100 min.
    I can give many others and especially funds I traded.
    Many times I can find new funds at Schwab several months before they are available at Fidelity
    Sure, Fidelity may have several choices that Schwab doesn't but Schwab is hands-down better.
    ==============
    I actually tried Fidelity ATM several years ago at Europe and they changed me the 1% fee while Schwab didn't
    ==============
    Just 2 months ago I received a cash reward of $300 when I transferred just over $100K to Schwab, you are correct, you will not find it but if you ask you will get it. I had to submit a proof that another broker does it. Etrade does (link). This offer used to be for IRAs too. Over the years I have tried many times at both and again Schwab reps worked with me much better.
    ==============
    Fidelity is better at
    1) Adding to Inst fund for only $5 (many don't know this choice)
    2) You can sell mutual funds after 60 days without a fee, at Schwab it's 90 days.
    3) 2% cash back credit card.
    I beat number 1,2 by buying only Instit shares and I don't pay for that.
    I use the Fidelity credit card. You can find 2% elsewhere but I like the convenience.
    The most annoying for me at Fidelity is selling and buying funds on the same day and the inability to buy a stock/ETF when your account is invested completely in mutual funds.
    Lastly, both Fidelity and Schwab are the top 2 for most investors but for my needs, Schwab is much better. I find Fidelity more rigid than Schwab.
  • FGDFX - Fidelity Disruptor Fund
    "All Pimco Instit shares have one million min at Fido but just $100K at Schwab. This means that for every $100K you will save $250 at Schwab per year"
    PIMCO Total Return Fund costs by share class (from summary prospectus):
    PTTAX (Class A) : 1.05%
    PTTNX (Class I-3):0.86%
    PTTRX (InstClass):0.71%
    No pairwise combo adds up to a $250/$100K per year difference.
    "Trust but verify" works best when figures are actual and not theoretical based on what one thinks they ought to be. Often the ERs of retail and institutional shares differ by precisely 0.25% due to a 12b-1 fee on the retail shares. But unlike many fund families, PIMCO also charges a higher management fee on its retail shares.
    Fidelity will sell you PTTNX, so the difference on a $100K investment comes to $150/year (0.86% ER vs 0.71% ER), not $250. Still, that's real money, right? Absolutely, if one wants to invest $100K or more.
    Suppose one wants to invest "just" $25K. At Vanguard, one could buy the institutional share class and save $85/year over buying the retail shares at Schwab. Or one could buy the I-3 shares at Fidelity and save $37.50/year over buying the retail shares at Schwab.
    In fact, one doesn't have to pony up even that much at Fidelity, where there's no min on PTTNX.
  • Old_Skeet's Market Barometer ... Spring & Summer Reporting ... and, My Positioning
    Hi guys,
    This week I thought I'd post the daily movement of the barometer in this way you might come to a better understanding of what went on in the market this past week in relation to stock market volatility along with the brometer's daily movement.
    In review, last Friday's barometer reading was 143 with the S&P 500 Index closing at a valuation of 2875 indicating that the Index was overvalued. On Monday, the Index closed with a valuation of 2823 which produced a barometer reading of 150 indicating that the Index was at fair value on the barometer's scale. On Tuesday, the Index pulled back again closing at 2737 which produced a barometer reading of 163 indicating that the Index was now oversold based upon the metrics of the barometer. On Wednesday, the Index gained a little lost ground and closed with a reading of 2799 which produced a fair value reading on the barometer's scale at 150. Thrusday, the Index closed the day with a valuation of 2798; and, with this, there was not much that changed with the barometer's reading which remained at 150 and fair value. On Friday the Index moved upward and closed with a reading of 2837 whcih produced a barometer reading of 144 indicating that the Index had moved back into an overvalued reading of the barometer's scale. Energy was the only sector that was positive for the week and was up +1.67%. For the week the S&P 500 Index lost -1.3%.
    If I had just posted the week ending barometer readings this week one could have assumed that not much took place during the week ... whereas ... a lot did. On a weekly basis the barometer reading went from a Friday to Friday close from 143 to 144. But, to really understand what actually went on you have to follow the Index's daily movement which is detailed in the above paragraph.
    My three best performing funds for the week were all found in the growth area of my portfolio. They were KAUAX +2.43% ... AOFAX +2.42% ... and, FKASX +2.15%.
    Thanks for stopping by and reading.
    Take care ... be safe ... and, I wish all ... "Good Investing."
    Old_Skeet
  • Options for Income and Taxes
    commisions are non-existent. you only pay by # of contracts you trade. And it is 65 cents at Schwab, Fidelity and TD Ameritrade. At Vanguard it is $1.0
    I made $500 selling OTM puts in SPY last week in my fidelity account. SPY has 3 expiry dates every week. I just sold PUTs the day before each expiry. It was ridiculously easy.
    There is something called beginners luck. I'm going to give this couple of months. If I continue to generate this kind of money I don't need RPHYX and RSIVX.
  • Get Ready for the Return of Inflation Fed actions have increased...money...at a blistering rate
    Thanks, @catch22. Clear, very clear. Total return is the goal. From Trad. rollover IRA, this year is the first time I've taken anything out of there. It's all with TRP. Turns out my timing was fortuitous. (Sell HIGH, not low!) Holy cow, that's 4 syllables.
    ....Still re-investing everything, otherwise. I've got 7 years until age 72 and RMDs. I do have my eye on Total Return, and I'm happy with my portfolio. I pine for the days of 5% CDs. Simple, easy, insured, rather foolproof...... That one, single big chunk was taken from PRWCX. Feels big to ME, but it was just $4,000.00. We're in no tax danger. I'm holding up well, since the market's swoon. I'm into single digits tonight, in terms of the "loss" from the all-time highs back in Feb.
    Thanks for thinking of me. DAMN this keyboard. I have to type everything twice.
  • Get Ready for the Return of Inflation Fed actions have increased...money...at a blistering rate
    I wouldn't think inflation would be such a bad thing in some ways anyway. Wouldn't CD and MM rates of 5-6-7% again be a pretty nice outcome for retirees? Inflation also helps reduce the burden of national debt, oddly enough.
    I'm looking for the silver lining here :)
  • Get Ready for the Return of Inflation Fed actions have increased...money...at a blistering rate
    This article just provides a warning about what may happen in the intermediate term when the Fed and Congress try to steer things back towards "normal". (The author didn't note this, but much of what he discusses is occurring on a global basis not just in the U.S)....
    Fed actions have increased the quantity of money in the U.S. economy at a blistering rate.
    By Tim Congdon
    The economists Milton Friedman and Anna Jacobson Schwartz demonstrated in “A Monetary History of the United States” that a collapse in the quantity of money was the main cause of the Great Depression. Hoping to avoid a repeat, the Federal Reserve in recent weeks has poured money into the economy at the fastest rate in the past 200 years. Unfortunately, this overreaction could turn out just as poorly; history suggests the U.S. will soon see an inflation boom.
    Excluding the years immediately after the Revolutionary War, the past few weeks have seen by far the highest rate of monetary expansion in U.S. history. The Fed might defend itself by saying that its “shock and awe” tactics have given financial markets confidence that the coronavirus won’t cause a long and deep recession. And its massive bond purchases—more than $500 billion between March 11 and April 1—surely won’t continue at the same rate for the rest of the year.
    It’s reasonable to assume that by spring 2021 the quantity of money will have increased by 15% and possibly by as much as 20%. That wouldn’t quite match the peak rates of expansion seen during and immediately after the two world wars of the 20th century, but it could surpass peacetime records, outpacing the previous peaks in the inflationary 1970s.
    As in wartime, federal expenditures are rising sharply while tax revenues are being hit by the lockdown. Both World War I and World War II—and, indeed, the Vietnam War—were followed by nasty bouts of inflation.
    Mr. Congdon CBE is chairman of the Institute of International Monetary Research at the University of Buckingham, England.
    I don't subscribe but for some reason the link worked for me.....
    https://wsj.com/articles/get-ready-for-the-return-of-inflation-11587659836
  • When it comes to alloaction funds___
    @linter. Thanks for your question. I hold a good slug of CTFAX in my taxable account. Overall about 65 percent of my investments are held in taxable accounts since I have been an investor for the past sixty plus years from the age of twelve. And, simply stated ... I feel I'd be buying the distribution if purchased now. Yesterday, CTFAX sold down equities from an allocation of 70% to 40%. This sell activity will no doubt result in a sizeable capital gain payout in the upcoming June distribution.
  • When it comes to alloaction funds___
    Hi @Bobpa, My portfolio generates more income than I presently need. With this excess I continue to invest it back into my portfolio and grow my investment farm. At one time, I thought I'd reduce my asset allocation to produce just my my current income needs. But, as Lee Iacocca use to say ... "Lead, Follow or Get Out of the Way!" So, if you are not growing your principal you are losing to inflation. With this, I looked at what a conservative asset allocation (30% to 50% equity) would produce over time and I came up with somewhere between 4% to 6%. Trade around the edges, as I have done, and perhaps get up to 8%. I use to do a good number of spiffs from time to time. I see you list CTFAX as one of your choices. I like the fund and now, I let CTFAX automatically do some of my spiff positioning, for me. As you can recently see in this stock market volatility it has proved it's metal as it adjust its equity allocation based upon the movement of the S&P 500 Index. I plan to buy more of CTFAX after it makes it's June distribution.
    You might also want to look at convertible securities funds. The one I use is FISCX.
    In addition, my asset allocation is as important, to me, as the funds that I hold within my portfolio along with my investment strategy. My base line allocation is 20% cash, 40% income and 40% equity. From there I can tweak this up of down + (or -) five percent and generally rebalance at + (or -) two percent from my target allocation. When stocks go on sale why not own more of them? Currently, my temporary asset allocation while I'm playing this stock market pullback is 15% cash, 40% income and 45% equity. I recently let my equity allocation peak at 49% and then booked some profit reducing it to 47%. I'll be booking some more profit soon and I will be trimming equity back to 45%. From here I'll let it again move upward as the stock market recovers and trim again booking some more profit. And, keep on keeping on by repeating the process.
    Something to ponder? Yes.
    I wish you well with your investing endeavors.
    Old_Skeet