
It looks like you're new here. If you want to get involved, click one of these buttons!
AAA bonds found some "lovers" this past week. For a week compare, if you choose; review the week return at the start of this thread and compare to the below returns.Bonds not getting any love right now
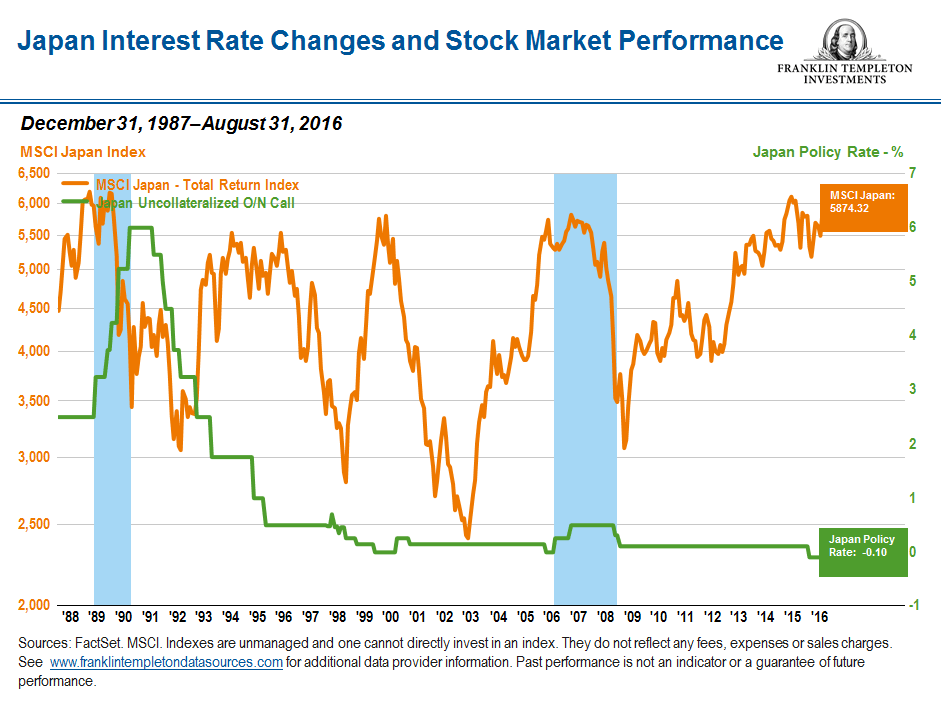
Personal note: the yield on this 30 year bund was at -.05% at the time of the auction.
For those with longterm views and appropriately positioned accounts & investing mentalities, I suspect it'll end in annoying and noticeable whimper. But for those who 'bet it all on XYZ because CNBC/Twitter/Newsletter said so' and just play the markets the way they play DraftKings or FanDuel or spin a roulette wheel, I suspect it'll end in a big, bloody, bang for them ... as it probably would and serve them right, I guess.
You’ve identified the storyline here. What remains is how will the story end? With a bang or a whimper? And when? Those who’ve seen the last 15 minutes of this movie aren’t letting on - if they know. It’s tempting to forecast a 50% drubbing of the stock market in short order. The “smart money“ waiting in the wings awakens and moves into stocks at sharply lower prices. A happy ending for the forgotten few who resisted the temptation to own equities and held out long enough. Right out of Disney.
You’ve identified the storyline here. What remains is how will the story end? With a bang or a whimper? And when? Those who’ve seen the last 15 minutes of this movie aren’t letting on - if they know. It’s tempting to forecast a 50% drubbing of the stock market in short order. The “smart money“ waiting in the wings awakens and moves into stocks at sharply lower prices. A happy ending for the forgotten few who resisted the temptation to own equities and held out long enough. Right out of Disney.
I find myself agreeing with Jim Cramer here ... which happens, from time to time.
Remember the irrational exhuberance going into the Dot Com Crash (Pets.Com!), the Housing Bubble (5 houses on NINJA loans!), and now this.
Remember when you start seeing day-trading ads and services on TV and people start buying into the mania thinking they can't ever lose and that markets only go in one direction (up) that it's time to start inching closer toward the fire exit. As Jeremy Irons' character from 'Margin Call' said, "it's not panic if you're the first one out the door."
What is particualrly disturbing is the 'gamification' of investing by platforms like Robinhood that conflate longterm "investing" for wealth-building and retirement planning with "trading".
My investment portfolio is downright boring compared to most people, and I'm fine with that. It's also why I don't believe in the indices or do index-based investing -- because they're so heavily influenced by a single-digit's worth of ultramegacorps and don't reflect broader equity sentiments.
That is for sure. i understand the fee to be on Fidelity NTF platform is no small feast. I am surprise Vanguard even want to sell their funds there. Nevertheless, Fidelity service via phone or eMessaging is excellent. Vanguard was my 401(k) administrator so they became one of the brokerage we use.Not all funds open for purchase at Fidelity are eligible for automatic investment. For any fund, this eligibility is subject to change, just as a fund being offered NTF is subject to change.
© 2015 Mutual Fund Observer. All rights reserved.
© 2015 Mutual Fund Observer. All rights reserved. Powered by Vanilla


