
It looks like you're new here. If you want to get involved, click one of these buttons!
I am aware of Schwab's Fundamental Index Funds. Do they have an equal weighted 500 Index mutual fund?Good thread @bee. The Sept 17 episode is quite thought provoking and actionable.

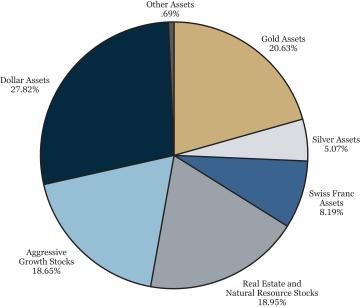
Good question, Without digging thru the latest report, I’m pretty confident the gold and silver reflected on the chart below are in bullion or certificates of ownership representing each. It’s possible they also hold a few mining stocks, but those would probably be reflected in the “stock“ holdings rather than being listed under gold.Is the gold position in PRPFX, gold metals, or miners, are good hedge against inflation?
Simplicity itself. Section 852(b)(6) gives RICs (including ETFs) special tax treatment. So striking this section takes away that special treatment. ETFs would no longer be able to divest themselves of gain without owing taxes on the gain.SEC. __17. RECOGNITION OF GAIN ON CERTAIN DISTRIBUTIONS BY REGULATED INVESTMENT COMPANIES.
(a) IN GENERAL.—Section 852(b) is amended by striking paragraph (6).
(b) EFFECTIVE DATE.—The amendments made by this section shall apply to taxable years beginning after December 31, 2022.
© 2015 Mutual Fund Observer. All rights reserved.
© 2015 Mutual Fund Observer. All rights reserved. Powered by Vanilla


