Bridgeway Small Cap Growth Fund reorganization https://www.sec.gov/Archives/edgar/data/916006/000119312521160629/d159594d497.htm497 1 d1
59
594d497.htm BRIDGEWAY FUNDS INC
BRIDGEWAY FUNDS, INC.
Small-Cap Growth Fund
Small-Cap Value Fund
Supplement dated May 13, 2021
to the Prospectus and Statement of Additional Information dated October 31, 2020
At a meeting of the Board of Directors (the “Board”) of Bridgeway Funds, Inc. (“Bridgeway Funds”) held on May 13, 2021 (the “Meeting”), the Board unanimously approved a Plan of Reorganization (the “Plan”), providing for: (i) the conversion of the shares of the Small-Cap Growth Fund (the “SCG Fund”) into shares of the Small-Cap Value Fund (the “SCV Fund”) and (ii) the resulting transfer to the SCV Fund of all of the property, assets and goodwill of the SCG Fund (when completed, the “Conversion”). The Board determined that the Plan and Conversion would be in the best interests of the SCG Fund, the SCV Fund, and their respective shareholders. The effect of the Plan and Conversion will be that the SCG Fund shareholders would become shareholders of the SCV Fund.
The Plan will require the approval of the shareholders of the SCG Fund. A special meeting of the shareholders of the SCG Fund is being called for that purpose. Shareholders of the SCG Fund will receive proxy solicitation materials providing them with information about the SCV Fund and Plan. If approved by shareholders of the SCG Fund, the Conversion is expected to take effect on or around the end of the third quarter of 2021. Share purchases of the SCG Fund will no longer be permitted approximately one week prior to the Conversion. Investors should check the Bridgeway Funds’ website (bridgewayfunds.com) for further information.
PLEASE RETAIN THIS SUPPLEMENT FOR FUTURE REFERENCE
Th 13th May, '21 rally... BUT...
CTFAX - COLUMBIA THERMOSTAT FUND ALLOCATION UPDATE
What will you do if (when?)...."frothy" markets turn into a Scheisse Fest? RPIEX. Overall performance this year is good. But still, the dividends are paltry. 51% in "cash?" They can't mean actual "cash" or MM? Could they???
A Bitcoin / Cryptocurrency thread & Experiment
Several James Alpha Funds to change names
Buying this week's market dip? 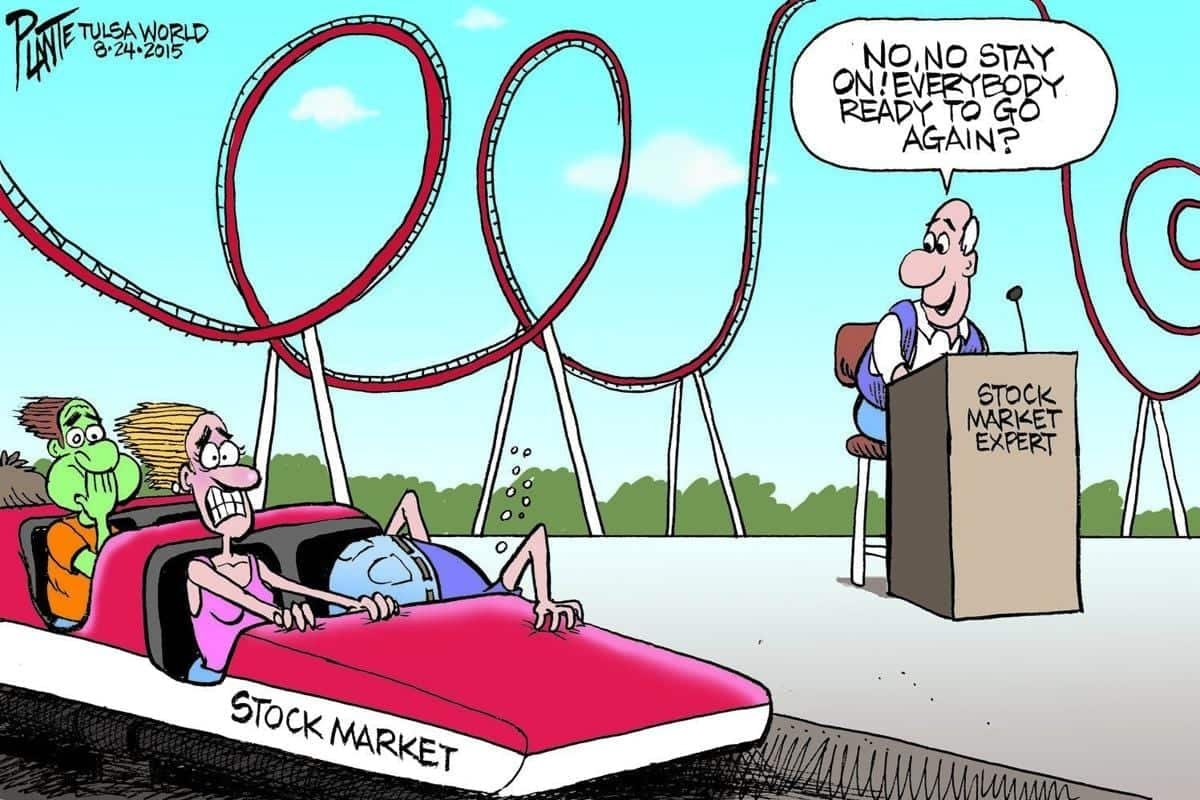
Buying this week's market dip? @Starchild, you must be refereing to the Kummelweck roll which has the kosher salt and caraway seeds...if in Buffalo you need to go to Charlie the Butcher's for one of these.
Come to think of it, I haven't been to Buffalo that often, last time was a couple years ago for work, but love the people, they are all so authentic, good decent folks, love the city, love the Beef on Weck's!
Baseball Fan
Yes! unfortunately, 3
50 miles is a treck for a sandwiche!
Is it time for a correction ? hank -was the junk bond fund, by chance, the infamous Oppenheimer Champion Income fund?
LOL - I don’t know. But I’m well aware of the former Oppenheimer
“Champion” high income fund and have referenced it a few times here. Best recollection is it lost about 7
5% over the ‘07-‘09 bear market. More grievous, perhaps, was Oppenheimer’s
“Core Bond” fund that had been marketed as low risk but ended up losing something like 40% during that time. Others may wish to check the numbers..
The friend I referenced is no longer among the living. But, it’s one thing to read some poster whom you’ve never met sharing their financial fortunes online. Quite a different matter to have somebody you’ve known personally most of your life (and like) open up like that and share their loss.
Any green in your portfolio today ? My only green today (5/12) is CLMAX + .28%.
TMSRX, HRSAX and some s/t bond funds are flat.
Chicken Shortage Sends Prices Soaring, and Restaurants Can’t Keep Up - WSJ
keep gambling ?!! Anyone buying dogecoin So the Schmeissing continues...
TTD whacked the other day...now today..Lemonade...LMND.
What could possible go wrong with co's of these ilk?...buying insurance on your phone via an app...with a company name that a child would come up with...are you sheeting me?
TTD takes a 25% hit and take a look at what the PE ratio still is...
This is beyond ridiculous. We need to clear the markets of this garbage similar to a morning constitiutional after eating a $2.00 burrito dinner special the night prior...
Baseball Fan
Is it time for a correction ? Remember these days?
Q: What was the interest rate on a savings account in 1980?
A: 19.5 percent
Since inflation was still high at more than 12 percent, the Federal Reserve hiked relentlessly between August and December of 1980, bringing the target fed funds rate back up to 19.5 percent.
Most investors today have no idea that interest rates can even go above 3%.
Is it time for a correction ? Not as bad as the afternoon in ‘87 when the Dow fell 27% during the short time I was driving home from work. Or as bad as the day in ‘08 when I happened upon an old HS buddy literally in tears because half his IRA had been wiped out in a few months by an investment in junk bonds he’d considered relatively safe.
Shucks, this kind of noise is normal and healthy for markets. Never invest $$ you will need anytime soon. Nobody’s to blame - unless you mean the
charlatans who promise quick gains and would have you believe getting rich investing is so easy “even a cave man could do it.”
If you’ve been around the past half century or more, when it comes to investing, you’ve seen a thing or two.

A Bitcoin / Cryptocurrency thread & Experiment Boy, that interview is not selling me on Bitcoin. First Saylor equates Bitcoin with the greatest technological innovations such as the automobile. The problem with that analysis is that the technology behind Bitcoin--blockchain--is not the same as Bitcoin itself just as the technology behind the automobile is not the same as the automobile manufacturing companies that produced automobiles. What he fails to recognize is that scores of auto manufacturers went out of business along the way in the development of the automobile--
https://stacker.com/stories/5360/50-car-companies-no-longer-exist The automobile as a technology triumphed, but many car companies producing automobiles did not. Blockchain as a technology is interesting and has many potential applications outside of libertarian energy wasting fictitious currency. There is no reason to assume that Bitcoin will be the best example of that technology. And the idea that Bitcoin "offers the hope of a decent life to 8 billion people" is absurd. This is a market that rich--and I should add Caucasian guys like Saylor and Asian guys in China--are cornering and controlling without any regulatory oversight. The idea that they will provide a better more energy efficient digital currency than ordinary digital currency to 8 billion people is nonsense. Also, the idea that BItcoin miners are only using clean energy is a lie:
https://smh.com.au/environment/climate-change/bitcoin-s-dirty-little-secret-it-s-not-easy-being-green-20210506-p57pki.html
Is it time for a correction ? So.... what happens if the market craters by 25-30-35-40-45%? Does that mean all the balance sheet expansion, Bailout, er handout for the rich last March as Lewis B would likely call it goes for naught?
So... is this the sheissefest referenced earlier or just a "healthy" pullback?
Just asking for a friend
Best,
Baseball fan
Buying this week's market dip? Yup, beef on Weck. I lived/worked for about 5 years in that ski resort town, about 90- minutes south of Buffalo. (Ellicottville.)
Any green in your portfolio today ? ZERO in the green today. Best were PTIAX and PRSNX, both down 2 cents/share.
Worst = PRIDX, down -1.21% on the day. Portfolio was down by -0.51%.
A Bitcoin / Cryptocurrency thread & Experiment Made my first forray into anything crypto-related, buying a bunch of BFARF at $5 at the opem before it closed up nicely. Just got approved to list on the NASDAQ the other day, so I expect it will pop given retail interest and make for some nice cap gains once the ticker changes. This is a total spec play on my part -- the company is a Canadian-based crypto miner that looks pretty decent vs its peers, so ... we'll see what happens.
I don't own any cryptocurrency and think the proliferation of 'exchanges' is too crowded a field to figure out who's got an edge. But this 'mining' company at least I understand a bit and feel it's useful on the 'back end' of the crypto mania -- eg, crypto infrastructure -- and seems one of the better ones at that.
Any green in your portfolio today ? RLSFX +.70%, HMEAX +.15%, CLMAX +.09%


