
It looks like you're new here. If you want to get involved, click one of these buttons!
1 ARKF 03/3/2021 Buy KSPILI 48581R205 KASPI.KZ JSC 2,651 0.0042
2 ARKG 03/3/2021 Buy VEEV 922475108 VEEVA SYSTEMS INC 75,900 0.2060
3 ARKG 03/3/2021 Buy TXG 88025U109 10X GENOMICS INC 49,218 0.0839
4 ARKG 03/3/2021 Buy SRPT 803607100 SAREPTA THERAPEUTICS INC 87,700 0.0762
5 ARKG 03/3/2021 Buy RPTX 760273102 REPARE THERAPEUTICS INC 16,969 0.0053
6 ARKG 03/3/2021 Buy ONEM 68269G107 1LIFE HEALTHCARE INC 169,564 0.0750
7 ARKG 03/3/2021 Buy MASS 65443P102 908 DEVICES INC 126,362 0.0635
8 ARKG 03/3/2021 Buy BFLY 124155102 BUTTERFLY NETWORK INC 390,584 0.0650
9 ARKG 03/3/2021 Buy CMLF 18978W109 CM LIFE SCIENCES INC 332,617 0.0604
10 ARKG 03/3/2021 Buy CDXS 192005106 CODEXIS INC 16,991 0.0035
11 ARKG 03/3/2021 Buy ACCD 00437E102 ACCOLADE INC 93,700 0.0411
12 ARKG 03/3/2021 Buy ADPT 00650F109 ADAPTIVE BIOTECHNOLOGIES CORP 244,014 0.1219
13 ARKG 03/3/2021 Sell GOOGL 02079K305 ALPHABET INC 10,400 0.2056
14 ARKG 03/3/2021 Sell BMY 110122108 BRISTOL-MYERS SQUIBB CO 198,865 0.1171
15 ARKG 03/3/2021 Sell RHHBY 771195104 ROCHE HOLDING AG 515,538 0.2047
16 ARKG 03/3/2021 Sell PSTI 72940R300 PLURISTEM THERAPEUTICS INC 120 0.0000
17 ARKK 03/3/2021 Buy TDOC 87918A105 TELADOC HEALTH INC 226,209 0.2047
18 ARKK 03/3/2021 Buy FATE 31189P102 FATE THERAPEUTICS INC 148,508 0.0577
19 ARKK 03/3/2021 Buy EXAS 30063P105 EXACT SCIENCES CORP 62,847 0.0362
20 ARKK 03/3/2021 Buy BLI 084310101 BERKELEY LIGHTS INC 305,000 0.0795
21 ARKK 03/3/2021 Buy U 91332U101 UNITY SOFTWARE INC 142,314 0.0627
22 ARKK 03/3/2021 Buy ZM 98980L101 ZOOM VIDEO COMMUNICATIONS INC 134,399 0.2091
23 ARKK 03/3/2021 Buy BEAM 07373V105 BEAM THERAPEUTICS INC 327,030 0.1233
24 ARKK 03/3/2021 Buy PLTR 69608A108 PALANTIR TECHNOLOGIES INC 1,988,500 0.2099
25 ARKK 03/3/2021 Sell TSM 874039100 TAIWAN SEMICONDUCTOR MANUFACTURING CO LTD 532,806 0.2872
26 ARKK 03/3/2021 Sell TCEHY 88032Q109 TENCENT HOLDINGS LTD 273,293 0.1073
27 ARKK 03/3/2021 Sell NTDOY 654445303 NINTENDO CO LTD 59,162 0.0188
28 ARKK 03/3/2021 Sell ICE 45866F104 INTERCONTINENTAL EXCHANGE INC 97,749 0.0477
29 ARKK 03/3/2021 Sell BIDU 056752108 BAIDU INC 267,378 0.3393
30 ARKK 03/3/2021 Sell BEKE 482497104 KE HOLDINGS INC 8,847 0.0024
31 ARKQ 03/3/2021 Buy U 91332U101 UNITY SOFTWARE INC 173,600 0.5114
32 ARKQ 03/3/2021 Buy EXPC 30217C109 EXPERIENCE INVESTMENT CORP 84,800 0.0339
33 ARKQ 03/3/2021 Buy ESLT M3760D101 ELBIT SYSTEMS LTD 2,740 0.0103
34 ARKQ 03/3/2021 Buy AONE G7000X105 ONE 554,800 0.1957
35 ARKQ 03/3/2021 Sell DE 244199105 DEERE & CO 31,474 0.3083
36 ARKQ 03/3/2021 Sell FLIR 302445101 FLIR SYSTEMS INC 160,593 0.2446
37 ARKW 03/3/2021 Buy U 91332U101 UNITY SOFTWARE INC 189,900 0.2534
38 ARKW 03/3/2021 Buy TSLA 88160R101 TESLA INC 23,320 0.1986
39 ARKW 03/3/2021 Buy TDOC 87918A105 TELADOC HEALTH INC 78,940 0.2095
40 ARKW 03/3/2021 Buy PLTR 69608A108 PALANTIR TECHNOLOGIES INC 670,300 0.2079
41 ARKW 03/3/2021 Buy ZM 98980L101 ZOOM VIDEO COMMUNICATIONS INC 89,672 0.4010
42 ARKW 03/3/2021 Sell NVDA 67066G104 NVIDIA CORP 85,856 0.5689
43 ARKW 03/3/2021 Sell TSM 874039100 TAIWAN SEMICONDUCTOR MANUFACTURING CO LTD 316,428 0.5008
44 ARKW 03/3/2021 Sell API 00851L103 AGORA INC 113,066 0.0900
Thanks Catch22...neat tool! Much appreciated...@KHaw24
The below chart is for the 4 funds you noted. The backwards view only goes to May, 2015; which indicates one of the funds had it's inception date in May, 2015. These returns are for total return, which includes all distributions. You will note the short period around March of 2020 when the credit markets became locked up, until central bank intervention.
Just below the graph you will see a bar indicating 1,462 days for this chart. You may right click this bar to obtain a default list of other time frames. Example: 1 year. If set at 1 year, you may drag this time frame backwards (left), too. This will let you see a view of these funds performance comparison as you travel backwards.
ALSO, this is an active graph for your own use. You may place and/or replace any of the ticker symbols at the top entry line and then click "go" to built your own chart, which will default to a 200 day view.
You may also toggle between line graph and bar graph for returns when clicking the "red and green" icon at the far left bottom of the time period bar.
CHART
Enjoy,
Catch
a-bleak-future-for-long-term-government-bondsCan you believe that the income recently available from a 10-year U.S. Treasury bond – the yield was 0.93% at yearend – had fallen 94% from the 15.8% yield available in September 1981? In certain large and important countries, such as Germany and Japan, investors earn a negative return on trillions of dollars of sovereign debt. Fixed-income investors worldwide – whether pension funds, insurance companies or retirees – face a bleak future.
Buffett doesn’t really offer any alternatives, except to warn:
Some insurers, as well as other bond investors, may try to juice the pathetic returns now available by shifting their purchases to obligations backed by shaky borrowers. Risky loans, however, are not the answer to inadequate interest rates. Three decades ago, the once-mighty savings and loan industry destroyed itself, partly by ignoring that maxim.
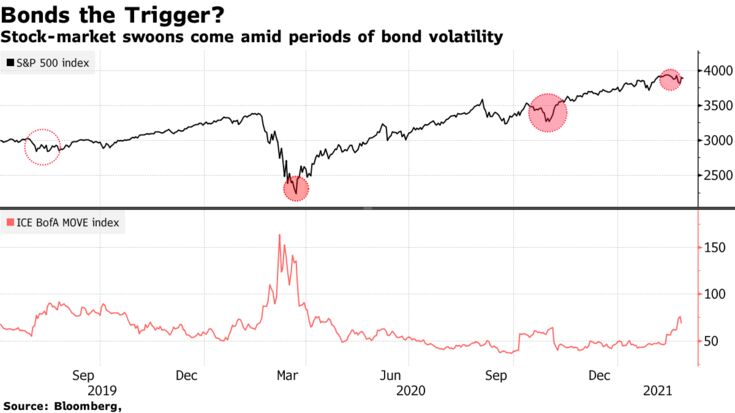
https://raymondjames.com/davidolnick/david-chart-of-the-week/2016/11/18/the-move-indexMany of us are familiar with the VIX Index, commonly referred to as the “Fear Index”. The VIX Index is a measure of “fear” as that relates to equity markets and typically rises during periods of falling prices, sometimes sharply during more precipitous declines.
Did you know that there is a similar index that measures fear within the bond market? That index was developed by Merrill Lynch and is referred to as the “MOVE” Index. The index rises as concerns grow that interest rates are on the march higher. The index will rise more sharply when there are fears in the market that rates may be headed significantly higher as was the case during the 2013 Taper Tantrum.
Bloomberg Opinion Piece:
At a time when most major companies are working on plans to cut their carbon emissions, one of the darlings of green investing is working to increase its emissions footprint.
You read that right. Thanks to its explosive expansion in China and a planned car plant in India, Tesla Inc. is in the process of not just increasing the total sum of its emissions—a pretty inevitable consequence of growth in our current carbonized world—but increasing the amount of pollution each of its vehicles generates, too.
I'll play "chart it". Give me 5 bond fund tickers that you're not happy about over the past 10 years. They don't have to be anything you hold or have held. What would you prefer to be charted as a baseline, the comparative? A balanced fund, a blended equity fund?
but for the last 10 + years it was a bad mistake
Existing nuclear plants have relatively low operation, maintenance, and fuel costs compared to many fossil fuel plants; however these routine costs still make nuclear power economically uncompetitive in comparison with natural gas, wind, and solar.
New nuclear plants are another matter altogether; their continuing high construction costs make them uneconomical. Between 2002 and 2008, cost estimates for new nuclear plant construction rose from between $2 billion and $4 billion per unit to $9 billion per unit, according to a 2009 report by the Union of Concerned Scientists. In reality, even those astronomical projections have been surpassed. The two new units at the Vogtle Plant in Georgia, the only new nuclear construction in the United States, are now years behind schedule and projected to cost more than twice their original budget of $14 billion. Similarly, it was estimated that Duke Energy’s proposed Levy County Nuclear Power Plant in Florida would cost $5 billion, but projections ballooned to $22 billion. The project was canceled in 2017, and Duke Energy decided to focus on solar energy expansion instead.
Reactors also typically require a long period of planning, licensing, and building. The 2019 World Nuclear Industry Status Report (WNISR) estimates that since 2009 the average construction time for nuclear reactors worldwide was just under 10 years.
The WSINR report also estimates that the cost of generating nuclear energy ranges between $112 and $189 per megawatt-hour (MWh), while solar power costs between $36 and $44 and onshore wind power comes in at $29 to $56.
© 2015 Mutual Fund Observer. All rights reserved.
© 2015 Mutual Fund Observer. All rights reserved. Powered by Vanilla


