
It looks like you're new here. If you want to get involved, click one of these buttons!
Wise advice by MJG in the recent post Will you revise your fund holdings going into 2013, regardless of "fiscal cliff", etc.? got me thinking...
He said, "The accumulated data finds that only a small percentage of wizards beat their proper benchmarks annually, and that percentage drops precipitously as the time horizon is expanded. Superior performance persistence is almost nonexistent."
So I dug into it a bit.
The table below summarizes how many funds have beaten the market since their inception (or since Jan 1962, as far back as my Steele Mutual Fund Expert database goes). I used only whole months in the calculations so that I could be consistent with two market benchmarks, the SP500 total return (since 1970, price only before) and the 30-day Treasury Bill.

Nearly 9000 mutual funds and ETFs were evaluated. I used load adjusted returns and only the oldest share class. I apologize to the bench mark police for using only SP500 and T-Bill. Nonetheless, I find the results interesting.
First, MJG is right. Less than half of all equity funds have beaten the SP500 over their life times; in fact, one in four have not even beaten the T-Bill, which means their Sharpe Ratios are less than zero!
Second, nearly all fixed income funds have beaten T-Bill performance, which is re-assuring, but fuels the perception that you can't lose money with bonds. The money market comparison is a bit skewed, because many of these funds are tax exempt. Still, expense ratios must be having their negative effect as only one in five such funds beat the T-Bill.
Digging a bit further, I looked at how the funds did by inception date. Here is a result I can't yet explain and would ask for the good help on MFO to better understand. It seems like the period from 1998 to 2002, which book-end the tech bubble, is a golden age, if you will, for funds, as more than 60% of the funds initiated during this period have beaten the SP500 over their life times. That's extraordinary, no? I thought maybe that it was because they were heavily international, small cap, or other, but I have not yet found the common thread for the superior performance.

On the other hand, the period from 1973 to 1982 was abysmal for funds, since only one in ten equity funds created during these years have beaten the SP500 over their life times. And it is not much better between 1983 and 1992.
I next broke-out this same performance by type: equity, asset allocation, fixed income, and money market:


Note that fixed income funds helped contribute to the "golden period" as more than a quarter of those incepted between 1998 and 2000 beat the SP500.
Some other interesting points:
Relatively few money market funds have been created since the cash bull run of the '80s.
But otherwise, fund creation is alive and well, with nearly 2000 funds established in the past three years, which accounts for one fifth of all funds in existence.
Fixed income fund performance has dropped a bit this year with 15 out of 100 losing money.
Here are links to remaining parts of this assessment: Part 2 (Equity), Part 3 (Asset Allocation), Part 4 (Fixed Income), and Part 5 (Money Market).
© 2015 Mutual Fund Observer. All rights reserved.
© 2015 Mutual Fund Observer. All rights reserved. Powered by Vanilla
Comments
Wow!! I’m overwhelmed with the body of work completed in support of your impressive posting. It is at a level of detail and magnitude to rival academic and industry research. Congratulations for a fine effort.
I no longer have the patience or work ethic to complete such an arduous and time consuming project. I doubly applaud your follow-up interpretative questioning to further exploit your findings. Good for you; better for MFO participants.
Since I am a charter member of the benchmark police, I appreciate your recognition of the limitations of using only two test benchmarks. I recognize your need to do so. I’m sure you appreciate that using the S&P 500 to assess the merits of mutual funds that specialize in other categories like small capitalization firms or the international marketplace is not an accurate test measurement. I certainly acknowledge that a researcher does what is needed to complete his analysis. No study or model is perfect.
To better understand the study results, I suspect that survivorship bias might be a significant factor. Each year, a double digit percentage of funds close their doors. Integrated over time that is a noteworthy data correction that builds over the study timeframe. Overall, the survivorship adjustment would suggest that the percentage of actively managed funds that outperform their indices is even poorer than the present results imply.
Survivorship bias is also a likely candidate factor that produces the unexpectedly successful active management performance rating during the 2000-2003 market meltdown. Note that the number of funds reporting results for that period is sharply reduced, like by a factor of two. The poorly performing active funds during that period simply ceased to exist, and were consequently not scored in the tabulations. The weak sisters disappeared from the scene. At this juncture, that’s my guess for the anomalous outcomes during that challenging period.
I hope these quick conjectures help in the data interpretations.
Charles, thank you for this outstanding and excellent effort. It is exhaustive.
Best Wishes.
In any period, it is easy to identify winners retrospectively. It is much harder to identify those that will have their performance persist or will again start to overperform again after a period of underperformance.
That's good. I think you are both suggesting that the surviving funds from this apparent "golden period" may skew the result, since by definition they had to be strong enough to weather the tech bubble.

Just to be clear, all funds in this evaluation still exist today. So, there remain about 1300 funds that launched between 1998 and 2002. From that time, through the 2007 financial bubble and up until today, more than 2/3rds of them have a better life time APR than the SP500 over the same period.
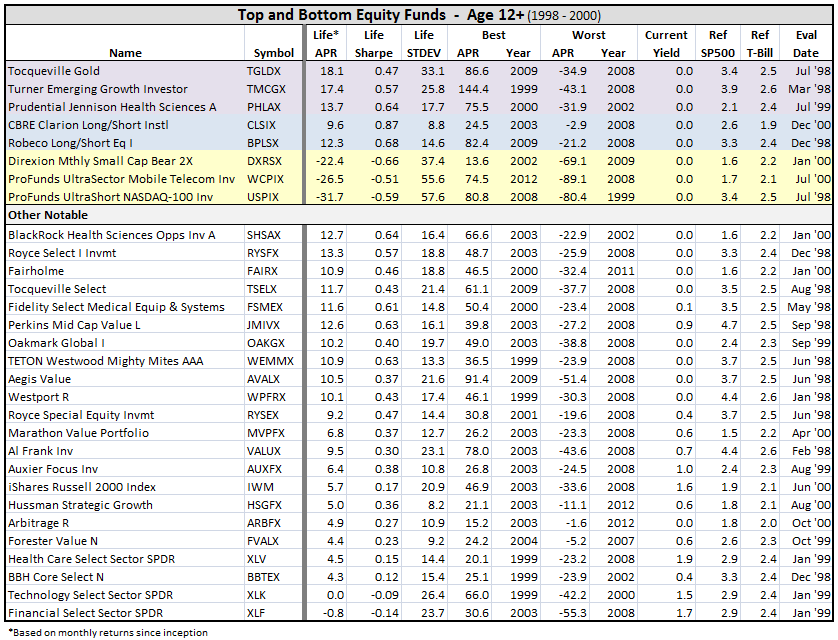
Looking at some of the names from Mutual Funds That Beat The Market - Part 2, there are indeed some pretty impressive equity funds:
Here's a 2001 Money article by Jason Zweig describing just how pronounced this effect was.
http://www.jasonzweig.com/uploads/7.01S&P500.1.pdf (pp. 84-86)
http://www.jasonzweig.com/uploads/7.01S&P500.2.pdf (pp. 88-89)
While it is difficult to identify winners prospectively, it is not as hard to identify losers prospectively (though there is little persistence of good performance, there is more persistence of bad performance). If 26% of funds underperform cash (T- bills), then one could improve one's odds substantially by simply avoiding those funds. The other 74% would certainly include clunkers, but at a much reduced density (vs. the fund universe as a whole).
Finally, let me echo others in my praise of the data and analysis that Charles did.