Morningstar's Portfolio Manager Price Updating Concern ... ---- 312 posts on the MORNINGSTAR CONVERSATION FORUM --- 312 !!!!!!!
INCLUDING 44 IN AN " OPEN LETTER TO M* CIO AND CEO " as follows =
As discussed HERE, HERE, HERE and HERE, the recent crash of the Portfolio Manager is just another example of extremely poor System Testing and User-Acceptance Testing prior to deployment. M* does a lot of things right, but one thing they do VERY POORLY is follow a traditional structured IT lifecycle development and deployment process which would catch 95% of these issues before they affect their customers.
I honestly have never seen another company push out such "buggy" or error-prone code into a live customer-facing environment, and I have worked with dozens of organizations both large and small throughout my consulting career. This has been at least a quarterly, if not monthly occurence for YEARS and shows no sign of changing.
This is a leadership issue, not a technical issue, and has crossed from "mistake" to "problem."
If your IT folks have the authority to make changes to the live production environment without a sign-off first from some sort of business or marketing person, that's a problem.
A complete re-vamp of the pre-deployment QA / Testing process up to normal customer-facing marketplace standards should be underway, as measured by a sharp reduction in customer-impacting outages and post-deployment bug reports.
Ultimately, you're going to lose this Premium customer along with many others if this continues without any hope of systemic changes at the IT leadership level.
Please advise.
Gundlach 2015 Market Outlook Webcast Just so everyone knows. His very popular chart about never 7 years of positive returns is not correct.
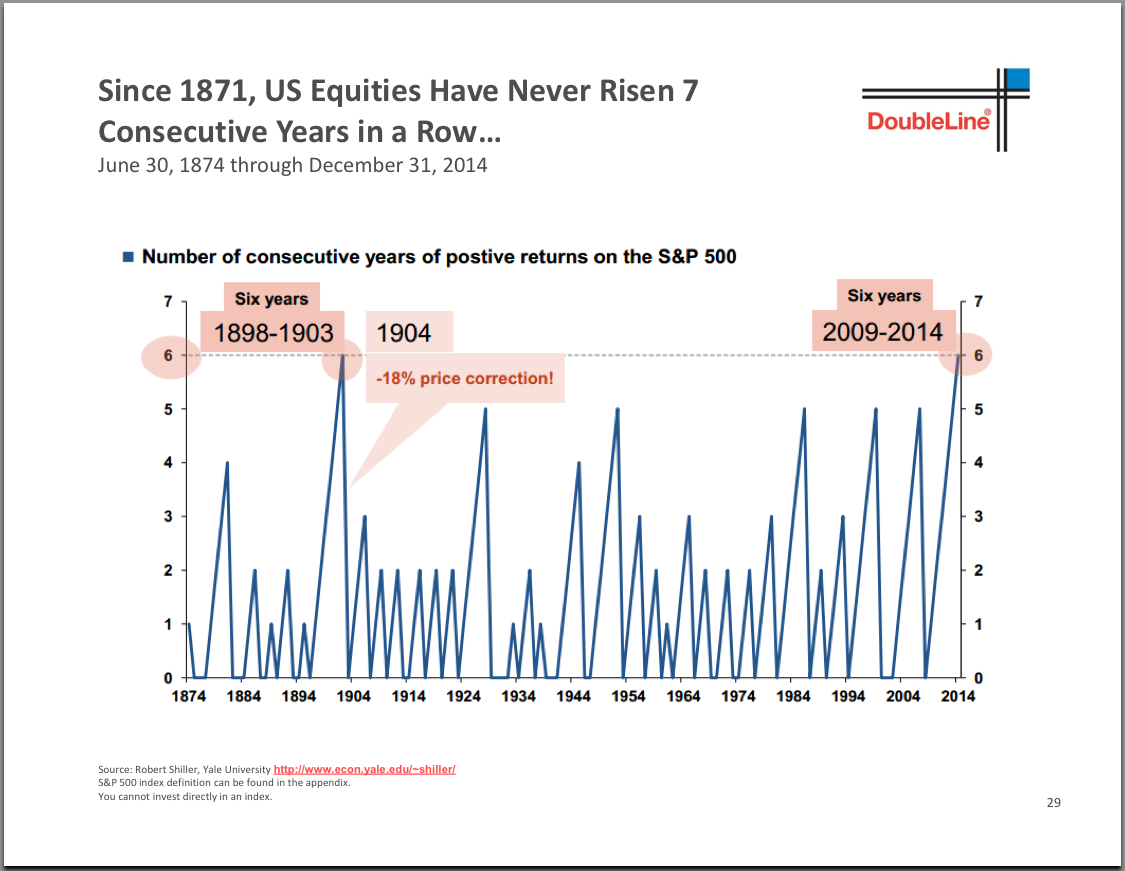
8 years 1982-1989 and 9 years 1991-1999.
Just trying to kill the myth .
The Closing Bell: U.S. Stocks Rise As Energy Rally Offsets Swiss Fallout
Junkster give my $500 to charity
Morningstar Premium Subscription Pros & Cons ducrow, I find their premium membership of value, especially (for me) the premium search tool. BUT, I do not pay for the premium membership. I get it for free thru TROWE PRICE who will pay the fee for you IF you have $100,00 invested with them. I do via two 529 college savings plans.
Just another thought.
Matt
Was just about to add this. You also get M* research and tools at TDAmeritrade, and Schwab just started giving access to M* analyst reports for stocks.
I might pay for the something like what Josh Peters provides. Not so much the rest since you can get it elsewhere.
Morningstar Premium Subscription Pros & Cons ducrow, I find their premium membership of value, especially (for me) the premium search tool. BUT, I do not pay for the premium membership. I get it for free thru TROWE PRICE who will pay the fee for you IF you have $100,00 invested with them. I do via two 529 college savings plans.
Just another thought.
Matt
Morningstar Premium Subscription Pros & Cons The premium content on the Portfolio pages and the one-stop etf/cef data is what's kept me on their subscriber list.
It's usually easy to tell on the P-pages where the mistakes and stale content are. That stuff at M* is mostly a convenience, not a necessity (the fund sites report essentially all of it), but the convenience to moi is still worth it.
Note on negotiating the price: they used to be pretty accommodating if asked for a price reduction, but the last time I re-upped, the CSR got really surly about it, and would only drop the price $50 when I just said straight-out that I was done with Premium if she wasn't able to reduce the price.
John Bogle: Vanguard Should Say More On How it Influences Companies In the case of the Vanguard 500 Index Fund, if Vanguard were to sell shares of companies they felt did not abide by their standards, then it would not be an index fund any longer.
John Bogle: Vanguard Should Say More On How it Influences Companies @Lewis: Your beating a dead horse !!!!

John Bogle: Vanguard Should Say More On How it Influences Companies While I applaud this step in the right direction by Vanguard, it is not enough in my view. As usual, I am in agreement with Bogle. If you own shares of a Vanguard 500 Index fund, you are also owners of its underlying stocks--Apple, Exxon, Walmart. Why shouldn't you be able to know what Vanguard is doing with your money when it negotiates with these companies regarding crucial issues of corporate governance--issues such as executive compensation and board structure that a large body of research show have a significant impact on shareholder returns?
The idea that private, i.e., secret negotiations are more effective at eliciting change in companies as opposed to open public pressure seems a little ridiculous to me. Also, I disagree with this notion that "Vanguard lacks leverage because its index funds cannot pressure executives by threatening to sell shares." If Vanguard as the largest shareholder of many companies started voting against certain directors it disapproved of and executive compensation packages that are excessive and instead started voting for shareholder proposals to positively change companies, it would have a huge impact. The problem is the idea that a private negotiation without any real public, legally binding action in the proxy votes seems toothless.
Heads Up ! David Snowball Will Be On Chuck's Jaffe Money Life Show 1/20/15
MFO, Per Dee Lee, lets one know, "when to sell those funds" Morning Coffee,
Per Ms. Dee Lee, from the article related to MFO: "Also utilize the Mutual Fund Observer newsletter for research on funds.
They don’t tell you when to buy mutual funds but when to sell a mutual fund.If only it was this simple, eh? Buy whatever one wants and wait for MFO to indicate a sell signal.
Me thinks she does not grasp the intention(s) of the MFO site.
The full article containing other comments related to investing, is just below
.
WBZ, Dee Lee articleTake care,
Catch
How Vanguard Reduces Currency Risk: Video Presentation
John Bogle: Vanguard Should Say More On How it Influences Companies FYI: Vanguard Group's decision to publish details about how it uses its huge shareholder clout to influence corporate governance issues is a step in the right direction, but does not go far enough, according to the founder of the mutual fund company.
"We still have a long way to go," said Jack Bogle, who now runs a market research group funded by Vanguard, but no longer has an executive role at the company he founded in 197
5.
Regards,
Ted
http://wealthmanagement.com/print/industry/vanguard-should-say-more-how-it-influences-companies-founder
PQTDX remains impressive;YIKES update, POP and down -3.1% .....currencies, I will guess. YTD gone. Regarding the cash component of this fund, M* shows this statistic. The first number is net percentage, second is percentage short, and third is percentage long.
Cash -106.15 237.97 131.83
MFO Ratings Through 4th Quarter How many of the 30 are one manager over the 20y? I wager none. Can you parse similarly for 10 and 15y? Can you parse for one manager? Forgive me if I have missed these capabilities.
Morningstar Premium Subscription Pros & Cons Overpriced? compared to what?..., Tell me where you can get the same amount of information for 50 cents a day (peanuts for my investing success)....Necessary evil for decision making, I'm in Morningstar.... till I find a better source..... just don't go too much higher......WSJ much higher for what?
Morningstar Premium Subscription Pros & Cons --- NO !!!!!!!!!!!!!!!!!!
BEEN THERE -- DONE THAT -- and CANCELLED PREMIUM MBSHP. --- Years ago-
AND ITS GOTTEN WORSE = SEE MORNINGSTAR CONV. BOARD =
"HOW TIRESOME --PORTFOLIO AGAIN NOT UPDATED AGAIN" = OVER 250 REPLYS
from Morningstar members. !!!!!!!!!
Ralph
Eaton Vance Snares First Partner On ETMFs: American Beacon
Junkster give my $500 to charity Dex, mailed my $250 my check to heezsafe the other day. If I have to pay you off will send it to you and you can do whatever with it. But we have a ways to go there. I'm 100% in junk munis too now and will try and stay with the trend and have some sort of exit strategy in place. Markets tend to surprise. If we have some sort of dramatic economic slowdown that could impact the lower rated munis and the place to be would be investment grade. I am licking my chops hoping hi yield corporates fall out of bed as they will be the next great thing somewhere down the road like they were in December 2008.


