Howdy, Stranger!

It looks like you're new here. If you want to get involved, click one of these buttons!
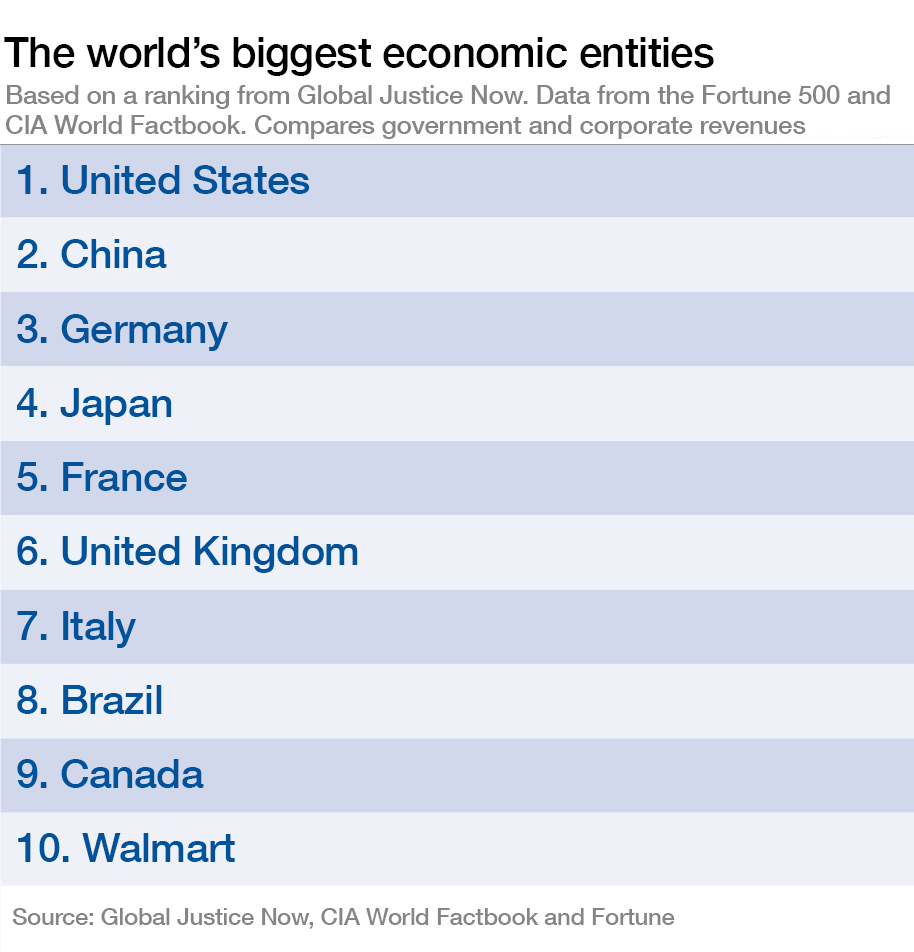
Here's a statement of the obvious: The opinions expressed here are those of the participants, not those of the Mutual Fund Observer. We cannot vouch for the accuracy or appropriateness of any of it, though we do encourage civility and good humor.
  • 31 Years of Stock Market Returns
    You guys are pouring on the pessimism a little thick here, don't you think? Like Emily (below) I'm planning for a future that's a little brighter.
  • BONDS The week that was.... December 31, 2024..... Bond NAV's...Most positive. FINAL REPORT 2024
    Thanks for the explanation. My biggest bond fund holding is FADMX, followed by FTBFX, FCNVX, PTIAX and FAGIX. I’ve stuck mostly to Fidelity funds for simplicity and ease in rebalancing. I also have a considerable number of CDs and Treasuries in ladders extending out 5 years. Now that interest rates are dropping, I’m reinvesting maturing issues into bond funds.
  • 31 Years of Stock Market Returns
    except when you’re over 75 the number of years you have to fund left are less than 20 and very possibly less than 10
  • Fidelity Automatic Account Builder changes
    This is a nice feature I learned from @msf years ago. In the long run, it help to build sizable positions in institutional shares of OEFs. The $5 spend pays itself many times over from having lower expense ratio.
    Does Schwab offers similar fearure ?
  • Fidelity Automatic Account Builder changes
    The changes to Fidelity automatic investment features have been implemented many months ago, may be even in 2023. That feature is not as good as it used to be, say in 2022. That feature used to be very flexible and you used to be able to use it for a next day trade.
    Fidelity wants maximum number of $49-50 commissions not $5 commissions.
  • 31 Years of Stock Market Returns
    +1 Anna & Catch.
    Rarely do we share our age or what our investments are intended for. If you are 25 - close your eyes. All will be well. If you are 50, maybe squint a little. But if you are over 75 and counting on those investments to sustain you and yours thru your lifetime, tread very cautiously.
  • About the 4% rule
    Not surprising that the 4% Rule fails globally
    Wade Pfau has a long 1+ hour podcast (8/1/24), and an early segment within is for testing the 4% Rule globally. It failed for most countries. It almost worked for Australia but it was a 3% Rule instead. So, the 4% Rule is something unique to the US and possibly Canada.
    Edit - As the YouTube link opened as an embedded link, note the the relevant segments starts around 7:40.

    Link to related 2010 paper, https://tinyurl.com/3299f69j
  • 31 Years of Stock Market Returns
    NASDAQ - 55.63%
    S&P 500 - 56.78%
    DOW - 53.78%
    ###
    Only paper losses unless you lock them in.
  • BONDS The week that was.... December 31, 2024..... Bond NAV's...Most positive. FINAL REPORT 2024
    Hi@Tarwheel
    A good and fair question.
    The inclination to use the etf's, in the list, for bond fund performance, is the sector types represented, as well as their duration.
    Surely not a 'perfect' list, but allows for those viewing to perhaps have some ideas about bond(s) performance in the sectors relative to one another. Several of the listings are from requests. BUT, I have to keep the list to a manageable size.
    Even the NAV aspect is flawed when considering 'monthly distributions' and the affect upon a NAV price towards a 'month ending' number.
    And the fact that some of of etf's are active managed and/or have some 'special sauce' within the management style.
    I obtain and input all of the data manually, so my time allotment every week is limited, too.
    From a personal note, our portfolio is currently 60% income/cash. BAGIX is 33% of this, with the remainder being MMKT's. And though BAGIX is an intermediate duration fund, I can't really compare this to the etf, IEF; which is 7-10 year duration, but is a Treasury fund. BAGIX has only 27% in UST's.
    However, I try to have a view and perhaps find a 'trend' over a time period and a 'why?'.
    The inputs that affect the pricing comes from so many directions: flight to safety, a change in yields (for whatever reason), sovereign wealth funds and hedge funds using etf's. There are a lot of moving parts, eh?
    NOTE: We do not chase funds for high yields (2008 exception); but do watch for opportunity in a falling yields environment to obtain the gains from pricing.
    I made a one year chart (below). Not much value for the most part, as the two funds are bond indexes and one ETF all to the 'long duration' aspect.
    You mentioned your having bond funds vs etf's. I'll be glad to build a chart, as I'm curious as to outcomes for active managed bond funds vs a similar category etf; although sometimes a difficult match. You're welcome to provide some tickers.
    Well, I've not likely really answered your question; and in the end; I'm just a curious person about 'stuff'.
    NOW, I must travel outside and alter the height of the grass in the lawn.
    CHART 1 year FNBGX vs VBLAX vs EDV
  • 31 Years of Stock Market Returns
    Here’s the total wreckage over 17 consecutive months (‘07-‘09). The ‘07-‘09 bear market was one of the shortest in history.
    Wikipedia ‘07-‘09 Total Bear Market Losses
    NASDAQ - 55.63%
    S&P 500 - 56.78%
    DOW - 53.78%
    image
    The chart above shows how digging out of a hole is more difficult than falling into one.
    Yep - watching more than half of your investment money disappear over 17 months represents just a little “blip” in the longer term picture. (I’ll drink to that.)
    Plus - The Fed “put” (known at the time as ”quantitative easing”) will be there next time around to arrest the decline and will be able to break the fall after it exceeds 50%.
    To the Fed: “How do I love thee? Let me count the ways ….
  • Fidelity Automatic Account Builder changes
    @Sven is asking what price is received when a purchase is made automatically, as opposed to being entered by the investor. It's a good question.
    Most automatic investments are via DRIP plans. "True" DRIPs are set up with the companies themselves. In these plans, investors often receive shares from a company based on its closing price on the day of reinvestment, frequently at a discount. For example:
    common stockholders may now receive a number of shares based on 95% of the market price per share of common stock at the close of regular trading on The Nasdaq Capital Market on the valuation date fixed by the Board for such distribution
    https://ir.ofscreditcompany.com/shareholder-services/dividend-reinvestment-plan
    However, for "synthetic" DRIPs, where the brokerage is reinvesting the divs, it's not clear what price the investor is paying for the additional shares. Likewise, when the brokerage is automatically purchasing shares (with investor cash, not divs) on scheduled dates, what price is paid for those shares?
    What Fidelity does when reinvesting divs (I don't know about scheduled investments):
    Note ... that the stock price at which your reinvestment occurs is not necessarily the same as the price that is in effect on the dividend payable date. This is because we generally buy the shares of domestic companies two business days before the dividend payable date [likely now one day before with T+1], at the market price(s) in effect at the time, in order to help ensure that we have shares on hand to place in your account on the dividend payable date.
    https://www.fidelity.com/bin-public/060_www_fidelity_com/documents/customer-service/brokerage-retirement-cust-agree-and-commission-sched.pdf
    Related: what price does M* use for purchases in calculating total return including reinvested dividends?
    Reinvestments are made using the actual reinvestment price,
    https://admainnew.morningstar.com/directhelp/Glossary/Performance/Total_Return.htm
  • 31 Years of Stock Market Returns
    I’m in rare agreement with @Baseball_Fan on this one.
    Yes, over the long haul markets go up. Equities beat cash and bonds over very long periods. It’s been demonstrated that dead investors outperform living ones. But there are always lurking the unknown / unexpected downdrafts. When these ”ripples in space time” do occur investors often react irrationally. Dump and run is pretty common unless maybe you’re a ”steely-nerve” manager at a big investment house, hedge fund, pension fund or endowment with a sizable amount of your AUM locked-up for years.
    Most of us mere mortals invest in the real perceived everyday world. Setting a 25-30 year time horizon and then shutting your eyes is harder than it might sound. The fact that we are visiting this site is proof we haven’t shut our eyes to our investments. When a ‘29 or 2,000 or ‘08 comes along, it feels like the morning after drinking a bad bottle of booze. Lying flat on the floor, common sense and rationality often fly out the door.
  • DJT in your portfolio - the first two funds reporting (edited)
    A slightly different view, FWIW. The first number data after the 'name' is the percentage of, within the total holdings. I.E. .43% for the first Vanguard listing. Page data from M* for the top twenty.
    NT Ext Eq Mkt Indx Fd DC Lending Tier 5	Not Rated	—	0.02	
    Unlock
    1,649,659,963
    1,649,659,963
    ––
    Jun 30, 2024
    Vanguard Total Stock Mkt Idx Inv 0.43 0.00
    Unlock
    868,400
    0
    0.00% Jul 31, 2024
    Vanguard Institutional Extnd Mkt Idx Tr 0.38 0.02
    Unlock
    756,598
    4,126
    0.55% Jul 31, 2024
    Vanguard Small Cap Index Not Rated 0.34 0.01
    Unlock
    687,760
    1,863
    0.27% Jul 31, 2024
    Fidelity Extended Market Index 0.14 0.02
    Unlock
    281,449
    281,449
    ––
    Jun 30, 2024
    Vanguard Small Cap Value Index Inv 0.12 0.01
    Unlock
    231,593
    1,049
    0.46% Jul 31, 2024
    Vanguard Small Cap Growth Index Inv 0.10 0.02
    Unlock
    192,865
    -735
    0.38% Jul 31, 2024
    iShares Russell Mid-Cap Growth ETF 0.10 0.03
    Unlock
    192,396
    152
    0.08% Aug 28, 2024
    iShares Russell Mid-Cap ETF 0.09 0.01
    Unlock
    181,128
    132
    0.07% Aug 28, 2024
    Russell 1000 Index Fund Not Rated 0.09 0.00
    Unlock
    174,341
    0
    0.00% Jul 31, 2024
    Blackrock Russ 1000 Eq Idx Composite Not Rated 0.09 0.00
    Unlock
    174,341
    174,341
    ––
    Jun 30, 2024
    State St Russell Sm/Mid Cp® Indx NL Cl C 0.08 0.01
    Unlock
    161,788
    116,888
    260.33% Jul 31, 2024
    Schwab US Mid-Cap ETF™ 0.07 0.02
    Unlock
    131,950
    0
    0.00% Aug 30, 2024
    iShares Russell 1000 Growth ETF 0.06 0.00
    Unlock
    128,597
    48
    0.04% Aug 28, 2024
    Fidelity Nasdaq Composite Index 0.05 0.03
    Unlock
    105,223
    30,800
    41.39% May 31, 2024
    BlackRock Extended Equity Market K 0.05 0.02
    Unlock
    104,537
    104,537
    ––
    Jun 30, 2024
    iShares US Technology ETF 0.05 0.01
    Unlock
    99,370
    -39
    0.04% Aug 28, 2024
    BlackRock Russell 2500™ Index F 0.05 0.03
    Unlock
    93,367
    93,367
    ––
    Jun 30, 2024
    Fidelity Total Market Index 0.05 0.00
    Unlock
    90,922
    90,922
    ––
    Jun 30, 2024
    Fidelity Series Total Market Index 0.03 0.00
    Unlock
    68,109
    68,109
    ––
    Jun 30, 2024
    Total (for Top 20) 2.36 1,654,384,697
    1,650,626,972
  • BONDS The week that was.... December 31, 2024..... Bond NAV's...Most positive. FINAL REPORT 2024
    NOTE:
    My intention, at this time; is to present the data for the select bond sectors, as listed; through the end of the year (2024). This 'end date' will take us through the U.S. elections period, pending actions/legislation dependent upon the election results, pending Federal Reserve actions and market movers trying to 'guess' future directions of the U.S. economy. As important during this period, are any number of global circumstances that may take a path that is not expected; and/or 'new' circumstances. In the 'cooking pot' we currently have the big ingredients of the middle east and also, how much damage Ukraine may inflict upon Russia and the response.
    W/E August 30, 2024..... A week of price swings with few + NAV's
    Bond NAV's had many price swings through the week, with only a few on the list having a positive pricing week. *** I'm going to attempt to discover going forward, if there becomes any selling more directed towards the end of the week(s). A few numbers for your viewing pleasure.
    FIRST:
    *** UST yields chart, 6 month - 30 year. This chart is active and will display a 6 month time frame going forward to a future date. Place/hover the mouse pointer anywhere on a line to display the date and yield for that date. The percent to the right side is the percentage change in the yield from the chart beginning date for a particular item. You may also 'right click' on the 126 days at the chart bottom to change a 'time frame' from a drop down menu. Hopefully, the line graph also lets you view the 'yield curve' in a different fashion, for the longer duration issues, at this time. Save the page to your own device for future reference. NOTE: take a peek at the right side of this graph to find the yield swings of the past week, and for the current yields for the last business day.
    For the WEEK/YTD, NAV price changes, August 26 - August 30, 2024
    ***** This week (Friday), FZDXX, MMKT yield continues to move with Fed funds/repo/SOFR rates; and ended the week at 5.16% yield. MMKT's yields remain basically unchanged for the past weeks. Fidelity's MMKT's continue to maintain decent yields, as is presumed with other vendors similar MMKT's.
    --- AGG = -.52% / +3.18% (I-Shares Core bond), a benchmark, (AAA-BBB holdings)
    --- MINT = +.16% / +4.03% (PIMCO Enhanced short maturity, AAA-BBB rated)
    --- SHY = -.01% / +3.19% (UST 1-3 yr bills)
    --- IEI = -.29% / +3.2% (UST 3-7 yr notes/bonds)
    --- IEF = -.74% / +2.74% (UST 7-10 yr bonds)
    --- TIP = -.46% / +3.30% (UST Tips, 3-10 yrs duration, some 20+ yr duration)
    --- VTIP = -.04% / +3.79% (Vanguard Short-Term Infl-Prot Secs ETF)
    --- STPZ = -.12% / +3.71% (UST, short duration TIPs bonds, PIMCO)
    --- LTPZ = -1.52% / +2.04% (UST, long duration TIPs bonds, PIMCO)
    --- TLT = -1.93% / -.15% (I Shares 20+ Yr UST Bond
    --- EDV = -2.68% / -2.03% (UST Vanguard extended duration bonds)
    --- ZROZ = -2.73% / -3.52% (UST., AAA, long duration zero coupon bonds, PIMCO
    --- TBT = +3.90% / +5.70% (ProShares UltraShort 20+ Year Treasury (about 23 holdings)
    --- TMF = -5.77% / -12.71% (Direxion Daily 20+ Yr Trsy Bull 3X ETF (about a 2x version of EDV etf)
    *** Additional important bond sectors, for reference:
    --- BAGIX = -.49% / +3.54% Baird Aggregate Bond Fund (active managed, plain vanilla, high quality bond fund)
    --- LQD = -.86% / +3.12% (I Shares IG, corp. bonds)
    --- BKLN = +.67% / +5.23% (Invesco Senior Loan, Corp. rated BB & lower)
    --- HYG = -.08% / +4.29% (high yield bonds, proxy ETF)
    --- HYD = -.48%/+4.05% (VanEck HY Muni)
    --- MUB = -.42% /+1.05% (I Shares, National Muni Bond)
    --- EMB = -.45%/+6.51% (I Shares, USD, Emerging Markets Bond)
    --- CWB = +.20% / +4.00% (SPDR Bloomberg Convertible Securities)
    --- PFF = -.03% / +6.48% (I Shares, Preferred & Income Securities)
    --- FZDXX = 5.16% yield (7 day), Fidelity Premium MMKT fund
    *** FZDXX yield was .11%, April,2022. (For reference to current date)
    Comments and corrections, please.
    Remain curious,
    Catch
  • DJT in your portfolio - the first two funds reporting (edited)

    Breakdown
    67.83% % of Shares Held by All Insider
    6.57% % of Shares Held by Institutions
    20.43% % of Float Held by Institutions
    306 Number of Institutions Holding Shares
    Top Institutional Holders
    Holder Shares Date Reported % Out Value
    Vanguard Group Inc 2.88M Jun 30, 2024 1.44% 56,157,660
    Blackrock Inc. 2.18M Jun 30, 2024 1.09% 42,590,983
    Susquehanna Intl 1.06M Jun 30, 2024 0.53% 20,579,208
    Geode Capital Management, LLC 941.82k Jun 30, 2024 0.47% 18,365,490
    Citadel Advisors Llc 556.05k Jun 30, 2024 0.28% 10,843,053
    State Street Corporation 440.16k Jun 30, 2024 0.22% 8,583,198
    Greenwich Wealth Management Llc 353.5k Jun 30, 2024 0.18% 6,893,250
    Group One Trading, L.P. 340.04k Jun 30, 2024 0.17% 6,630,838
    Charles Schwab Investment 265.87k Jun 30, 2024 0.13% 5,184,484
    Jane Street Group, LLC 264.25k Jun 30, 2024 0.13%
  • Kotlikoff..."No one can safely use Fidelity's "Planning Tool" to plan their finances
    AND MaxFi and an everything you'd ever want to know LINK. Well, perhaps; but there's even a link to the Bogelheads and a discussion there. And don't miss the videos, too. SCROLL down the multi link page.
    All I want is a real portfolio returns list that can be verified from prior years. If one finds that list, please link here. Thank you.
  • Lewis Braham Does Gold …
    Ratio of GDX:GLD shows how depressed the miners are relative to gold-bullion. The ratio peaked at 0.586 in 2006, bottomed at 0.1089 in 2015 and at 0.1081 again in 2020 (pandemic low). Now it's only 0.167; the recent range is 0.136-0.173. It doesn't have to reach 0.586 to make money in miners.
    Of course, the miners were to blame in the past because they focused on exploration and production, not profitability. It is said that they are now different and more aware of shareholders' interests. Some even pay variable-dividends. But it would take more to lure back former investors who got burned repeatedly in the past.
    In the 1-yr chart of the ratio GDX:GLD, change the dates as needed.
    https://stockcharts.com/h-sc/ui?s=GDX:GLD&p=D&yr=1&mn=0&dy=0&id=p72470038519
  • Mid-Year MFO Ratings Posted ... New Navigation Bar
    Just posted all ratings to MFO Premium site through August, using Refinitiv data drop from Friday, 30 August. Used month-to-date (MTD) numbers to get preview of full month-ending drop, usually only missing a few funds.
    BRKA has been extraordinary this year at 31.8% YTD, 11.5% in August alone.
  • Kotlikoff..."No one can safely use Fidelity's "Planning Tool" to plan their finances
    Sorry @Baseball_Fan Can’t pull up the linked source.
    I do not use any particular planning tools. I invest primarily in a wide variety of actively managed moderate risk funds. All (except PRPFX) allow the manager a lot of discretion in what to own. Wouldn’t own these funds if didn’t trust the managers to make good decisions. When I do make a change in the stack of funds (as I did Friday) I follow up by using Fidelity’s analytics tool for some sort of corroboration as to how much market risk I have and how it is dispersed among asset types. Usually those results and my rough guess align pretty closely. I prefer a scotch / water ratio of about 50/50. In terms of fixed income vs. riskier assets, the desired proportion is pretty similar.
    Subscribe to James Stack’s informative InvesTech newsletter, surveying his recommended portfolio - but taking little in specific action from it. Subscribe to Bill Fleckenstein’s daily commentaries - his obsession over gold and his foreboding about equity valuations in general (“passive inflows” particularly). Subscribe to Barron’s, the WSJ and Bloomberg. Currently listening nightly to a long stack of podcasts by Meb Faber (Cambrea Funds) whose interviews with various money managers are both entertaining and insightful. I subscribe to Morningstar mainly for running fund comparisons. Sometimes their fund analysis points out how one manager’s approach varies from others in the same camp.