While the intent of that business insider chart is clear, the data are less so.
What stock market (US or global, S&P 500 or Wilshire 5000 or ...), and what bond market (ten year T-bonds, corporates, or ...)? If one uses returns of the S&P 500 and
10 year treasuries, the numbers don't match. They're not far off, but they show that at least this reader doesn't know quite what data were used.
What sort of rebalancing if any was done over the rolling
1, 5,
10, and 20 year periods? Nothing is said about this either.
Here's the data I used. It goes all the way back to
1928.
http://pages.stern.nyu.edu/~adamodar/New_Home_Page/datafile/histretSP.htmlThose older figures are important, because while returns since
1950 (a few years after WWII ended) have been "okay", earlier periods showed that the market can be even worse. Not that losing 2% each year for five years (cumulative loss of 9.6%) is that great.
It used to be we were told that "the stock market" (whatever that meant) never had a loss (ignoring inflation) over any ten year period since WWII (maybe that's what you were thinking of). But then
1999 - 2008 came along. And right after that, another rolling ten year nominal loss, 2000 - 2009.
There's a problem with putting too much faith in historical data. Things change. One can either ignore that, or adjust expectations accordingly.
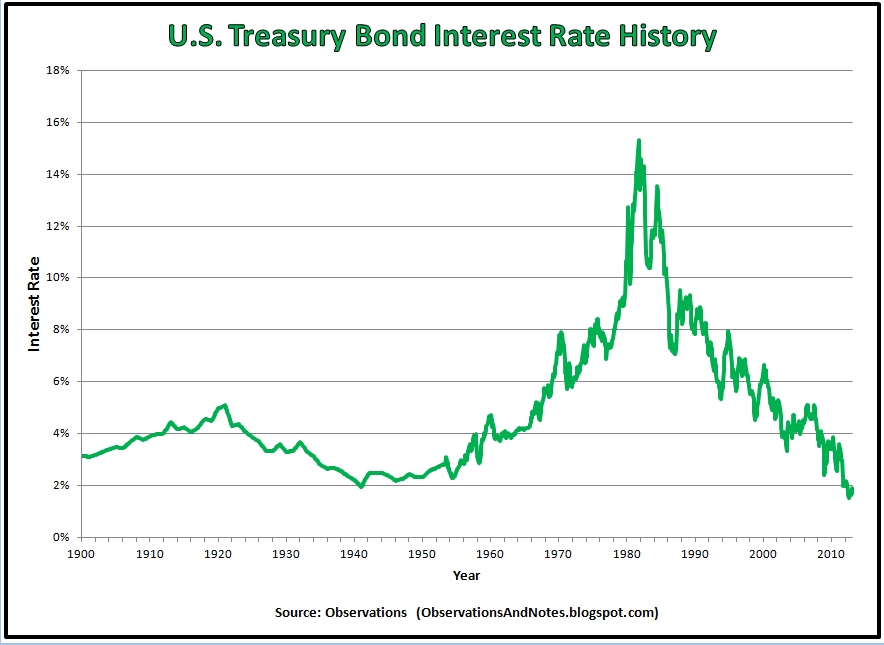
We've had a 35-40 year bull market in bonds (with
10 year treasury yields now bouncing around 2%), that followed a 35-40 year bear market in bonds (that started in
194
1 with yields around 2%). That's a looong cycle that should be incorporated into projections. There's no way that bonds can boost a portfolio's returns - they yield virtually nothing, and if the yield goes up, the total return could turn negative.
From the end of
1940 to the end of
1956 there were only two years where the total return of
10 year treasuries broke 4% (none 5% or more). Which gets us back to the question of whether these figures include rebalancing, and more generally, why even bother with bonds now? Cash isn't yielding that much less, and if interest rates rise, cash should track bonds. (In the
1940-
1956 time frame, 3 mo treasuries returned
1.6% annualized, not much worse than bonds at 2.6%, and with virtually no volatility.)
The only cherry picking I'm doing here is with the end date of
1956. Bond yields bottomed out around
194
1 at 2%, just as they seem to have done now (more or less). The graph below is ten year treasury yields over time.