Howdy, Stranger!

It looks like you're new here. If you want to get involved, click one of these buttons!

Here's a statement of the obvious: The opinions expressed here are those of the participants, not those of the Mutual Fund Observer. We cannot vouch for the accuracy or appropriateness of any of it, though we do encourage civility and good humor.
  • Fidelity Automatic Account Builder changes
    @Sven is asking what price is received when a purchase is made automatically, as opposed to being entered by the investor. It's a good question.
    Most automatic investments are via DRIP plans. "True" DRIPs are set up with the companies themselves. In these plans, investors often receive shares from a company based on its closing price on the day of reinvestment, frequently at a discount. For example:
    common stockholders may now receive a number of shares based on 95% of the market price per share of common stock at the close of regular trading on The Nasdaq Capital Market on the valuation date fixed by the Board for such distribution
    https://ir.ofscreditcompany.com/shareholder-services/dividend-reinvestment-plan
    However, for "synthetic" DRIPs, where the brokerage is reinvesting the divs, it's not clear what price the investor is paying for the additional shares. Likewise, when the brokerage is automatically purchasing shares (with investor cash, not divs) on scheduled dates, what price is paid for those shares?
    What Fidelity does when reinvesting divs (I don't know about scheduled investments):
    Note ... that the stock price at which your reinvestment occurs is not necessarily the same as the price that is in effect on the dividend payable date. This is because we generally buy the shares of domestic companies two business days before the dividend payable date [likely now one day before with T+1], at the market price(s) in effect at the time, in order to help ensure that we have shares on hand to place in your account on the dividend payable date.
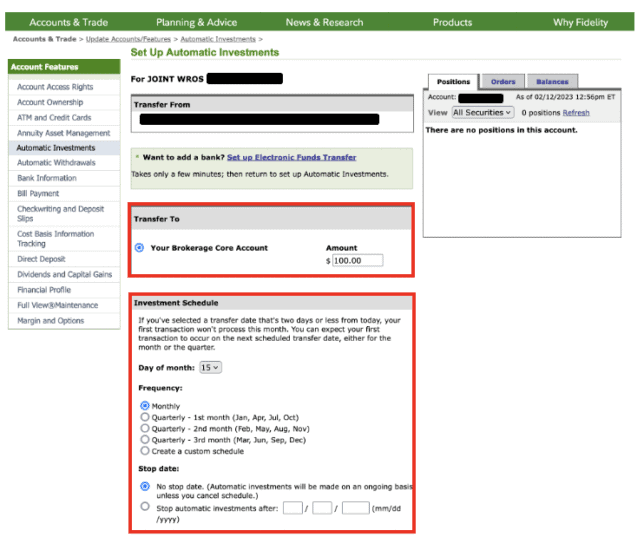
    https://www.fidelity.com/bin-public/060_www_fidelity_com/documents/customer-service/brokerage-retirement-cust-agree-and-commission-sched.pdf
    Related: what price does M* use for purchases in calculating total return including reinvested dividends?
    Reinvestments are made using the actual reinvestment price,
    https://admainnew.morningstar.com/directhelp/Glossary/Performance/Total_Return.htm
  • 31 Years of Stock Market Returns
    I’m in rare agreement with @Baseball_Fan on this one.
    Yes, over the long haul markets go up. Equities beat cash and bonds over very long periods. It’s been demonstrated that dead investors outperform living ones. But there are always lurking the unknown / unexpected downdrafts. When these ”ripples in space time” do occur investors often react irrationally. Dump and run is pretty common unless maybe you’re a ”steely-nerve” manager at a big investment house, hedge fund, pension fund or endowment with a sizable amount of your AUM locked-up for years.
    Most of us mere mortals invest in the real perceived everyday world. Setting a 25-30 year time horizon and then shutting your eyes is harder than it might sound. The fact that we are visiting this site is proof we haven’t shut our eyes to our investments. When a ‘29 or 2,000 or ‘08 comes along, it feels like the morning after drinking a bad bottle of booze. Lying flat on the floor, common sense and rationality often fly out the door.
  • DJT in your portfolio - the first two funds reporting (edited)
    A slightly different view, FWIW. The first number data after the 'name' is the percentage of, within the total holdings. I.E. .43% for the first Vanguard listing. Page data from M* for the top twenty.
    NT Ext Eq Mkt Indx Fd DC Lending Tier 5	Not Rated	—	0.02	
    Unlock
    1,649,659,963
    1,649,659,963
    ––
    Jun 30, 2024
    Vanguard Total Stock Mkt Idx Inv 0.43 0.00
    Unlock
    868,400
    0
    0.00% Jul 31, 2024
    Vanguard Institutional Extnd Mkt Idx Tr 0.38 0.02
    Unlock
    756,598
    4,126
    0.55% Jul 31, 2024
    Vanguard Small Cap Index Not Rated 0.34 0.01
    Unlock
    687,760
    1,863
    0.27% Jul 31, 2024
    Fidelity Extended Market Index 0.14 0.02
    Unlock
    281,449
    281,449
    ––
    Jun 30, 2024
    Vanguard Small Cap Value Index Inv 0.12 0.01
    Unlock
    231,593
    1,049
    0.46% Jul 31, 2024
    Vanguard Small Cap Growth Index Inv 0.10 0.02
    Unlock
    192,865
    -735
    0.38% Jul 31, 2024
    iShares Russell Mid-Cap Growth ETF 0.10 0.03
    Unlock
    192,396
    152
    0.08% Aug 28, 2024
    iShares Russell Mid-Cap ETF 0.09 0.01
    Unlock
    181,128
    132
    0.07% Aug 28, 2024
    Russell 1000 Index Fund Not Rated 0.09 0.00
    Unlock
    174,341
    0
    0.00% Jul 31, 2024
    Blackrock Russ 1000 Eq Idx Composite Not Rated 0.09 0.00
    Unlock
    174,341
    174,341
    ––
    Jun 30, 2024
    State St Russell Sm/Mid Cp® Indx NL Cl C 0.08 0.01
    Unlock
    161,788
    116,888
    260.33% Jul 31, 2024
    Schwab US Mid-Cap ETF™ 0.07 0.02
    Unlock
    131,950
    0
    0.00% Aug 30, 2024
    iShares Russell 1000 Growth ETF 0.06 0.00
    Unlock
    128,597
    48
    0.04% Aug 28, 2024
    Fidelity Nasdaq Composite Index 0.05 0.03
    Unlock
    105,223
    30,800
    41.39% May 31, 2024
    BlackRock Extended Equity Market K 0.05 0.02
    Unlock
    104,537
    104,537
    ––
    Jun 30, 2024
    iShares US Technology ETF 0.05 0.01
    Unlock
    99,370
    -39
    0.04% Aug 28, 2024
    BlackRock Russell 2500™ Index F 0.05 0.03
    Unlock
    93,367
    93,367
    ––
    Jun 30, 2024
    Fidelity Total Market Index 0.05 0.00
    Unlock
    90,922
    90,922
    ––
    Jun 30, 2024
    Fidelity Series Total Market Index 0.03 0.00
    Unlock
    68,109
    68,109
    ––
    Jun 30, 2024
    Total (for Top 20) 2.36 1,654,384,697
    1,650,626,972
  • BONDS The week that was.... December 31, 2024..... Bond NAV's...Most positive. FINAL REPORT 2024
    NOTE:
    My intention, at this time; is to present the data for the select bond sectors, as listed; through the end of the year (2024). This 'end date' will take us through the U.S. elections period, pending actions/legislation dependent upon the election results, pending Federal Reserve actions and market movers trying to 'guess' future directions of the U.S. economy. As important during this period, are any number of global circumstances that may take a path that is not expected; and/or 'new' circumstances. In the 'cooking pot' we currently have the big ingredients of the middle east and also, how much damage Ukraine may inflict upon Russia and the response.
    W/E August 30, 2024..... A week of price swings with few + NAV's
    Bond NAV's had many price swings through the week, with only a few on the list having a positive pricing week. *** I'm going to attempt to discover going forward, if there becomes any selling more directed towards the end of the week(s). A few numbers for your viewing pleasure.
    FIRST:
    *** UST yields chart, 6 month - 30 year. This chart is active and will display a 6 month time frame going forward to a future date. Place/hover the mouse pointer anywhere on a line to display the date and yield for that date. The percent to the right side is the percentage change in the yield from the chart beginning date for a particular item. You may also 'right click' on the 126 days at the chart bottom to change a 'time frame' from a drop down menu. Hopefully, the line graph also lets you view the 'yield curve' in a different fashion, for the longer duration issues, at this time. Save the page to your own device for future reference. NOTE: take a peek at the right side of this graph to find the yield swings of the past week, and for the current yields for the last business day.
    For the WEEK/YTD, NAV price changes, August 26 - August 30, 2024
    ***** This week (Friday), FZDXX, MMKT yield continues to move with Fed funds/repo/SOFR rates; and ended the week at 5.16% yield. MMKT's yields remain basically unchanged for the past weeks. Fidelity's MMKT's continue to maintain decent yields, as is presumed with other vendors similar MMKT's.
    --- AGG = -.52% / +3.18% (I-Shares Core bond), a benchmark, (AAA-BBB holdings)
    --- MINT = +.16% / +4.03% (PIMCO Enhanced short maturity, AAA-BBB rated)
    --- SHY = -.01% / +3.19% (UST 1-3 yr bills)
    --- IEI = -.29% / +3.2% (UST 3-7 yr notes/bonds)
    --- IEF = -.74% / +2.74% (UST 7-10 yr bonds)
    --- TIP = -.46% / +3.30% (UST Tips, 3-10 yrs duration, some 20+ yr duration)
    --- VTIP = -.04% / +3.79% (Vanguard Short-Term Infl-Prot Secs ETF)
    --- STPZ = -.12% / +3.71% (UST, short duration TIPs bonds, PIMCO)
    --- LTPZ = -1.52% / +2.04% (UST, long duration TIPs bonds, PIMCO)
    --- TLT = -1.93% / -.15% (I Shares 20+ Yr UST Bond
    --- EDV = -2.68% / -2.03% (UST Vanguard extended duration bonds)
    --- ZROZ = -2.73% / -3.52% (UST., AAA, long duration zero coupon bonds, PIMCO
    --- TBT = +3.90% / +5.70% (ProShares UltraShort 20+ Year Treasury (about 23 holdings)
    --- TMF = -5.77% / -12.71% (Direxion Daily 20+ Yr Trsy Bull 3X ETF (about a 2x version of EDV etf)
    *** Additional important bond sectors, for reference:
    --- BAGIX = -.49% / +3.54% Baird Aggregate Bond Fund (active managed, plain vanilla, high quality bond fund)
    --- LQD = -.86% / +3.12% (I Shares IG, corp. bonds)
    --- BKLN = +.67% / +5.23% (Invesco Senior Loan, Corp. rated BB & lower)
    --- HYG = -.08% / +4.29% (high yield bonds, proxy ETF)
    --- HYD = -.48%/+4.05% (VanEck HY Muni)
    --- MUB = -.42% /+1.05% (I Shares, National Muni Bond)
    --- EMB = -.45%/+6.51% (I Shares, USD, Emerging Markets Bond)
    --- CWB = +.20% / +4.00% (SPDR Bloomberg Convertible Securities)
    --- PFF = -.03% / +6.48% (I Shares, Preferred & Income Securities)
    --- FZDXX = 5.16% yield (7 day), Fidelity Premium MMKT fund
    *** FZDXX yield was .11%, April,2022. (For reference to current date)
    Comments and corrections, please.
    Remain curious,
    Catch
  • DJT in your portfolio - the first two funds reporting (edited)

    Breakdown
    67.83% % of Shares Held by All Insider
    6.57% % of Shares Held by Institutions
    20.43% % of Float Held by Institutions
    306 Number of Institutions Holding Shares
    Top Institutional Holders
    Holder Shares Date Reported % Out Value
    Vanguard Group Inc 2.88M Jun 30, 2024 1.44% 56,157,660
    Blackrock Inc. 2.18M Jun 30, 2024 1.09% 42,590,983
    Susquehanna Intl 1.06M Jun 30, 2024 0.53% 20,579,208
    Geode Capital Management, LLC 941.82k Jun 30, 2024 0.47% 18,365,490
    Citadel Advisors Llc 556.05k Jun 30, 2024 0.28% 10,843,053
    State Street Corporation 440.16k Jun 30, 2024 0.22% 8,583,198
    Greenwich Wealth Management Llc 353.5k Jun 30, 2024 0.18% 6,893,250
    Group One Trading, L.P. 340.04k Jun 30, 2024 0.17% 6,630,838
    Charles Schwab Investment 265.87k Jun 30, 2024 0.13% 5,184,484
    Jane Street Group, LLC 264.25k Jun 30, 2024 0.13%
  • Kotlikoff..."No one can safely use Fidelity's "Planning Tool" to plan their finances
    AND MaxFi and an everything you'd ever want to know LINK. Well, perhaps; but there's even a link to the Bogelheads and a discussion there. And don't miss the videos, too. SCROLL down the multi link page.
    All I want is a real portfolio returns list that can be verified from prior years. If one finds that list, please link here. Thank you.
  • Lewis Braham Does Gold …
    Ratio of GDX:GLD shows how depressed the miners are relative to gold-bullion. The ratio peaked at 0.586 in 2006, bottomed at 0.1089 in 2015 and at 0.1081 again in 2020 (pandemic low). Now it's only 0.167; the recent range is 0.136-0.173. It doesn't have to reach 0.586 to make money in miners.
    Of course, the miners were to blame in the past because they focused on exploration and production, not profitability. It is said that they are now different and more aware of shareholders' interests. Some even pay variable-dividends. But it would take more to lure back former investors who got burned repeatedly in the past.
    In the 1-yr chart of the ratio GDX:GLD, change the dates as needed.
    https://stockcharts.com/h-sc/ui?s=GDX:GLD&p=D&yr=1&mn=0&dy=0&id=p72470038519
  • January MFO Ratings Posted
    Just posted all ratings to MFO Premium site through August, using Refinitiv data drop from Friday, 30 August. Used month-to-date (MTD) numbers to get preview of full month-ending drop, usually only missing a few funds.
    BRKA has been extraordinary this year at 31.8% YTD, 11.5% in August alone.
  • Kotlikoff..."No one can safely use Fidelity's "Planning Tool" to plan their finances
    Sorry @Baseball_Fan Can’t pull up the linked source.
    I do not use any particular planning tools. I invest primarily in a wide variety of actively managed moderate risk funds. All (except PRPFX) allow the manager a lot of discretion in what to own. Wouldn’t own these funds if didn’t trust the managers to make good decisions. When I do make a change in the stack of funds (as I did Friday) I follow up by using Fidelity’s analytics tool for some sort of corroboration as to how much market risk I have and how it is dispersed among asset types. Usually those results and my rough guess align pretty closely. I prefer a scotch / water ratio of about 50/50. In terms of fixed income vs. riskier assets, the desired proportion is pretty similar.
    Subscribe to James Stack’s informative InvesTech newsletter, surveying his recommended portfolio - but taking little in specific action from it. Subscribe to Bill Fleckenstein’s daily commentaries - his obsession over gold and his foreboding about equity valuations in general (“passive inflows” particularly). Subscribe to Barron’s, the WSJ and Bloomberg. Currently listening nightly to a long stack of podcasts by Meb Faber (Cambrea Funds) whose interviews with various money managers are both entertaining and insightful. I subscribe to Morningstar mainly for running fund comparisons. Sometimes their fund analysis points out how one manager’s approach varies from others in the same camp.
  • Kotlikoff..."No one can safely use Fidelity's "Planning Tool" to plan their finances
    image
    Annual income twenty pounds, annual expenditure nineteen nineteen and six, result happiness. Annual income twenty pounds, annual expenditure twenty pounds nought and six, result misery.
  • Fidelity Automatic Account Builder changes
    This is the feature that lets you buy additional shares of a TF fund at Fidelity for $5. Has anyone used it recently?
    It used to be that you could schedule automatic investments of funds monthly or quarterly. But now, you must schedule automatic investments weekly, every two weeks, or monthly. I suppose that's helpful if one is making investments from periodic paychecks, but otherwise this seems excessive.
    If there was an announcement about this change, I missed it.
    The interface used to look like this:
    image
    Fidelity has also added the ability to schedule automatic (weekly, biweekly, or monthly) ETF and stock investments. They are executed as market orders on the specified dates. I don't know the time of day that the orders are executed.
    https://www.fidelity.com/trading/recurring-investments
  • The Thrilling 36 Funds
    Kinnel seems to imply you have to subscribe to M* Institutional database to run the screen. I haven't tried it in Fund investor. But why publish articles for individual investors based on a screen only available to high end clients?
    It was never possible to replicate his screen at the M* retail level. Years ago he wrote how to approximate his screen with Premium Screener and with some third party screeners.
    https://www.morningstar.com/funds/making-fund-screeners-fantastic
    Here's the 2017 "Fantastic 43" version that he mentions.
    https://www.morningstar.com/funds/kinnel-43-fantastic-funds
    In it, he answered your question "why include closed funds" in much the same way that @WABAC did: "Many people still own them and want to know if they still make the grade."
    He stated the purpose of his (then) $25K limit on min investment as "to help you get a list you can use."
    Comparing how one could use the old Premium Screener as described in the piece with today's Investor screener reveals just how far M* has fallen in supporting retail users.
    M* used to have a whole series of articles each with a different screen that Premium subscribers could run. They even contained a link to run the screen. Here's one example (via Wayback Machine):
    Finding Stock Funds with Big Yields
    Unlike Kinnel's "Fantastic" and "Thrilling" series where he gives all the results, these other pieces named only a few of the results (3 of 19 in the Big Yields piece). While somewhat helpful, they carried a whiff of a sales pitch, telling you that if you were a Premium subscriber you could see all the results.
    "That's where Morningstar's Premium Fund Screener comes in."
  • Buying Savings Bonds via IRS Tax Refunds to Discontinue from 1/1/25
    Treasury is discontinuing the program to buy additional $5K in paper Savings Bonds through IRS tax refunds from 1/1/25. Lack of demand, higher costs and losses in US Mail are cited as reasons.
    The electronic purchase limit of $10K is unchanged.
    IMO, with the US deficits and debt rising, the Treasury should improve its Savings Bonds program. Instead, it's gradually making it more difficult to buy and sell them. And the response time of Treasury Direct for many issues is weeks.
    https://www.treasurydirect.gov/research-center/faq-irs-tax-feature/
  • The Thrilling 36 Funds
    If you don't like TRAIX as an example of a fund share class that slipped through the cracks, here's another share class that Kinnel missed: NCRLX.
    Kinnel requires just one manager to have invested $1M. It doesn't even have to be the longest tenured one. For example, in VEXPX, only 1 of 9 managers has $1M invested, and it isn't the most senior one. Likewise, in NCRLX, one of the managers, Bradley Tank, has $1M invested. That's enough.
    There's also the matter of the fund outperforming its benchmark for the duration of a manager's tenure. Here too, Kinnel doesn't say that has to be the longest tenured manager, just one with at least five years on the job. So I looked at performance during Tank's stay. He started in April 2009.
    The M* performance chart (set for "month end") shows that for the past 10 years (from Sept 2014 through Aug 2024), NCRLX modestly outperformed its benchmark index, 1.79% annualized to 1.57% annualized. I compared the performance of NCRLX with AGG between April 2009 and Aug 2014 and it was no contest. Portfolio Visualizer shows that NCRLX returned a total of about 50% while AGG returned just half of that.
    That's not a misquote or an error on my part. The vast majority of the difference came from 2009. That's confirmed in the 2010 prospectus. For all of 2009, NCRLX returned 18.13% vs. 5.93% for the US Aggregate Bond Index.
    The other screening criteria:
    • Lowest quintile expense ratio in category (i.e. fee level - broad): low (per M* screener)
    • M* risk lower than high: Above average (per M* screener)
    • M* medalist (Bronze+): Bronze
    • Parent pillar better than average: Above average
    • Share class accessible to investors with min not more than $50K: Accessible at Vanguard w/$500 min
    • Not a fund of funds: holds nearly 900 individual bonds
    • Rated by M* analysts: 100% analyst driven
    How did Kinnel miss NCRLX?
    My guess is that it was because he was looking at the "official" min for shares. But all that is required is that the share class be accessible somewhere for not more than $50K.
    With respect to expense ratios, he was clear in saying that the figures come from the prospectuses. With mins, he didn't impose that restriction. Possibly because lots of funds are available through brokerages with lower mins than stated in their prospectuses.
  • The Week in Charts | Charlie Bilello
    The Week in Charts (08/30/24)
    The most important charts and themes in markets and investing, including:
    00:00 Intro
    00:20 Free Wealth Path Analysis
    01:06 Topics
    01:59 Priced for Perfection
    07:28 The AI Arms Race
    13:11 Berkshire Joins the Trillion Dollar Club
    17:22 The Return of Sound Money
    25:09 Shrinking Salaries
    28:55 Double the Down Payment
    31:18 Is the Lock-in Effect Starting to Ease?
    37:00 More Affordable Rents
    Video
  • Stable-Value (SV) Rates, 9/1/24
    Stable-Value (SV) Rates, 9/1/24
    TIAA Traditional Annuity (Accumulation) Rates
    Rates down by 25 bps
    Restricted RC 5.25%, RA 5.00%
    Flexible RCP 4.50%, SRA 4.25%, IRA-101110+ 4.50%
    (TIAA Declaration Year 3/1 - 2/28)
    TSP G Fund pending (previous 4.125%).
    Options outside of workplace retirement plans include m-mkt funds, bank m-mkt accounts (FDIC insured), T-Bills, short-term brokered CDs.
    #StableValue #401k #403b #TIAA #TSP
    https://ybbpersonalfinance.proboards.com/post/1632/thread
  • The Thrilling 36 Funds
    TRAIX management fee is 59 basis points, still not the lowest quintile. It would have to be below 50 basis points to qualify.
    Source?
    On the TRAIX M* price page is a bar graph divided into quintiles that labels the price of TRAIX as "low" (first quintile).
    For reference, the bar graph on the PRWCX price page labels that cost as "average" (third quintile), and the bar graph on the PRFDX price page labels that share class' cost as "below average" (second quintile).
    Maybe you prefer text to graphics (I do). M* says that the distribution fee level for these institutional class shares is low relative to the fees of institutional class shares of "other funds that invest in a similar asset class".
    And M* defines "low" as meaning "least expensive quintile".
    It doesn't specify where that minimum must be invested,
    If we're going to split hairs this finely, as you noted the rule is that the share class must be accessible to "individual investors with a minimum investment of no greater than $50,000". Assuming arguendo that this means the individual investor(s) seeking to invest in TRAIX need have no more than $50,000 invested in toto, TRAIX still passes the test.
    TRP requires only that individual investors be Summit Program investors at the Personal Services level. Individual investors can qualify with no money at all invested anywhere. They might have a wealthy old aunt living with them who has separately invested with TRP. That would do.
    https://www.troweprice.com/personal-investing/about/client-benefits/index.html
    One other thing about splitting hairs. "Accessible" doesn't mean that an individual investor could actually invest in each of the Thrilling 36 with $50K or less. It's purely thought experiment; some of the funds passing this screen are closed. At least TRAIX is open to Summit Program Personal Services individual investors.
  • The Thrilling 36 Funds
    PRWCX didn't make the cut because its cost isn't much below average. But TRAIX's is, and it is available to individual Summit Preferred Services customers at T. Rowe Price with a $50K min. ("Must be a share class accessible to individual investors with a minimum investment of no greater than $50,000.")
    TRAIX management fee is 59 basis points, still not the lowest quintile. It would have to be below 50 basis points to qualify.
    Also, the rule as stipulated is
    "Must be a share class accessible to individual investors with a minimum investment of no greater than $50,000." It doesn't specify where that minimum must be invested, or if it must be in that particular fund. Purchase of TRAIX requires a minimum investment of $500,000, so it violates the rule, end of story.
  • Good Ol’ Fidelity +1
    Today I rearranged the deck chairs by consolidating down from 9 roughly equal positions + cash to 7 roughly equal positions + cash. There are no new funds - just adding to existing ones and retiring some stock holds and one etf. Working in both the Trad and Roth, “available” cash was tight. Didn’t want to overshoot and submit an order for something without adequate cash to cover. Got complicated. Thought I’d done my homework, but at first blush the numbers didn’t add up. Had to cancel several pending OEF “buy” orders - some twice - before I caught an obvious oversight. With 5 minutes left until the 4 PM close I got it all figured out and the 5 pending OEF purchases lined up to go through overnight. One CEF and one ETF went through same day. Whew!
    It’s a tribute to Fidelity's excellent platform that I didn’t “kill the goose” somewhere along in the process - or worse yet, end up with half goose and half turkey.