Howdy, Stranger!

It looks like you're new here. If you want to get involved, click one of these buttons!

Here's a statement of the obvious: The opinions expressed here are those of the participants, not those of the Mutual Fund Observer. We cannot vouch for the accuracy or appropriateness of any of it, though we do encourage civility and good humor.
  • SS COLA 2024
    Thanks for the CPI-W figures posted. My opinion. A fool would think these figures are true and correct. I do the food shopping for the home. One example. At our Aldi, a true discount food store, a box of saltines has gone from 0.95 to 1.49 in the past year. That is a 48% increase. I could go on and on but there is no need. To report a past yearly food inflation rate of 3.8% is absurd. I estimate our food bill has increased by 25% -30% in the past year and expect it to rise way more than 3.8% in the next year.I doubt many would argue with me on this point.
  • SS COLA 2024
    Nice post from @Catch22 that explains how CPI is calculated. Problem is: There’s no “average” American, so everyone’s affected differently. I did read somewhere that auto insurance has skyrocketed recently - a lot to do with all the technology that goes into new vehicles today. ”Computers on Wheels” to a degree. So if you smash one up repairs can be enormous. I haven’t noticed it yet. Carry a relatively high $2500 collision deductible. (At least my insurance agent considers it so). House insurance has been greatly impacted by all the natural disasters in some regions. In some areas people are lucky to obtain it at any price.
    What sometimes gets overlooked in thinking of inflation is the compounding effect. 5% a year for 5 years works out to better than a 27.5% cost of living rise in only 5 years. And, future annual increases compound off of that number. Adds up fast.
    Thanks for the spreadsheet @msf. Enlightening
  • SS COLA 2024
    Medicare isn't based on any inflation index. Medicare looks at its estimated expenses and then devises several IRMAA tiers annually with varying levels of subsidies. Participants pay 25% (basic, no IRMAA), 35%, 50%, 65%, 80%, 85% of the total costs.
    https://www.ssa.gov/benefits/medicare/medicare-premiums.html
  • SS COLA 2024
    CPI-W "fingers". https://www.bls.gov/cpi/tables/supplemental-files/cpi-w-202309.xlsx
    	Consumer Price Index for Urban Wage Earners and Clerical Workers (CPI-W): 
    U.S. city average, by expenditure category, September 2023
    [1982-84=100, unless otherwise noted]
    Indent Expenditure category Relative Unadjusted
    Level importance percentage change
    Aug. 2023 Sept. 2022 -
    Sept. 2023
    0 All items 100.000 3.6
    1 Food 14.894 3.8
    2 Food at home 9.391 2.4
    3 Cereals and bakery products 1.258 4.8
    3 Meats, poultry, fish, and eggs 2.119 0.3
    3 Dairy and related products 0.818 -0.3
    3 Fruits and vegetables 1.607 0.7
    3 Nonalcoholic bevs and beverage materials 1.191 4.0
    3 Other food at home 2.397 4.3
    2 Food away from home 5.503 6.1
    1 Energy 8.797 -0.2
    2 Energy commodities 5.102 2.6
    3 Fuel oil 0.081 -6.2
    3 Motor fuel 4.971 2.8
    4 Gasoline (all types) 4.866 3.1
    2 Energy services 3.696 -3.7
    3 Electricity 2.958 2.1
    3 Utility (piped) gas service 0.738 -21.7
    1 All items less food and energy 76.309 4.1
    2 Commodities less food and energy comm. 21.429 -0.2
    3 Apparel 3.028 2.9
    3 New vehicles 3.936 2.5
    3 Used cars and trucks 2.995 -7.9
    3 Medical care commodities 1.292 4.4
    3 Alcoholic beverages 0.695 4.8
    3 Tobacco and smoking products 0.741 5.7
    2 Services less energy services 54.880 5.9
    3 Shelter 33.030 7.2
    4 Rent of primary residence 10.345 7.6
    4 Owners' equivalent rent of residences(1) 21.516 7.0
    3 Medical care services 5.454 -3.6
    4 Physicians' services 1.439 0.1
    4 Hospital services(2) 1.810 4.4
    3 Transportation services 6.408 10.9
    4 Motor vehicle maintenance and repair 1.214 10.3
    4 Motor vehicle insurance 3.463 19.2
    4 Airline fares 0.426 -13.2
    Footnotes:
    (1) Indexes on a December 1982=100 base.
    (2) Indexes on a December 1996=100 base.
  • SS COLA 2024
    My guess is that after the expected Medicare part B and D cost increases for next year this 3.2% will be a joke and more closer to 0%.
    You would guess wrong. The average monthly increase in SS (based on a 3.2% increase and the average current payment of $1705.59) is $54.58. While we don't have final figures on increases in Medicare Parts B and D, CMS projects them to be $9.90 and $0.64 respectively. That leaves the bulk of the SS increase untouched.
    SS increase: https://www.cnbc.com/select/social-security-2024-cola-increase
    Part B incr: https://www.nytimes.com/2023/10/12/your-money/social-security-cola-2024.html
    Part D incr: https://www.cms.gov/newsroom/press-releases/medicare-advantage-and-medicare-prescription-drug-programs-remain-stable-2024
    Further, new legislation by the government caps insulin co-pays at $35. That is a significant decrease in medical costs for many people. Though since "only" around 8.4 million people are using insulin, that means that the "man on the street" won't see this. (There are around 50 million retirees receiving Social Security benefits.)
    Soc Sec Retirees: https://www.ssa.gov/news/press/factsheets/basicfact-alt.pdf
    Insulin users: https://apnews.com/article/health-prices-diabetes-congress-a2f9986b7bf3500b81d1ec80a01e5abb
  • Leuthold: the lights have all turned red, time to lighten up on stocks
    @Derf I added SPY and AGG (bond proxy) to a new chart that reflects total returns, 1 year prior and 1 year following March, 2018 to look for clues. It appears FBALX was better positioned to follow SP500 at the time. One may note the end of 2018. If my brain cells are working properly, was this not a very short period 'flash crash' of the equity market??? Help me remember, eh? CHART
    Meanwhile, I have classic rock music playing 'loud' behind my seated position and perhaps that is affecting my recall. :)
  • Investors Should Fight the Temptation of Cash (Opinion Piece from the FT)
    I just checked with my wife about me possibly being "sophisticated”. She looked at me funny and broke into uncontrollable laughter. I wonder what that meant?
    a fine image
    >> ... cash should not be thought of as an equity substitute.
    >> Investing is a game where success usually follows those who think using probabilities, rather than certainty.
    >> Over a five-year period, the difference between stocks and cash is more than 50%. Over 20 years, it’s more than 700%.
    I mean, seriously.
    Maybe I shoulda written 'unsavvy'. The first line above is prizewinning, though.
  • Leuthold: the lights have all turned red, time to lighten up on stocks
    Being curious. LCORX v BRUFX v FBALX chart from 2004 to present being limited by Bruce inception at 2004.
    FPACX v CTFAX v FBALX chart. Please correct me if FPA Crescent fund is not the correct ticker. Both the FPA and Thermostat are the loaded versions of these funds. There may be other choices.
    Remain curious,
    Catch
    Hi, catch! Pardon the intrusion on your post. FPACX is the correct symbol but it is a no-load fund with a $1500 minimum. Thermostat "A" has a load though those are increasingly nominal. It is, for example, no-load/NTF at Schwab. And there are, indeed, lots of other choices! David
  • New I-Bond Variable Rate, 10/12/23
    To clarify: you don't get interest in the month that you sell.
    So if you sell at the beginning of a month you've only lost a day's interest (for that month). But if you sell near the end of the month, you get nothing for those 30 days or so.
    It is better to sell them at 6 month intervals from the purchase date to make full use of current rates.
    That works if you're out of the penalty period (savings bonds held for at least 5 years). If you're subject to a 3 month penalty, then it's better to hold the bonds for 3 months past the final month of the old rates. That way, you get the full use of the older (presumably higher) rates. You just lose 3 months interest at the new (presumably lower) rate.
    https://keilfp.com/blogpodcast/when-to-cash-out-i-bonds/#When_Should_I_Cash_Out_My_I_Bonds
  • Vanguard Bank Sweep & Bank of Baroda
    Bank of Baroda (#2 in India) is on Vanguard Bank Sweep List. While those funds may be FDIC insured (unclear if clear fraud or theft), this news about possible theft/fraud by employees is alarming. Apparently, Bank has a new app and the Bank was pushing its use aggressively. So, for the accounts that didn't have mobile phones associated with them, the Bank employees just entered their own or relatives'/friends' mobiles. While not many cases of abuse have been reported, this opens lots of potential fraud possibilities. Reserve Bank of India (RBI; like the Federal Reserve here) has imposed some penalties on the Bank.
    https://www.newindianexpress.com/business/2023/oct/12/bank-of-baroda-associates-stole-funds-from-hundreds-of-accounts-via-mobile-app-says-report-2623275.html
    https://personal.vanguard.com/pdf/Bank_Sweep_Participating_Banks.pdf
  • Leuthold: the lights have all turned red, time to lighten up on stocks
    The Leuthold Group originally was an research provider to institutional and HNW investors. The success of their research enterprise led them to begin managing money for rich people as a side business, and then to managing money for bright individual investors. Since investing is purely a mind game (a stock is worth what people believe it's worth, a market rises when people believe it will rise ... an act accordingly), they have identified and continuously track at huge variety of cue that have more or less greater predictive reliability when it comes to the economy and markets.
    The snapshot is their Major Trend Index, which looks at changes in four broad aggregates: sentiment, valuations, technicals (e.g. trendlines or market breadth) and cyclicals (the behavior of assets that rise and fall with the rhythms of the economy and market). They say: "Major Trend Index is a weekly email update on the status of our 130+ factor assessment of stock market risk."
    As of yesterday, it went broadly negative.
    The Major Trend Index slipped into its Negative zone as of the week ended October 6th, after spending the last nine months oscillating within the Neutral zone. Thanks mostly to a falloff in the Technical category, the reading dropped one notch to -2. (Scores of -2 to -5 are considered Negative for stocks in the intermediate term.)
    The MTI’s decline prompted us to further reduce equity weightings in our tactical portfolios. In the Leuthold Core Fund, Core private accounts, and Leuthold Global Fund, equity hedges were adjusted to decrease net equity exposure to 44%. The Leuthold Core ETF exposure was also lowered to 44% via a reduction in long equity positions. Prior to yesterday’s changes, these portfolios had been positioned with net equity exposure around 47-48%. ("MTI: Turned Negative, Trimming Equities Further," 10/10/2023)
    Two notes: (1) they're pretty good at what they do. Their core product is Leuthold Core Investment which is a five-star, Gold rated tactical allocation fund. Neither allocation is 60/40 but they can drop stocks as low as 40%. Since inception in 1995, they've made 7.8% APR; in every trailing period they post higher returns than their peers (0.7-3.5% APR) with noticeably lower volatility. Their portfolio decisions are driven by the output of their quant models, not by their managers' gut. On whole, I would describe them as institutionally cautious.
    (2) this is not a "deep red" state yet. The system goes from three red stars to three green ones. Right now, the graphic summary is two red stars. Technicals are deteriorating (that the whole magic talk of 400 day moving averages and crossing or converging trend lines and such); up until now the other factors had been red but technicals were holding up.
    Morningstar dislikes tactical allocation funds as a group. The argument is that most of them suck, and some suck badly, through a combination of mistimed guesses and high expenses. (Which, by the way, is true of almost all managers: whether it's a professional trading stocks or an amateur trading ETFs.) I own two such funds (FPA Crescent and Leuthold) because I know that I don't like losing money and don't have the time and expertise to tweak my portfolio. For those looking for managers who obsess about allocation so you don't have to, Bruce (despite the passing of the elder Mr. Bruce) and Columbia Thermostat tend to be in the top tier for Sharpe ratio across most trailing evaluation periods.
  • October’s article from Devesh Shah
    I too found the article by @Devo fascinating.
    A broad-brush approach to the issues of interest rates and bonds, and how they intertwine with different investors’ approaches, needs and expectations. I’m left with the overarching sense that over time all assets are interconnected. Valuations / expectations for one asset class or segment of the economy eventually spill over and affect others. The process can seem excruciatingly long. In keeping with Devo’s Carl Sagan analogy - the orbital path of the Earth around the Sun is influenced to some degree by every other body in the universe, slight though the gravitational pull might be.
    Does a 5% rate on cash represent a “good” investment? How about 7%? I’ve witnessed 15-20% in my lifetime (which may help explain my slumberous response to 5%). None of these rates is in itself “good” or “bad.” It’s the broader picture and context that matter to investors. Albeit, there’s been a lot of attention paid to the “rate of inflation”. That’s an important consideration. But, like the universe, the ultimate ramifications of today’s interest rate / bond markets and what they mean to investors going forward are far reaching and largely unknown.
  • New I-Bond Variable Rate, 10/12/23
    For many I-Bond holders, the decision may to hold or fold. If they bought last year, they have to wait at least 12 months, and then up to 5 years, there is 3 month interest penalty (Treasury Direct value shown is net of applicable penalty). It is better to sell them at 6 month intervals from the purchase date to make full use of current rates. Also, sell early in the month to still get whole month's interest (flip side is to buy late in the month, although most won't be buying).
  • CD versus Money Market Rates
    It depends on how likely you are to need the money. You can get a 5.65% 1-year CD not counting a 3 mo penalty if you redeem early. Depending on how likely you are to draw on the money, your expected return could beat the MMF.
    Either way, you're making some bets - how likely you are to need the money and which way interest rates will move.
    In a taxable account, I might place my bet on a 1 year Treasury (5.46% as of the moment). It is tax-deferred and state tax-exempt. Unless you expect rates to go up, you won't lose principal with this, and could even make some money if rates drop and you cash in (sell) early.
    I do not think that I bonds (with a 3 mo penalty) make sense for a one year investment.
  • New I-Bond Variable Rate, 10/12/23
    Here's an interesting piece written a week ago on divining the next fixed rate. As the writer states, there is no rule that the Treasury follows, just heuristics.
    https://tipswatch.com/2023/10/08/the-i-bonds-fixed-rate-will-rise-but-by-how-much/
    TreasuryDirect provides this cryptic information:
    The Secretary of the Treasury, or the Secretary’s designee, determines the fixed rate. The rate is based on market rates that have been adjusted to account for the value of components unique to savings bonds. These include the early redemption put option, tax deferral feature, deferred purchase feature, and Treasury’s administrative costs.
    Translation: The Treasury looks at current real yields (such as market yields on Treasury Inflation-Protected Securities) and adjusts those yields to reflect the advantages of I Bonds: primarily tax-deferred interest and a flexible maturity.
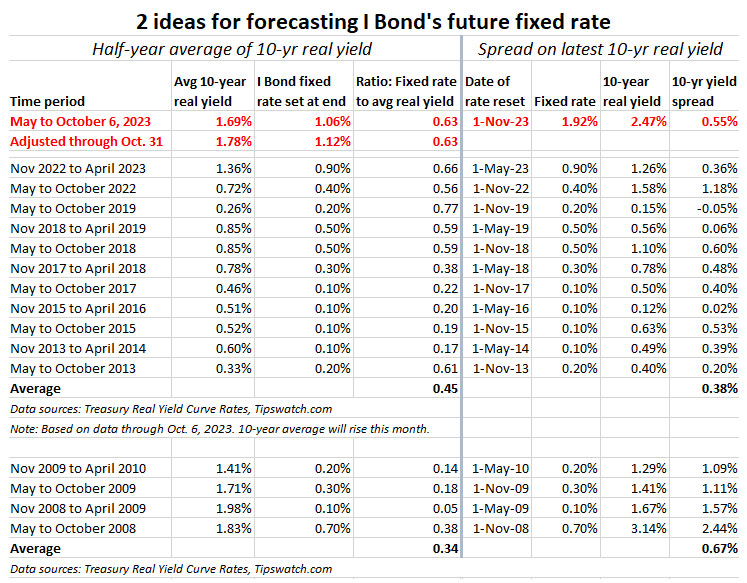
    He goes on to suggest two ways of guessing the next rate:
    image
    He discusses his thinking in detail. He also has a followup in the posts on the page. There he says that real rates have dropped significantly in the last week (since he wrote the piece), making a 1.2% fixed rate more likely than a week ago.

    Regardless, I bonds don't look like a good substitute for a short term 1-year T-bill. That would yield roughly
    ½ x 4.3% + ¼ x 5.5% (guess) ≈ 3.5% (after 3 mo penalty)
  • CD versus Money Market Rates
    Is it really worth it to tie up money for 1 year at 5.45 %/CD compared to total access in a money market account paying 5.25%, unless you think rates are going to come down in the next year?
  • New I-Bond Variable Rate, 10/12/23
    New I-Bond Variable Rate, 10/12/23
    Semiannual inflation rate 1.9723%
    Composite rate = b + 2f + bf, where b is the base/fixed rate (annual), f is the semiannual inflation rate.
    Base/fixed rate should go up from 0.90% to 0.90-1.5% (compare with the current 5-yr TIPS rate of 2.39%)
    So, the estimated I-Bond rate range for 11/1/23 is 4.86-5.47%.
    The actual I-Bond rate will be posted on 11/1/23.
    https://ybbpersonalfinance.proboards.com/post/1209/thread
  • AAII Sentiment Survey, 10/11/23
    AAII Sentiment Survey, 10/11/23
    BULLISH became the top sentiment (40.0%; above average) & neutral remained the bottom sentiment (23.5%; low); bearish became the middle sentiment (36.5%; above average); Bull-Bear Spread was +3.5% (below average). Investor concerns: Budget; inflation; economy; the Fed; dollar; crypto regulations; market volatility (VIX, VXN, MOVE); Russia-Ukraine war (85+ weeks, 2/24/22-now); Israel-Gaza*; geopolitical. For the Survey week (Th-Wed), stocks were up, bonds up, oil down, gold up, dollar down. *Assumption now is that the hostilities won't spread through Middle East. #AAII #Sentiment #Markets
    https://ybbpersonalfinance.proboards.com/post/1208/thread
  • Distributions estimates starting to be released
    excellent. There's a pre-existing thread for this very thing begun by The Shadow. It's a tradition of his, and we're glad for it. Might be a good idea to move this over there?
    https://www.mutualfundobserver.com/discuss/discussion/61500/2023-capital-gains-distribution-estimates#latest
  • RiverPark Short Term High Yield Fund re-opening to new investors
    AUM history for RPHYX + RPHIX (from Fidelity)
    2021 $1,063.60 million (peak)
    2022 $931.54 million
    9/30/23 $779.55 million