The Not-So-Simple Truths About ETF Vs. Mutual Fund Performance Well stated, except for the assertion that "mutual funds with a load are ... not always going to show lower fee-adjusted long term performance than a comparable ETF or mutual fund without a load [and any load fund underperformance] can disappear the longer the mutual fund is held.
If one replaces "comparable" with "identical except for load", aka "all else being equal", then the long term performance (including effect of the load) must be lower for the load shares, and this difference does not disappear over time.
The first assertion, that loaded funds could perform better over the long term even accounting for load is just the usual handwaving that fund A might do better than fund B even though fund A costs more. Sure, but not likely, especially if one assume "all else is equal."
The second assertion that the underperformance of loaded funds gradually diminishes over time is a misrepresentation of arithmetic. If you buy a fund with a 5% load, then, all else being equal, it will underperform a comparable fund by 5% over the first year, but just 1%/year over five years. It's not that it is catching up, it's just that you're amortizing the underperformance over more years. After 5 years, you've still got 5% less money with the load fund; after 10 years you've still got 5% less, and so on.
A capital gains tax hike might sink stocks. Here’s how financial advisers and their clients can sta The current "opinion" is that capital gains hikes, if passed, would be retroactive, would apply to people making $500,000 or more. Supposedly step up in basis will only apply to $1,000,000 transactions.
Doubt many folks here will be affected if that is true, although it may prompt some selling. But if it is retroactive, it is too late.
I think the step up in basis is far more likely to hit the middle class, as baby boomers inherit the greatest generation's equity accounts.
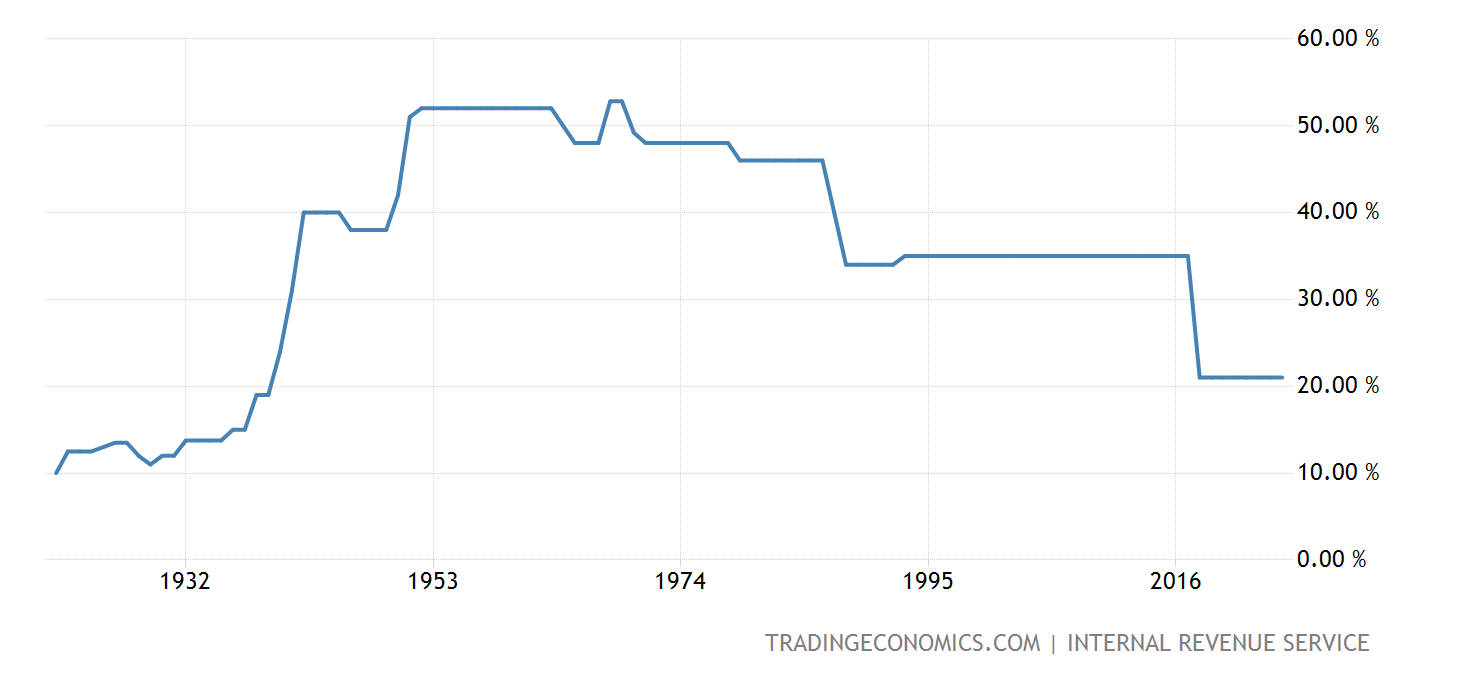
The four-decade decline in global corporate tax rates This could be another case where an inflection point has been reached and the ocean liner is ready to change course. It feels to me like the odds of this happening are higher now than they have been in several decades.....
Governments worldwide are desperate to raise extra revenue to rebuild their pandemic-ravaged economies and corporate taxation is becoming an obvious target after decades of decline.

A somewhat longer view......United States Federal Corporate Tax Rate1909-2021:
Link:
The four-decade decline in global corporate tax rates
REAL ESTATE, selling home A couple more regional differences. In some parts of the US, attorneys are typically used to review the paperwork. In other parts of the country, real estate agents handle this. In my limited experience, the quality of service is poor either way.
My last purchase was handled by a RE legal firm. Some matter concerning dollars (taxes, perhaps?) was not computed correctly. I told my lawyers that the figures were wrong and the response was: don't worry, we'll fix that up at the closing. At the closing, they attempted to proceed as if everything were fine until I interrupted. In real time, lawyers from both sides huddled in private for the better part of an hour before coming back with adjusted figures. Still wrong, but closer and not worth my effort to deconstruct further.
A different property sale in another part of the country had real estate agents handling the paperwork. Because of circumstances suggesting I might have had an ownership interest in the property being sold (I didn't), they insisted that I co-sign the grant ("normal") deed that the seller was signing. That was problematic because the deed required me to attest that I had an interest in the property, which wasn't true.
I offered to sign a
quitclaim deed (relinquishing any rights I might have had), something designed for this very situation. But the agents deemed this unacceptable. They were wrong, but as in the first situation, it wasn't worth pressing further.
The other regional difference that came to mind is whether purchases are paid for via mortgages or promissory notes coupled with deeds of trust.
Some states are "mortgage states" that do not use deeds of trust. In other states, state law requires the use of a deed of trust whenever the buyer is borrowing some or all of the money needed to finance their purchase of real estate. In approximately 15 states, either a mortgage or a deed of trust may be used to secure the lender's interest in a real property transaction.
https://www.legalnature.com/guides/understanding-when-and-how-to-use-a-deed-of-trust
REAL ESTATE, selling home Thank you all for the replies!
We're going to go with a $500 fixed fee, MLS listing and forego the selling agent. I believe this allows us more control over the potential sale. I'm also concerned that even if I receive an offer I will not emotionally be able to go thru with it..and then would have to compensate a selling agent for doing next to nothing. I'm also not sure that is a bad thing because I anticipate tremendous inflation coming soon that is NOT transitionary and the house could continue to inflate price wise...but of course I could be way wrong?
No hurry to sell the home, will use our RE attorney regardless to review contracts, etc.
Baseball Fan
Remembering Charles de Vaulx
Different Kind of Farming - Robotic
Credit Suisse Investors / Harris Associates Target Board Over Archegos ... “Top shareholders said they would vote against re-electing key Credit Suisse Group AG board members, a broadside against the bank’s leadership following a $5.5 billion loss from hedge fund Archegos Capital Management.
“At the bank’s annual meeting this Friday, Harris Associates* and Norges Bank Investment Management said they would vote against the reappointment of Andreas Gottschling, chairman of the bank’s risk committee. Mr. Gottschling joined the board in 2017 from the top risk job at Austria’s Erste Group Bank AG.
“David Herro, a partner at Harris Associates with a roughly 8% stake in Credit Suisse, said he would vote against Mr. Gottschling because he was the director in charge of risk.
“Norges, an arm of Norway’s central bank that runs its sovereign oil fund, owns around 3% of Credit Suisse. It said it would also oppose re-electing the lead independent director Severin Schwan, who is chief executive at Roche Holding AG , and Richard Meddings, a veteran British banker who joined the board last year ... Under Swiss rules, more than half of voting shares must go against a Director to block re-election.”
From: The Wall Street Journal - April 27, 2021 - Reported by Margot Patrick
* Since Harris Associates operates the Oakmark Funds, I’ve elected to include this under fund discussions.
When to take Social Security My current thinking is to wait until age 70. That gives me 5 years (age 65 to age 70) to convert tIRA money to a Roth without having SS push me into a higher tax bracket. (Before age 65, my conversions are limited because I am on ACA).
As Kings53 said - 15% of your SS will be tax free, so it pays to make that as big as possible. For some, that tax free portion will be higher.
As one data point, my FIL waited until 70 to collect - he’s 97 now. His checks haven’t kept up with his personal inflation but we are certainly glad they are not 30% less.
Market Cap Quirks And Rolling Bubbles Ya
@carew38. I remember the late 70s, early 80s...punks worked at grocery stores bagging and in union making $12+ gazebos an hour, then load trucks for UPS part time making $1
5 + an hour...do the math, you could do real well with no college back then... now, hmm.
Best
Baseball Fan
Market Cap Quirks And Rolling Bubbles 1979 was also the peak year for manufacturing employment . Anecdote from 1979: a classmate from high school was working as a Pepsi teamster driving trucks that summer. His pay was $9 per hour, when the minimum wage was $3.35 hourly. $9 is still higher than our Federal Minimum Wage. Of course, it helped that his father worked for Pepsi as well !
Remembering Charles de Vaulx
The Global Chip Shortage Just moved into a new home over the past month...when going thru my "stuff", I found notebooks and literature from seminars, presentations from industry conferences from the mid-90's. I worked leading an OEM sales team selling to the Semicon "tool" mfg's (a tool might be a 200 or 300mm CMP machine) such as Applied Materials etc. I distinctly remember in the late 90's parking 3 blocks down a side street when visiting AMATs corp site in Sunnyvale as there was no parking in their lots, too full, too busy. Tons of highly paid, talented associates working there.
Absolutely amazing to me when I looked where the tools were being sold and where the market share was then compared to now. Crazy how much semi business has been sent overseas in the last 20-25 years. Absolutely crazy. No really. It is insane!
And now we sell weed, raise taxes, build casinos, hand out fee monies because all the good jobs were exported. Dang!
Baseball Fan
The Global Chip Shortage For those who might be interested ADRE (Invesco BLDRS Emerging Markets 50 ADR) holds a 20.9% position in TSM.
REAL ESTATE, selling home Related thread I started back Nov 2020 when I sold my home. Yes, an agent is probably a necessity, but that doesn't mean you can't shop for the best value. It is a seller market and inventory is scarce...that should help you set the terms.
My agent split a 4 % commission with the buyer's agent. They list and manage all of the offers and there will be multiple offers.
I will say my 36 year old house was move in ready. I spent 3 months preparing the house for sale. It sold in one week...over asking. A good realtor will guide you through the process and maximize your profit.
https://mutualfundobserver.com/discuss/discussion/57098/your-home-is-not-an-investment#latest
REAL ESTATE, selling home Greetings,
Curious as to the class' life experience in selling a home. Wife and I are getting ready to sell our wonderful home after 25 years...
Have found out that real estate agents are generally not worth their comission fees. None of them will help you find a home unless your budget is over a 1.5M. Then they will chauffeur you house to house to look at them. Otherwise you surf the net or they take your email and put you on an auto email with all the beat up overpriced crap homes on them, waste your time and then they unlock the door for you and walk thru the home like they are experts. Sheet.
They have this game they play, called comps. Called the shall we say Orange Fish agent, showed me chart how he gets 99% of ask price then tells me based on comps your house is worth xyz. I say really. You can't find another home for sale in my neighborhood of over 300 homes. The one's that have sold have sold in a day and sold for $10k over ask. What do I care what a home sold for 10 months ago. Can you sell me SPY ETF at the price it was 10 months ago? No, then why the freak should I go to market with an old price? I told him no wonder you gave me the 99% figure. You are selling me on my selling my home under it's current value so you can sell my house in a weekend and move onto another sucker. Then he starts telling me what I should fix up on my home as with an FHA loan you will get a high degree of inspection, don't want to fail that. Told him go freak himself, I'm not going to add onto this housing charade by selling my home to someone who can only put 3.5% down and leverage himself to the hilt. Told him this conversation is over, you can leave now, don't let the door hit you on the arse on the way out, bye bye.
What has been your experience and apologies if this should be in off topic etc
Baseball Fan
Market Cap Quirks And Rolling Bubbles
A capital gains tax hike might sink stocks. Here’s how financial advisers and their clients can sta "The soon-to-be-announced tax hike will treat those investment gains as wages for top earners and applies only to about 500,000 households, according to Brian Deese, who runs Biden's policy-writing National Economic Council."
***************************
And when will the SS cap be removed??????????? Shit.......