
It looks like you're new here. If you want to get involved, click one of these buttons!
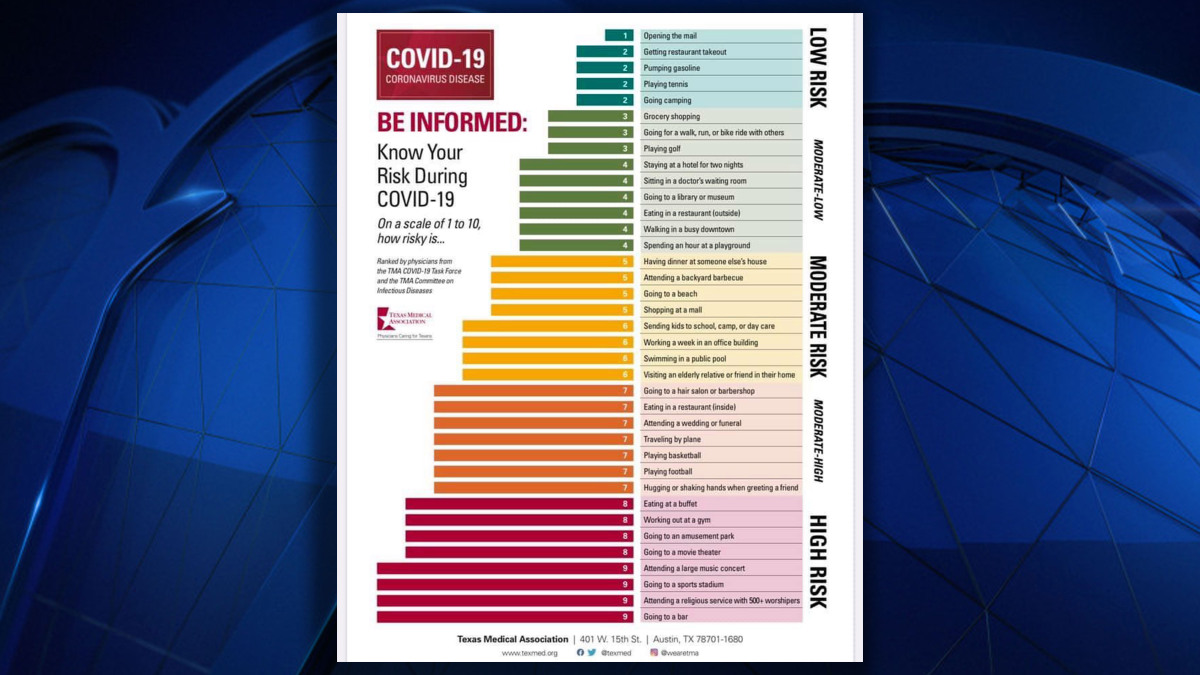
One is low, ten is high on this scale....The Texas Medical Association has released a chart explaining which behaviors put you at risk of getting the new coronavirus.
© 2015 Mutual Fund Observer. All rights reserved.
© 2015 Mutual Fund Observer. All rights reserved. Powered by Vanilla
Comments
Many large hospitals are at full capacities with their ICUs. Let's hope they have learned how New York found better treatment and medications beyond ventilator in order to reduce their fatality rates.
From the Texas Medical Association website: (bold emphasis mine)
Interesting & equally concerning is what it doesn't cover: risk assessment for the employees working at any of these places (except "Working a week in an office building").
these activities are following currently
recommended safety protocols when
possible
@zenbrew, you are probably right, but still not clear to me if they mean scientific protocols that doctors have known since early on or the Texas' political leaders interpretation of science. Texas only started telling people to wear masks on July 3rd, more than 3 months after NY for example.
In any case, interesting chart.
I would still assume the former. Most medical associations have been against some of the more reckless political policies enacted. While I have seen some pretty stupid posts by individual physicians at different medical forums, I'm not aware of state associations positioning that way. Though as I say that, this chart leaves off the risk for all of the workers that have to return to these work places. Seems like that would be kind of important. That omission is most probably political.
It's All on the margin people. Dammit, we really don't have time for the Pelikan bs.
It's all 'in relation ' to each other and other metrics.
Folks, I want to go to my favorite watering hole and have a couple of cocktail la.
And it's the worst place to go.
R
On a side note, another Covid Risk chart, to give you something to think about this morning...and maybe elicit a chuckle or guffaw as well.
https://imgs.xkcd.com/comics/covid_risk_chart_2x.png
OSHA Worker Exposure Risk to COVID-19
My two favorites are "Setting off fireworks in a stranger's car" and "Racing a scooter through a hospital with a mask over your eyes".
Monty Python would approve.
Not that mathematical, Derf
95th percentile of what? I'm not aware of covid-19 risk being expressed in percentiles.
FWIW, this explains the difference between percentages & percentiles from DifferenceBetween.net
I like this interactive risk calculator from Mathematica because it includes factors such as where you live, medical conditions, others in the household, & behaviors (which can be modified). But no calculator results are absolute.
19 and Me: COVID-19 Risk Score Calculator
Thanks- OJ
Thanks All, Derf
That's why I like "COVID-19 Risk Score Calculator", because you can factor multiple variables to assess risk & even change some of those variables to see what happens. It would be good if they added another variable which asked whether others you are around when out of the house are adhering to the safety guidelines outlined or not as well.
"Risk Score between 0 and 100, with 100 representing the highest possible risk."
It says that the "average risk score of the following 966 jobs is 30.2" Not the median. That's ascribing some significance to the numeric values that goes beyond "relative" (bigger or smaller).
The numbers have to have some quantitative meaning, because they're being used to normalize (make comparable) three different factors: "We assigned each attribute an equal weight, then aggregated them". That is, they scored each attribute, perhaps on the same 0 to 100 scale, then averaged. (Equivalently, they scored each attribute on a scale of 0 to 33⅓ and added.)
M* uses three factors in its performance (or risk) ratings: 3 year, 5 year, and 10 year figures. It weights them equally, but because each encompasses the previous one (the last five years includes the last three) it overweights more recent data. This is by design.
The factors used in the graphic here may have similar overlap: when one has contact with others, one is in close proximity to others which in turn is a way to be exposed to a potentially hazardous condition (albeit with less probability than being exposed to someone who is known to have tested positive).
It's a fun graphic that's moderately informative, but I wouldn't place much stock in quant analysts (2.9) being at more risk than economists (1.5). Or that working at math (mathematicians 4.3) is safer than working at applied statistics (actuaries 5.2) or statistics (statisticians 6.7).
If you're with another person being chased by a bear (and you've both decided to each fend for themselves), then it wouldn't actually matter how fast you could run (which percentile you ranked regarding speed, just that you could outrun the other person)- unless of course, there were two bears- then you would have to be faster than the bears- & good luck with that.
While there are several calculators for Covid risk out there, none are absolute in their values.
I'm not a statistician so maybe someone better qualified can add to this.
I'm used to working with percentiles regarding lab test results. For example using a bell shaped curve distribution where 97-99% of people that have a particular lab value (either above or below or within a certain range) either have or do not have a certain disease or are or are not adequately being treated. The tricky part comes when someone falls outside these numbers (in the 1-3% percentiles above or below) & clinically they are not where one would expect based on these numbers.
To me, information is important if it can potentially direct action- that wouldn't matter if it was medical, financial, investing, etc. It's real easy in the age of internet, to be information overloaded. And that's in the best of circumstances & data isn't being manipulated.
As Mark Twain has incorrectly been attributed to saying- "There are lies, damn lies, & statistics."
In medicine, for quite a long time, there has been a push for evidence-based medicine that one can actually use. And even these aren't absolute.
Two databases I look at are: U.S. Preventive Services Task Force & POEM (Patient-Oriented Evidence that Matters). It's not unusual for their findings to be either inconclusive or change over time as well. It's best evidence at the time.
One of the values of the real-time data coming out regarding Covid-19 is that it shows to the general population how imprecise medicine is & the process on how it evolves. Already the sickest patients are having better outcomes due to better treatments which is why we are perhaps seeing fewer deaths relative to the number of positive cases.
In any case, to me, the value of the occupation cart is the assessment of relative risk of different occupations & the income disparities related to these jobs & showing which people are going to need the most support through the crisis.