Howdy, Stranger!

It looks like you're new here. If you want to get involved, click one of these buttons!
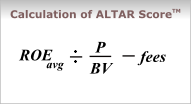
In this Discussion

Here's a statement of the obvious: The opinions expressed here are those of the participants, not those of the Mutual Fund Observer. We cannot vouch for the accuracy or appropriateness of any of it, though we do encourage civility and good humor.

    Support MFO

  • Donate through PayPal

Anyone using etfrc.com? Compares ETFs for overlapping holdings

edited May 2023 in Other Investing
I found it because I was looking for a tool to compare the overlapping holdings of funds. And they do have a free tool that allows you to do that: https://www.etfrc.com/funds/overlap.php

Sure would be cool if that overlap feature could be added to observer premium. Anybody know of a free one for mutual funds?

Second question concerns their ALTAR Score™.
For equities, we calculate the ALTAR Score™ using the formula on the right—itself a derivation of the old Dividend Discount Model—where:

Avg. ROE is the average return on equity of firms in the fund for the five (5) years up to and including the current forecast year
P/BV is the forward price-to-book value based on current market prices
fees is the annual expense ratio of the ETF

The relationship between Return on Equity and Price-to-Book Value multiples is well established in the academic literature. This formula is designed to forecast the likely internal rate of return to business owners. It is important to note that it is not a target price, and there are no timing or momentum components to it.
Here is the graphic they mention . . .

image

This well out of my wheel house, so I am interested to hear what others think of the ALTAR scoring.

Comments

  • Thanks for sharing this site WABAC.
  • Thanks for sharing this site WABAC.

    De nada.
  • The overlap tool is useful.

    I tried to find one for mutual funds but on google the only ones that popped up where either foreign site for funds in other countries, or funds in same family.

    too bad M* has abandoned individual investors
  • SPY vs SCHD analysis looks interesting and useful !
  • edited May 2023
    Thanks @WABC. I find that DIVI and MOTI have a 42% overlap, way more duplication than I had thought. Further looking shows only 6% of AUM in the two funds constitute overlap, so less duplication than suggested by just toting up the number of stocks shared.
  • edited May 2023
    Your local library system may provide access to Morningstar Investment Research Center (MIRC).
    MIRC made available via my library includes Portfolio X-Ray.
    Portfolio X-Ray shows how the top 50 net stock holdings are distributed across a portfolio
    and can be used to check duplicate holdings between two or more funds.
    This tool may not list all duplicate stocks since only the top 50 holdings are displayed.
    I'm not aware of any free tools which will list all duplicate holdings.

  • Thank you @WABAC. Interesting and useful.
  • I'm glad to hear people are enjoying the link.
  • Cool site, thanks for sharing. Getting underlying holdings for ETFs is harder than it seems, even though its public data!
  • @ProtonAnalyst33, you can get all holdings here https://www.etf.com/etfanalytics/etf-finder but it ain't elegant. Click View All under Top Ten Holdings.
Sign In or Register to comment.