
Originally published in June 1, 2013 Commentary
One of the most frequent requests we receive is for the reconstruction of FundAlarm’s signature “most alarming funds” database. Up until now, we haven’t done anything like it. There are two reasons: (1) Snowball lacked both the time and the competence even to attempt it and (2) the ratings themselves lacked evidence of predictive validity. That is, we couldn’t prove that an “Honor Roll” fund was any likelier to do well in the future than one not on the honor roll.
We have now budged on the matter. In the spirit of those beloved fund ratings, MFO will maintain a new system to highlight funds that have delivered superior absolute returns while minimizing down side volatility. We’re making the change for two reasons. (1) Associate editor Charles Boccadoro, a recently-retired aerospace engineer, does have the time and competence. And, beyond that, a delight in making sense of data. And (2) there is some evidence that risk persists even if returns don’t. That is, managers who’ve taken silly, out-sized, improvident risks in the past will tend to do so in the future. We think of it as a variant of the old adage, “beauty is just skin-deep, but ugly goes all the way to the bone.”
There are two ways of explaining what we’re up to. We think of them as “the mom and pop explanation” and the “Dr. Mom and Ph.D. Pop explanation.” We’ll start with the M&P version, which should be enough for most of us.
Dear Mom and Pop,
Many risk measures look at the volatility or bounciness of a portfolio, both on the upside and the downside. As it turns out, investors don’t mind having funds that outperform their peers in rising markets; that is, they don’t immediately reject upside volatility. What they (we!) dread are excessive drawdowns: that is, having their returns go down far and hard. What Charles has done is to analyze the performance of more than 7000 funds for periods ranging back 20 years. He’s calculated seven different measures of risk for each of those funds and has assigned every fund into one of five risk groups from “very conservative” funds which typically absorb no more than 20% of a stock market decline to “very aggressive” ones which absorb more than 125% of the fall. We’ve assembled those in a large spreadsheet which is on its way to becoming a large, easily searchable database.
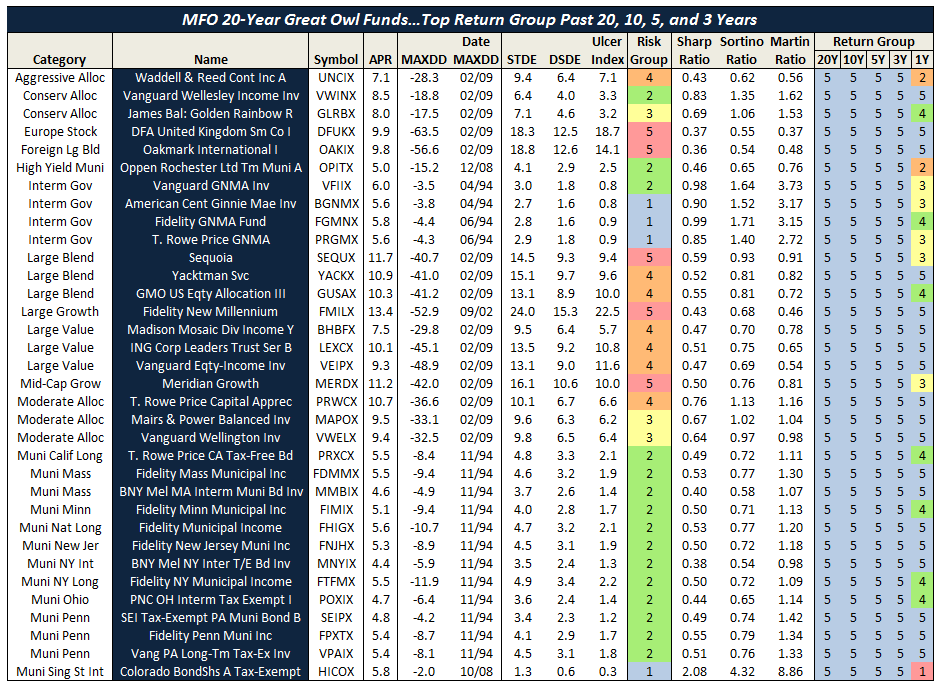
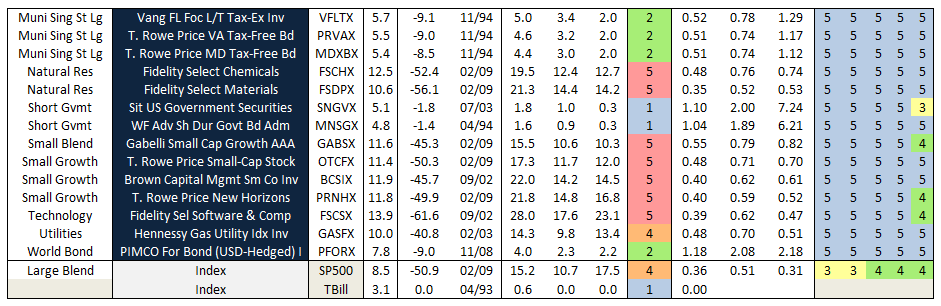
For now, we’ve got a preview. It focuses on the funds with the most consistently excellent 20-year returns (the happy blue boxes on the right hand side, under “return group”), lets you see how much risk you had to absorb to achieve those returns (the blue to angry red boxes under risk group) and the various statistical measures of riskiness. In general, you’d like to see low numbers in the columns to the left of the risk group and high numbers in the columns to the right.
I miss the dog. My roommate is crazy. The pizza has been good. I think the rash is mostly gone but it’s hard to see back there. I’m broke. Say “hi” to gramma. Send money soon.
Love, your son,
Dave
And now back to the data and the serious explanation from Charles:
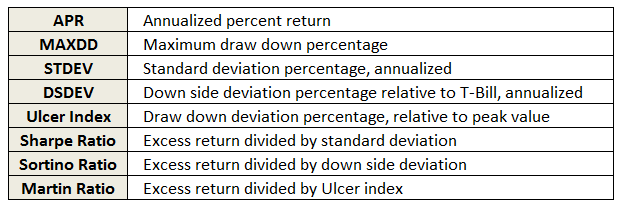
The key rating metric in our system is Martin ratio, which measures excess return divided by the drawdown (a/k/a Ulcer) index. Excess return is how much a fund delivers above the 90-day Treasury bill rate. Ulcer index measures depth and duration of drawdowns from recent peaks – a very direct gauge of unpleasant performance. (More detailed descriptions can be found at Ulcer Index and A Look at Risk Adjusted Returns.)
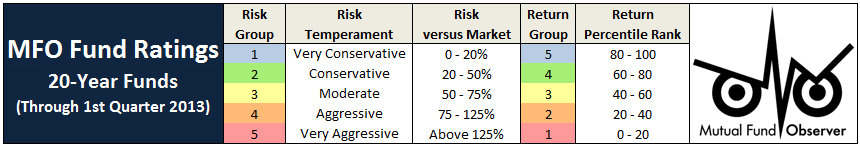
The rating system hierarchy is first by evaluation period, then investment category, and then by relative return. The evaluation periods are 20, 10, 5, 3, and 1 years. The categories are by Morningstar investment style (e.g., large blend). Within each category, funds are ranked based on Martin ratio. Those in the top 20 percentile are placed in return group 5, while those in bottom 20 percentile are in return group 1. Fund ratings are tabulated along with attendant performance and risk metrics, by age group, then category, then return group, and finally by absolute return.
MFO “Great Owl” designations are assigned to consistent top performers within the 20 and 10 year groups, and “Aspiring Great Owl” designations are similarly assigned within the 5 and 3 year groups.
The following fund performance and risk metrics are tabulated over each evaluation period:
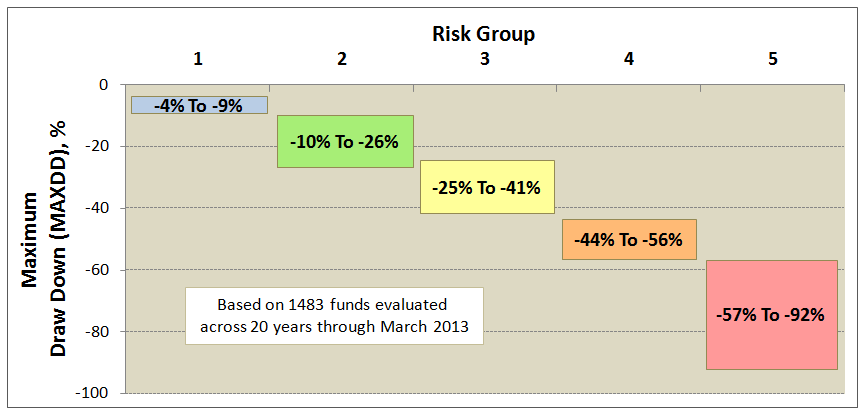
A risk group is also tabulated for each fund, based simply on its risk metrics relative to SP500. Funds less than 20% of market are placed in risk group 1, while those greater than 125% are placed in risk group 5. This table shows sample maximum drawdowns by risk group, depicting average to worst case levels.
Some qualifications:
- The system includes oldest share class only and excludes the following categories: money market, bear market, trading inverse and leveraged, volatility, and specialized commodities.
- The system does not account for category drift.
- Returns reflect maximum front load, if applicable.
- Funds are presented only once based on age group, but the return rankings reflect all funds existing. For example, if a 3 year fund scores a 5 return, it did so against all existing funds over the 3 year period, not just the 3 year olds.
- All calculations are made with Microsoft’s Excel using monthly total returns from the Morningstar database provided in Steele Mutual Fund Expert.
- The ratings are based strictly on historical returns.
- The ratings will be updated quarterly.
We will roll-out the new system over the next month or two. Here’s a short preview showing the MFO 20-year Great Owl funds – there are only 48, or just about 3% of all funds 20 years and older.
31 May 2013/Charles
(p.s., the term “Great Owl” funds is negotiable. We’re looking for something snazzy and – for the bad funds – snarky. “Owl Chow funds”? If you’re a words person and have suggestions, we’d love to hear them. Heck, we’d love to have an excuse to trick Barb into designing an MFO t-shirt and sending it to you. David)