
 Originally published in June 1, 2014 Commentary
Question: How many funds at Dodge & Cox beat their category average returns since inception?
Answer: All of them.
In the case of Dodge & Cox, “all” is five funds: DODBX, DODFX, DODGX, DODIX, and DODWX. Since inception, or at least as far back as January 1962, through March 2014, each has beaten its category average.
Same is true for these families: First Eagle, Causeway, Marsico, and Westwood.
For purposes of this article, a “fund family” comprises five funds or more, oldest share class only, with each fund being three years or older.
Obviously, no single metric should be used or misused to select a fund. In this case, fund lifetimes are different. Funds can perform inconsistently across market cycles. Share class representing “oldest” can be different. Survivorship bias and category drift can distort findings. Funds can be mis-categorized or just hard to categorize, making comparisons less meaningful.
Finally, metrics based on historical performance may say nothing of future returns, which is why analysis houses (e.g., Morningstar) examine additional factors, like shareholder friendliness, experience, and strategy to identify “funds with the highest potential of success.”
In the case of Marsico, for example, its six funds have struggled recently. The family charges above average expense ratios, and it has lost some experienced fund managers and analysts. While Morningstar acknowledges strong fund performance within this family since inception, it gives Marsico a negative “Parent” rating.
Nonetheless, these disclaimers acknowledged, prudent investors should know, as part of their due diligence, how well a fund family has performed over the long haul.
So, question: How many funds at Pacific Life beat category average returns since inception?
Applying the same criteria as above, the sad truth is: None of them.
PL funds are managed by Pacific Life Fund Advisors LLC, a wholly owned subsidiary of Pacific Life Insurance Company of Newport Beach, CA. Here from their web-site:

Got that?
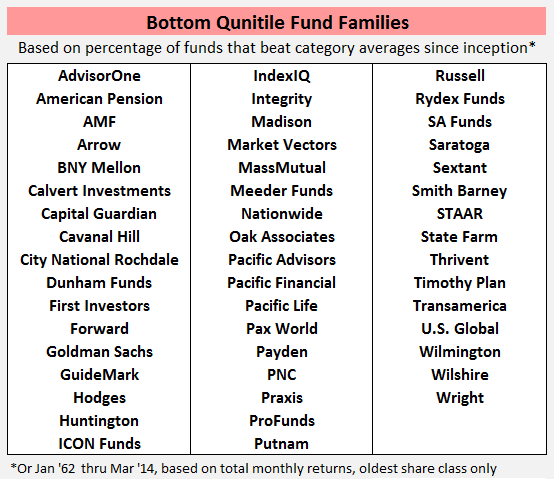
Same sad truth for these families: AdvisorOne, Praxis, Integrity, Oak Associates, Arrow Funds, Pacific Financial, and STAAR.
In the case of Oak Associates, its seven funds have underperformed against their categories by 2.4% every year for almost 15 years! (They also experience maximum drawdown of -70.0% on average, or 13.1% worse than their categories.) Yet it proudly advertises recent ranking recognition by US News and selection to Charles Schwab’s OneSource. Its motto: “A Focus on Growth.”
To be clear, my colleague Professor Snowball has written often about the difficulties of beating benchmark indices for those funds that actually try. The headwinds include expense ratios, loads, transaction fees, commissions, and redemption demands. But the lifetime over- and under-performance noted above are against category averages of total returns, which already reflect these headwinds.
Overview. Before presenting performance results for all fund families, here’s is an overall summary, which will put some of the subsequent metrics in context:
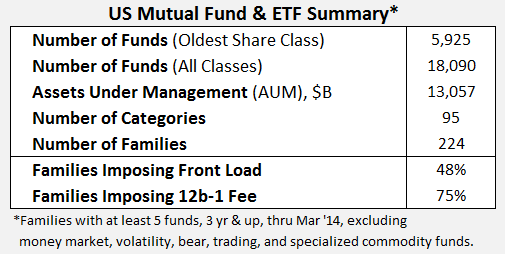
It remains discouraging to see half the families still impose front load, at least for some share classes – an indefensible and ultimately shareholder unfriendly practice. Three quarters of families still charge shareholders a 12b-1 fee. All told shareholders pay fund families $12.3 billion every year for marketing. As David likes to point out, there are more funds in the US today than there are publically traded US companies. Somebody must pay to get the word out.
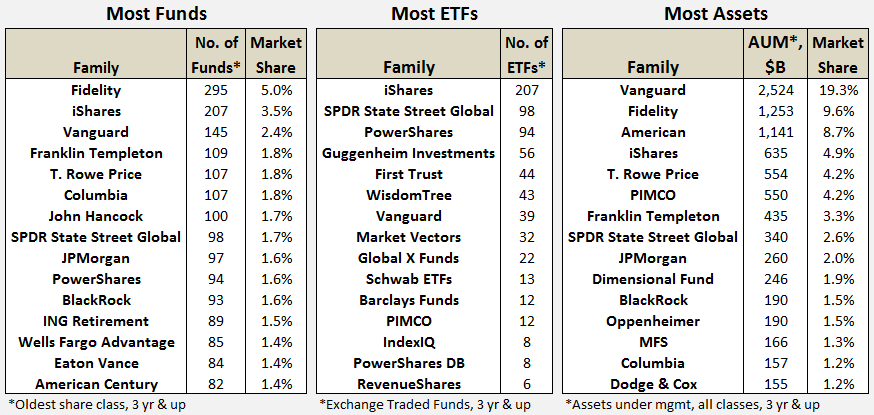
Size. Fidelity has the most number of funds. iShares has the most ETFs. But Vanguard has the largest assets under management.
Expense. In last month’s MFO commentary, Edward Studzinski asked: “It Costs How Much?”
As a group, fund families charge shareholders $83.3 billion each year for management fees and operating costs, which fall under the heading “expense ratio.” ER includes marketing fees, but excludes transaction fees, loads, and redemption fees.
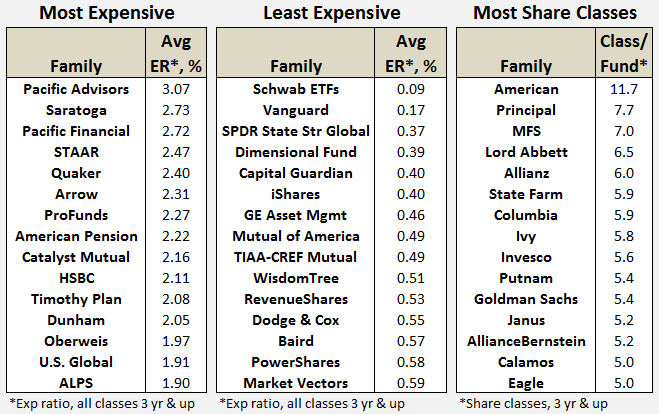
It turns out that no fund family with an average ER above 1.58% ranks in the top performance quintile, as defined below, and most families with an average ER above 2.00 end up in the bottom quintile.
While share class does not get written about very often, it helps reveal inequitable treatment of shareholders for investing in the same fund. Typically, different share classes charge different ERs depending on initial investment amount, load or transaction fee, or association of some form. American has the largest number of share classes per fund with nearly five times the industry average.
Rankings. The following tables summarize top and bottom performing families, based on the percentage of their funds with total returns that beat category averages since inception:
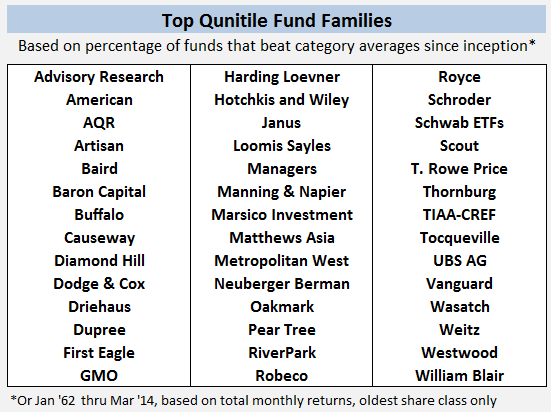
As MFO readers would expect, comparison of top and bottom quintiles reveals the following tendencies:
- Top families charge lower ER, 1.06 versus 1.45%, on average
- Fewer families in top quintile impose front loads, 21 versus 55%
- Fewer families in top quintile impose 12b-1 fees, 64 versus 88%
For this sample at least, the data also suggests:
- Top families have longer tenured managers, if slightly, 9.6 versus 8.2 years
- Top families have fewer share classes, if slightly (1.9 versus 2.3 share class ratio, after 6 sigma American is removed as an outlier; otherwise, just 2.2 versus 2.3)
The complete set of metrics, including ER, AUM, age, tenure, and rankings for each fund family, can be found in MFO Fund Family Metrics, a downloadable Google spreadsheet. (All metrics were derived from Morningstar database found in Steel Mutual Fund Expert, dated March 2014.)
A closer look at the complete fund family data also reveals the following:
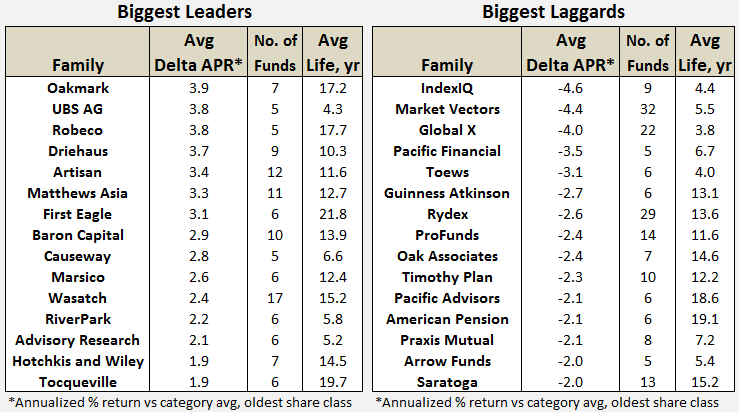
Some fund families, like Oakmark and Artisan, have beaten their category averages by 3-4% every year for more than 10 years running, which seems quite extraordinary. Whether attributed to alpha, beta, process, people, stewardship, or luck…or all the above. Quite extraordinary.
While others, frankly too many others, have done just the opposite. Honestly, it’s probably not too hard to figure out why.
31May14/Charles