
Originally published in December 1, 2015 Commentary
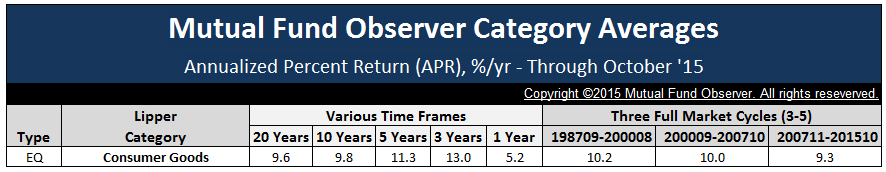
As promised, we’ve added a Category Averages tool on the MFO Premium page. Averages are presented for 144 categories across 10 time frames, including the five full market cycles period dating back to 1968. The display metrics include averages for Total Return, Annualized Percent Return (APR), Maximum Drawdown (MAXDD), MAXDD Recovery Time, Standard Deviation (STDEV, aka volatility), and MFO Risk Group ranking.
Which equity category has delivered the most consistently good return during the past three full market cycles? Consumer Goods. Nominally 10% per year. It’s also done so with considerably less volatility and drawdown than most equity categories.
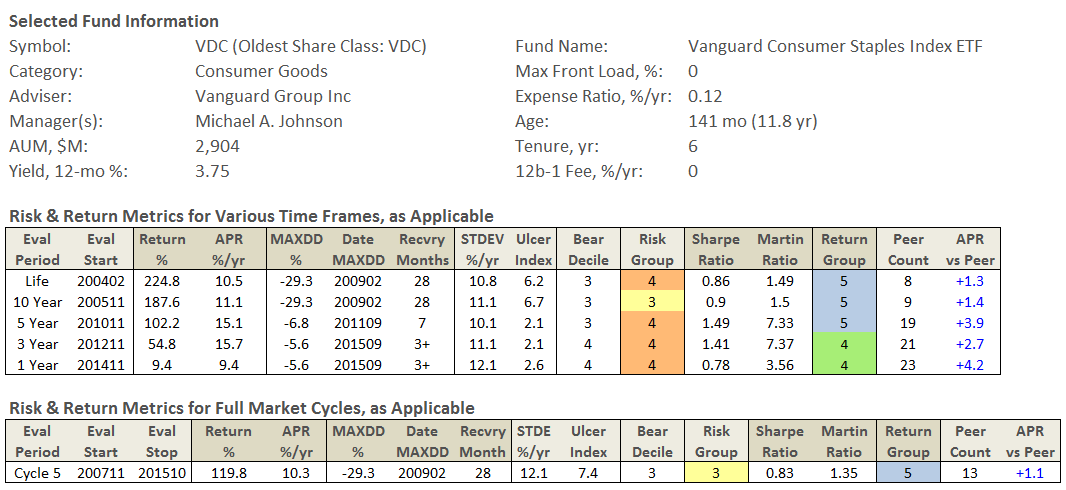
One of the lower risk established funds in this category is Vanguard Consumer Staples Index ETF VDC. (It is also available in Admiral Shares VCSAX.) Here are its risk and return numbers for various time frames:
The new tool also enables you to examine Number of Funds used to compute the averages, as well as Fund-To-Fund Variation in APR within each category.