
Here’s a chart of the 15-year cumulative excess return (that is, return above cash) of a long-short fund. Over this period, the fund generated an annualized excess return of 0.82% with an annualized standard deviation of 4.35%. The fund charges 0.66% and many advisors who sell it take a 5.75% commission off the top.
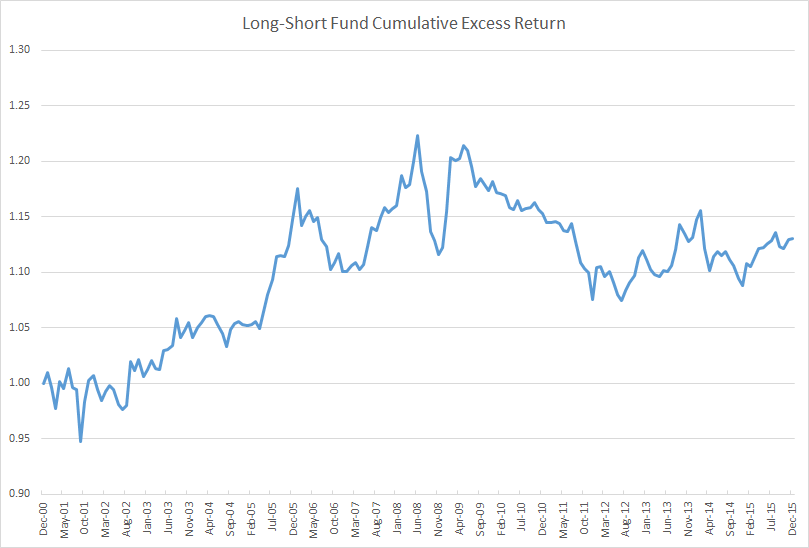
Though its best returns came during the financial crisis, making it a good diversifier, I suspect few would rush out to buy this fund. Its performance is inconsistent, its reward-to-risk ratio of 0.19 is mediocre, and its effective performance fee of 44% is comparable to that of a hedge fund. There are plenty of better-performing market-neutral or long-short funds with lower effective fees.
Despite the unremarkable record, about $140 billion is invested in a version of this strategy under the name of American Funds Growth Fund of America AGTHX. I simply subtracted the Standard & Poor’s 500 Index’s monthly total return from AGTHX’s monthly total return to create the long-short excess return track record (total return would include the return of cash).
This is an unconventional way of viewing a fund’s performance. But I think it is the right way, because, in a real sense, every active fund is a long-short strategy plus its benchmark.
Ignoring regulatory or legal hurdles, a fund manager can convert any long-only fund into a long-short fund by shorting the fund’s benchmark. He can also convert a long-short fund into a long-only fund by buying benchmark exposure on top of it (and closing out any residuals shorts). I could do the same thing to any fund I own through a futures account by overlaying or subtracting benchmark exposure.
Viewing funds this way has three major benefits. First, it allows you to visualize the timing and magnitude of a fund’s excess returns, which can alter your perception of a fund’s returns in major ways versus looking at a total return table or eyeballing a total return chart. Looking at a fund’s three-, five- and ten-year trailing returns tells you precious little about a fund’s consistency and the timing of its returns. The ten-year return contains the five-year return which contains the three-year return which contains the one-year return. (If someone says a fund’s returns are consistent, citing 3-, 5-, and 10-year returns, watch out!) Rolling period returns are a step up, but neither technique has the fidelity and elegance of simply cumulating a fund’s excess returns.
Second, it makes clear the price, historical quantity and historical quality of a fund’s active management. The “quantity” of a fund’s active management is its tracking error, or the volatility of the fund’s returns in excess of its benchmark. The “quality” of a fund’s management is its information ratio, or excess return divided by tracking error. Taking these two factors into consideration, it becomes clearer whether a fund has offered a good value or not. A fund shouldn’t automatically be branded expensive based on its expense ratio observed in isolation. I would happily give up my left pinky for the privilege of investing in Renaissance Technologies’ Medallion fund, which charges up to 5% of assets and 44% of net profits, and I would consider myself lucky.
Finally, it allows you to coherently assess alternative investments such as market-neutral funds on the same footing as long-only active managers. A depressingly common error in assessing long-short or market neutral funds is to compare their returns against the raw returns of long-only funds or benchmarks. A market neutral fund should be compared against the active component of a long-only manager’s returns.
To make these lessons concrete, let’s perform a simple case study with two funds: Vulcan Value Partners Small Cap VVPSX and Vanguard Market Neutral VMNFX. Here’s a total return chart for both funds since the Vulcan fund’s inception on December 30, 2009. (Note that Vanguard Market Neutral was co-managed by AXA Rosenberg until late 2010, after which Vanguard’s Quantitative Equity Group took full control.)
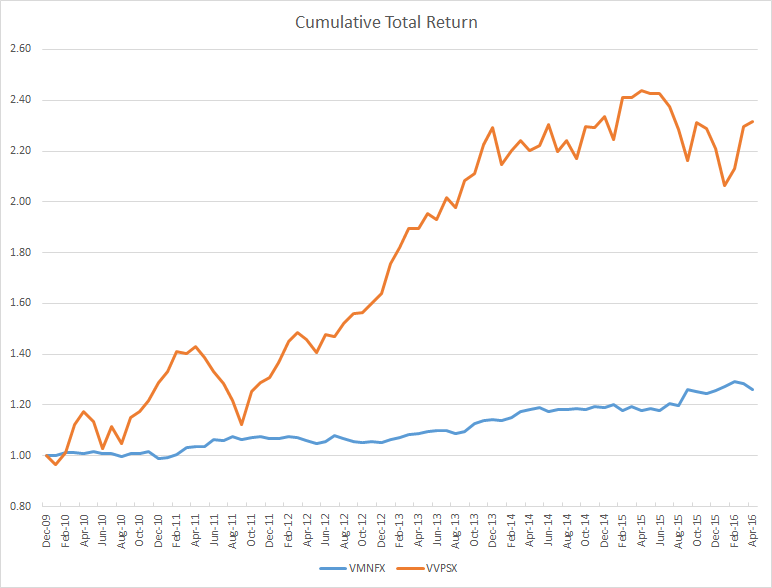
Given the choice between the two funds, which would you include in your portfolio? Over this period the Vanguard fund returned a paltry 3.7% annually and the Vulcan fund a blistering 14.2%. If you could only own one fund in your portfolio, the Vulcan fund is probably the better choice as it benefits from exposure to market risk and therefore has a much higher expected return. However, if you are looking for the fund that enhances the risk-adjusted return of portfolio, there isn’t enough information to say at this point; it is meaningless to compare a fund with market exposure with a market neutral fund on a total return basis.
A good alternative fund usually neutralizes benchmark-like exposure and leave only active, or skilled-based, returns. A fairer comparison of the two funds would strip out market exposure from Vulcan Small Cap (or, equivalently, add benchmark exposure to Vanguard Market Neutral). In the chart below, I subtracted the returns of the Vanguard Small Cap Value ETF VBR, which tracks the CRSP US Small Cap Value Index, from the Vulcan fund’s returns. While the Vulcan fund benchmarks itself against the Russell 2000 Value index, the Russell 2000 is terribly flawed and has historically lost about 1% to 2% a year to index reconstitution costs. Small-cap managers love the Russell 2000 and its variations because it is a much easier benchmark to beat. Technically, I’m also supposed to subtract the cash return (something like the 3-month T-bill or LIBOR rate) from Vanguard Market Neutral, but cash yields have effectively remained 0% over this period.
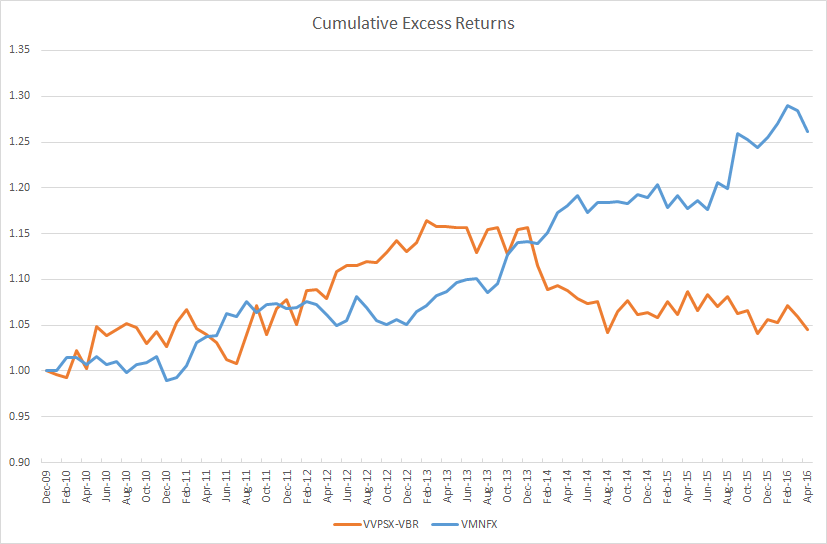
When comparing both funds simply based on their active returns, Vanguard Market Neutral Fund looks outstanding. Investors have paid a remarkably low management fee (0.25%) for strong and consistent outperformance. Even better, the fund’s outperformance was not correlated with broad market movements.
This is not to say that Vanguard has the better fund simply based on past performance. Historical quantitative analysis should supplement, not supplant, qualitative judgment. The quality of the managers and the process have to be taken into account when making a forecast of future outperformance as a fund’s past excess return is very loosely related to its future excess return. There is a short-term correlation, where high recent excess return predicts high future near-term excess return due to a momentum effect, but over longer horizons there is little evidence that high past return predicts high future return. Confusingly, low long-run excess returns predict low future returns, suggesting evidence of persistent negative skill. If a fund has historically displayed a long-term pattern of low active exposure and negative excess returns, its fees should either be extremely low or you shouldn’t own it at all.
—–
There’s a puzzle here. Imagine if Vanguard Market Neutral’s managers simply overlaid static market exposure on their fund. Here’s how their fund would have performed.
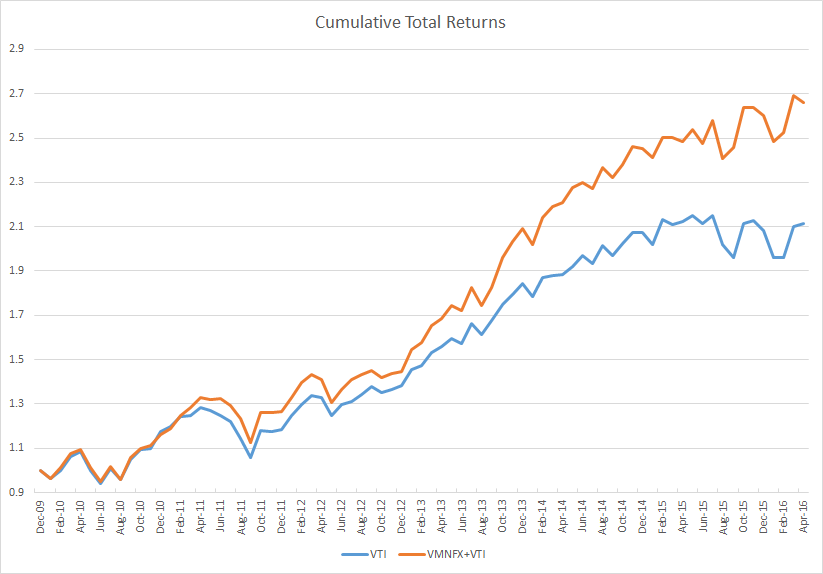
A long-only fund that has beaten the market by 3.7% a year with minimal downside tracking error over five years would easily attract billions of dollars. But here Vanguard is, wallowing is relative obscurity, despite having remarkably low absolute and relative costs.
Why is this? In theory, the price of active management—in whatever form—should tend to equalize in a competitive market. However, what we see is that long-only active management tends to dominate and is often wildly expensive relative to the true exposures offered, and long-short active management tends to often repackage market beta and overcharge for it, creating pockets of outstanding value among strategies that are truly market neutral and highly active.
I think three forces are at work:
- Investors do not adjust a fund’s returns for its beta exposures. A high return fund, even if it’s almost from beta, tends to attract assets despite extremely high fees for the actively managed portion.
- Investors focus on absolute expense ratios, often ignoring the level of active exposure obtained.
- Investors are uncomfortable with unconventional strategies that use leverage and derivatives and incur high tracking error.
Given these facts, a profit-maximizing fund company will be most rewarded by offering up closet index funds. Alternative managers will offer up market beta in a different form. Active managers that offer truly market neutral exposure will be punished due to their unconventionality and comparisons against forms of active management where beta exposures are baked into the track record.
Investment Implications
When choosing among active strategies, all sources of excess return should be on a level playing field. There is no reason to compare long-only active managers against other long-only active managers. Your portfolio doesn’t care where it gets its excess returns from and neither should you.
However, because investors tend to anchor heavily on absolute expense ratios, the price of active management offered in a long-only format tends to be much more expensive per unit of exposure than in a long-short format. An efficient way to obtain active management while keeping tracking error in check is to construct a barbell of low-cost benchmark-like funds and higher-cost alternative funds.