
Originally published in July 1, 2013 Commentary
The Healthy Debate. In Professor David Aronson’s 2006 book, entitled “Evidence-Based Technical Analysis,” he argues that subjective technical analysis, which is any analysis that cannot be reduced to a computer algorithm and back tested, is “not a legitimate body of knowledge but a collection of folklore resting on a flimsy foundation of anecdote and intuition.”
He further warns that falsehoods accumulate even with objective analysis and rules developed after-the-fact can lead to overblown extrapolations – fool’s gold biased by data-mining, more luck than legitimate prediction, in same category as “literate monkeys, Bible Codes, and lottery players.”
Professor Valeriy Zakamulin cites Arson’s book when examining Mebane Faber’s 2007 seminal study of a simple moving average timing strategy. Using data since 1900, Faber found the method delivers equity-like returns with bond-like volatility. But Zakamulin’s recent study concludes:
- Reported performance of these market timing strategies contains a substantial data-mining bias.
- Over a sufficiently long run there are no chances that the market timing strategy allows investors both to reduce risk and enhance returns.
In other words, just because the strategy worked in last hundred years, does not mean it will work in next hundred years. A hundred years! “There is no simple and magic formula in finance that allows you to easily beat the market in real life,” politely explains Professor Zakamulin in response to my inquiry.
But what about the “Magic Formula” investing strategy? One cannot find a simpler strategy. And it was developed by Joel Greenblatt – a professor at Columbia University.
Actually, academic and investment communities alike do seem to frown on timing strategies, often recommending a passive buy-and-hold approach instead. Many advisors discourage attempts to beat the market, since very few succeed and over time the market does pretty well – no need to try and beat it. Wiser instead to invest in low-fee index funds of risk levels commensurate with your temperament and investment time horizon.

Risk, it seems, is one of few predictors considered legitimate. Indeed, in the 1960s, Jack Treynor and Professor William Sharpe quantified how riskier investments can be expected to deliver higher returns. Then, in the 1990s, Professors Eugene Fama and Kenneth French refined the correlation to show how investments in value and small cap stocks can also be expected to deliver higher returns – but again, because of their higher inherent risk.
As for other champions of timing or trend-following as a legitimate predictor? Perhaps closest support comes from Professors Narasimhan Jegadeesh and Sheridan Titman in their studies of momentum. Basically, stocks that have done well the past few months will continue to do well for the next few months. Perhaps an uncovered inefficiency and behavioral aspect of the market? Or, a well intended but ultimately futile result of data-mining bias?
After finding ubiquitously abnormal returns generated by value and momentum, Clifford Asness with Professors Tobias Moskowitz and Lasse Pedersen simply leave the proof to the reader – its justification “a challenge for future theory and empirical work to accommodate.”
The Accessible Data. Faber references Global Financial Data (GFD) for historical returns. A subscription to GFD is available for a mere $5,000 a year, outside the reach of most individual investors. Fortunately, Professors Amit Goyal, Robert Shiller, and others maintain historical databases on freely accessible websites, which include S&P price, dividends, bond returns, 3-month T-Bill rates, and more.
Using data since 1926, just before the great depression, the following chart presents rolling 5-year returns of US market performance – a sort of big picture view. Plotted are annualized returns for cash (3 month T-Bill), bonds (long government), and stocks (SP500 total). Note that to form total return, dividends are incorporated into stock price returns prior to 1970. Returns prior to 1972 for bonds, 1970 for stocks, and 1962 for cash are from the Goyal and Shiller websites. All subsequent returns are from the Morningstar database found in Steele Mutual Fund Expert.
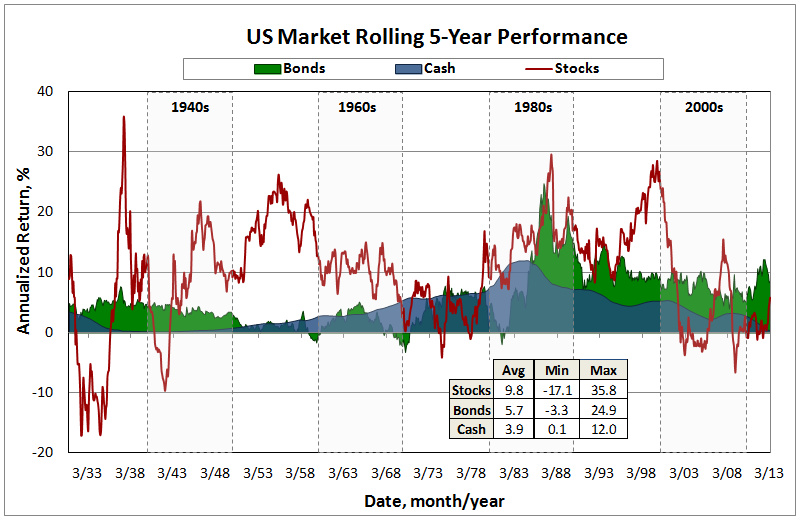
Besides the obvious volatility differences between each investment vehicle, other observations include:
- The depression years were horrible for stocks. Far worse than anything experienced since.
- The post WWII period produced two decades of exceptional stock returns. Followed by two more decades of exceptional returns in the 1980s and 1990s, a period bookended by Presidents Ronald Reagan and Bill Clinton. The recent run-up in stocks pales in comparison, so far anyway.
- Cash returns via CDs and money markets exploded in the 1980s. The current zero rate environment was last experienced in the early 1940s.
- Since 1980s, bonds have been the vehicle for consistently healthy returns, hands-down. Very recently, however, this bull has turned bearish.
The Extraordinary Results. Employing the 10-month simple moving average timing method (10-mo SMA) to these data over ten decades reveals impressive performance, reiterating the conclusion documented by Faber and delighting AKAFlack, an MFO reader who champions the strategy.
The timing method is based on monthly returns. If stock price ends the month above its 10-mo SMA, the method is all-in stocks the following month. If it is below, the method is all-in bonds. Here is a comparison of returns for timing, 60/40 fixed stocks/bonds (so-called balanced fund allocation), pure stocks, bonds, and cash strategies. Note the growth axis is logarithmic in order to get appreciation of behavior over time given the large magnitude changes involved.
An embedded tabulation summarizes for the total period of 86.4 years: annualized percent return (APR), maximum draw down percent (MAXDD), annualized standard deviation percent (STDEV), and Ulcer Index percent (UI).
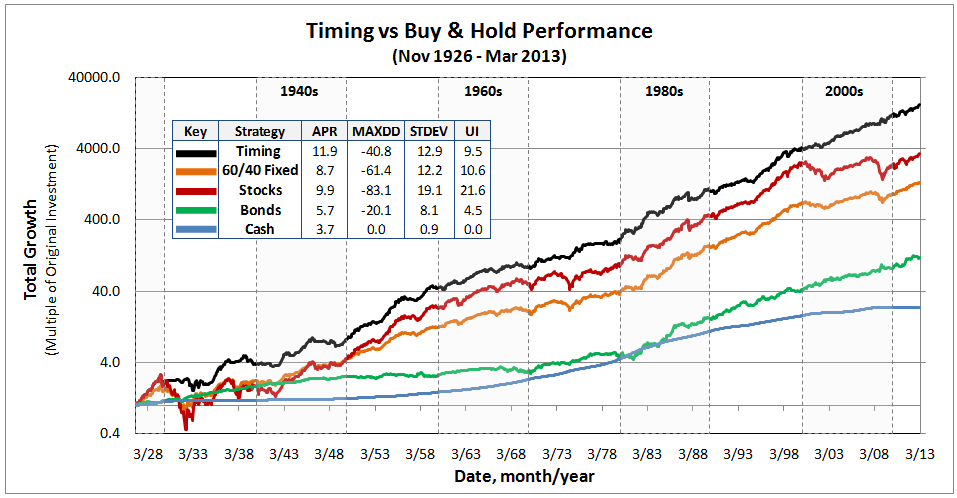
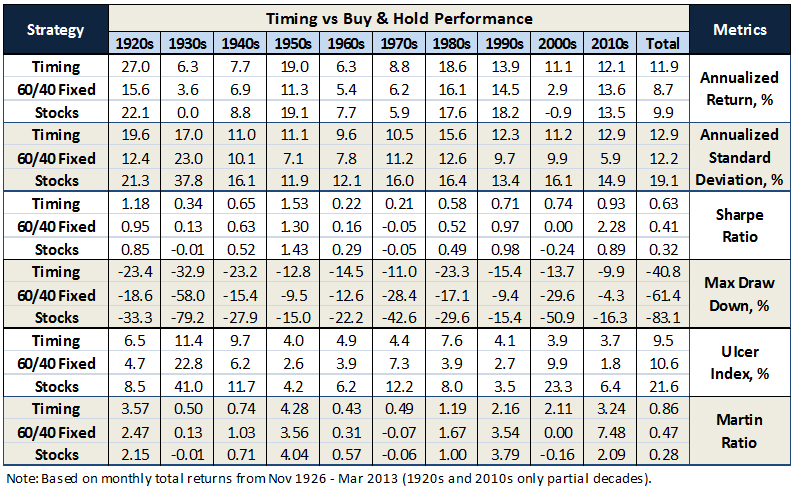
To get a sense of performance across each decade, the table below compares key metrics. Timing generally delivers higher absolute and risk adjusted returns while better mitigating draw downs than either fixed strategy of 60/40 stocks/bonds or pure stocks. Not always, of course, as seen previously in MFO Discussion 10 mo SMA Method In Down Markets. Timing’s vulnerability is sudden descents and ascents, lasting about half the averaging period, five months or less in this case. It performs strongest when the trends are extended, like during the great depression and recession.
In the recent words of Peter Martin, inventor of Ulcer Index, simple timing systems “normally regarded as having little value – actually have a much higher risk-adjusted performance than a buy-and-hold strategy…and are quite effective at avoiding long, deep draw down.”
A few other statistics for the record:
- Of the 1037 months evaluated, timing was all-in stocks 686 months, or 66% of time.
- It switched between stocks and bonds 123 times. In another words, it turned-over 12% of time.
- The average draw down at time of switching from stocks to bonds was -10.9%, while the median was -8.8%.
- Timing delivered higher returns than the 60/40 fixed strategy 78% of the 988 rolling 5-year periods examined in the database spanning ten decades.
Faber finds that trend-following delivers similarly impressive results across multiple investment vehicles. “In lots of markets,” he says, “not just one…it works in almost all of them!”
25 June 2013/Charles