It looks like you're new here. If you want to get involved, click one of these buttons!
Bad idea. Seldom this type of behavior ends well financially or academically.[1] Back when I was still daytrading futures during grad school
Well, BIV and MWTRX will get you to the same place over time...but MWTRX has an SD of 3.53 (Sharpe 1.29) versus 5.19/.89 for BIV (still a big fan of BIV when I don't want to get locked into a mutual fund). I must say FD you are quite impressive in your trading skill, no doubt about that but I do question whether you might also get to the same place just holding quality bond funds like these two and say PIMIX. You say you've had very large positions in IOFAX and I recall you jumping out before it cratered, but had you guessed wrong you would have lost significant life savings in a matter of days. I could not live with that possibility...so I'd rather make my 5% to 6% by combining PIMIX with MWTRX, which is what PV say I would have made on average since 2008.
MWTRX is a good fund but GIBLX has a better record for 1-3-5 years.
Both are not funds I use since I'm mainly a bond investor in the last several years and their past performance (6% average for 3 years) will not happen in the future.
I'm also not impressed by LT record, DODGX had a great record years ago but now it trails the "stupid" index SPY for 10 years already
BTW, I used to be at 80-90% equities until several years prior to retirement where I change gradually to more bonds.
Can you please explain your comment? Are you saying that you won't buy a fund with good performance because it can't keep up? Not sure how you can be confident that a newer fund will outperform established winners. I have substantial positions in both MWTRX and GIBLX, a very big fan of the latter.
For the average Joe investor: KISS investing
1) I believe in using up to 5 (maybe 7) funds
2) The core portion should be about 70% and use very cheap indexes, the rest may be in managed funds that have something special.
3) Hardly trade which means looking at your portfolio 1-2 times annually and make small adjustments of 1-2 funds.
With that in mind:
1) Core: I would use SPY/VTI for most of my stocks. BIV as my generic bond fund.
Explore: PRWCX, VWIAX, PIMIX.
2) Let's check MWTRX and GIBLX in the last 5 years. I don't see MWTRX as anything more/special beyond BIV but GIBLX is different enough which is why I may use it in my explore portion. See 5 yearchart.
1) I'm a flexible investor with specific goals. Making over 6% annually using mainly bond funds, be positive every year, SD < 3, never lose 3% from any last top.
2) I mainly hold very concentrated portfolio of 2-3 funds. I may own a fund, weeks or years. I held PIMIX for 6-7 years, PHMIX for 3 years, IOFIX easily over 50% in the last 3 years.
3) Even if I own a fund for years, I may sell it for days to several weeks when market conditions are extreme which is one of my goals. This is not your usual trader as someone who buys 10 stocks and keep changing them.
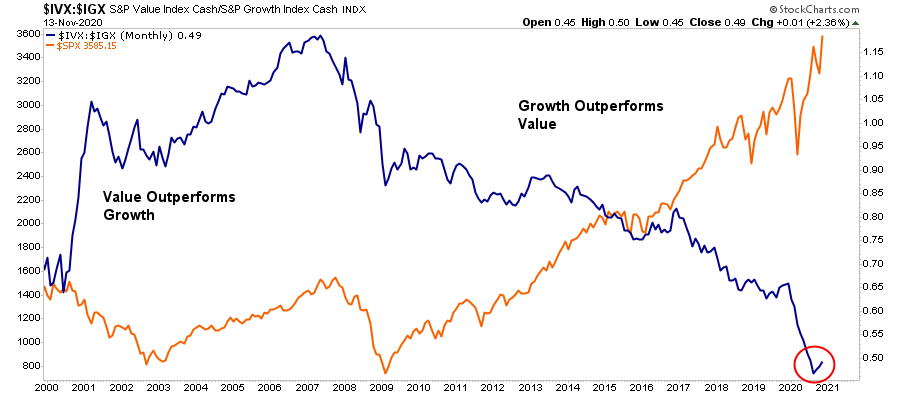
https://seekingalpha.com/article/4389100-market-breaks-out-on-vaccine-hopes-cases-surgeNotably, the rotation to "value" is likely premature as these companies specifically require a more robust economy to generate revenue and earnings growth. The current environment is not conducive to that. Expect a reversal of the trade soon, and money rotates back towards "pandemic" related companies.
For the average Joe investor: KISS investing
MWTRX is a good fund but GIBLX has a better record for 1-3-5 years.
Both are not funds I use since I'm mainly a bond investor in the last several years and their past performance (6% average for 3 years) will not happen in the future.
I'm also not impressed by LT record, DODGX had a great record years ago but now it trails the "stupid" index SPY for 10 years already
BTW, I used to be at 80-90% equities until several years prior to retirement where I change gradually to more bonds.
Can you please explain your comment? Are you saying that you won't buy a fund with good performance because it can't keep up? Not sure how you can be confident that a newer fund will outperform established winners. I have substantial positions in both MWTRX and GIBLX, a very big fan of the latter.
© 2015 Mutual Fund Observer. All rights reserved.
© 2015 Mutual Fund Observer. All rights reserved. Powered by Vanilla