Buy Sell Why: ad infinitum. I have been nibbling on bits and pieces of things that I own that are down big that day (recently a share here and there of GOOG, NVDA, LRCX, ASML, etc.). Last two days, bought a handful of shares of EW (it dropped from near $100 to $50’s yesterday), DXCM (similarly almost cut in half today), and SAIA (down $20-50 today). The first two are new positions, and tiny positions because I am a chicken haha. SAIA was an add.
Trimmed LLY down to 2 shares (should have done that $100 ago), as others are jumping on the weight loss bandwagon and will have better drugs (kind of like PFE’s Viagra was first, but later drugs were “better”). Read in a comment section on SA that a retired pharma salesman feels GLP-1s and the like will soon become like statins (basically commoditized and generic) due to their widespread health benefits. Also have added to other semi names over recent days (just a share or two at a time bc of my lack of confidence)—ARM, AMD, NVDA, etc.
In my mutual fund only account (cannot add money to this, but it’s a former 403b with current employer that migrated from Prudential to Fidelity), I have been adding in $100 increments to whatever is down. PRWCX remains my biggest holding in that account at >20%.
I’m probably too “growthy” for this current market, but then days like today happen and balances jump more. But down 5% or more in most of my/family accounts (from July peak).
BLNDX On Fire This Year Empower Personal Dashboard is a browser app, there is nothing to download to PC or Mac. It also has decent Android and iOS versions (I use both but the mobile apps are not full equivalents of browser)
https://www.empower.com/personal-investors/financial-toolshttps://www.empower.com/signup-v1If one is not going to use the account aggregation feature and use it in
100% manual mode, makes sense to remain anonymous but keep in mind that Empower requires 2FA so you can't be
100% anonymous with a disposable e-mail address (unless you have a throw-away mobile number of course!)
BLNDX On Fire This Year @MikeM,
I can absorb up to 5% loss before exiting. But I am not going to increase it which means I am going to exit sooner than latter to reduce clutter in my portfolio. I have not found the magic pill / perennial longevity fund. When rates were low (pre-Covid), it was inexpensive to run these experiments but not so much now.
Edit: Every time I start a new position, I start hoping to increase it to a minimum
10% of portfolio. Sadly, most of the times I fold them without increasing from the initial position. Oddly enough, I seem to have more luck with individual stocks than funds and I spend very little time researching stocks and almost all of the time I spend on investments is trying out new funds, which makes me wonder quite often if investment outcomes are mostly luck.
Buy Sell Why: ad infinitum. In recent weeks, we have been buying more intermediate term bonds as some equity was reduced in early summer. Think bonds present better opportunities than those of equities going forward.
PCE and core PCE data reported today indicated inflation continuing to fall by 0.1% from June. The first rate cut is expecting in September this year.
BLNDX On Fire This Year BLNDX is advertised as an "all weather" fund.
I was also somewhat surprised that BLNDX lost approx. 2% in the last 2 days.
As a retired and conservative investor, I am looking for a little more consistency.
After posting the above on July
19, I sold the fund before it lost even more of its value.
BLNDX On Fire This Year @BaluBalu said:
I warned you guys!
Well, from the glass
1/2 full perspective, BLNDX is still up substantially YTD... for now.
p.s, do you plan to exit soon? :)
BLNDX On Fire This Year I am a bit familiar with
Empower as it handles 40
1k of a relative. But I never looked at its free personal investing dashboard. Looks like it is only an app without a PC version. I will try to find out what info is available without setting up a login. I already use both
M* Portfolio/M* Investors and
Stock Rover (and I don't use brokerage connections), so I am not interested in getting into a 3rd (really, 4th?) portfolio tracking software, but am only interested in evaluating the Empower App.
Full name is
Empower Annuity Insurance Company of America.
Empower is the old
Great-West with several other recordkeeping businesses rolled up in it. It's now a subsidiary of Canadian Great-West Lifeco. It claims to be the 2nd largest retirement plan provider - depending on the source, the
1st may be Fidelity or TIAA or Fed TSP.
https://www.empower.com/personal-investorshttps://en.wikipedia.org/wiki/Empower_(financial_services)
Bridgeway Funds Global Opportunities Fund in registration Market-neutral (50-50 long-short) global ESG quant fund from Bridgeway. High expenses of 6.17% after 1.38% waiver until 11/1/25 are from a complex absolute-return strategy.
Rotation City. U.S. equity and bonds
BLNDX On Fire This Year My experimental money has room (fewer experiments running at the moment). I am usually a good test for lady luck.
July issue of Monthly Commentary has two good articles on International investing / funds: one each by Devesh and David. Check it out.
Edit: Longs be ware! I have a buy order in for BLNDX.
I warned you guys!
BLNDX down 2.62% since purchase (4 day holding). Of the many things in my portfolio, during my holding, only thing that performed worse than BLNDX is QQQ. I look to my experiments to meet or exceed a 60/40 bond/equity portfolio - pretty low bar but also not a slam dunk to beat when yields are high. In my own portfolio, YTD I am barely able to keep up with PRWCX, which itself is not having a great year (relative to its history). My bond / equity allocation is pretty similar to PRWCX, except my fixed income is more cash.
Since its peak on July
16, BLNDX is down more than 5%.
BLNDX On Fire This Year @staycalm, Thanks.
I have been tracking my portfolio since 2
107 and I do not think M* portfolio tool has changed / improved much since then.
One last question. Do they have quotes and charts for OEFs, CEFs, and ETFs for free?
BLNDX On Fire This Year I used M* many years back so my info (and memory) is likely dated. M* does not hold a candle to Empower. You don't need to connect any of your accounts to Empower, it can be 100% manual. I agree with the data breach risk of Empower.
Empower is a superior product to have a full picture of your net worth and allocation at your finger tips.
How many funds is the right number? Roth IRAs became popular after 2010 when the income limits were dropped.
Rorh Conversions don't require earned income.
But recently, the stretch was eliminated for most beneficiaries - now most inherited IRAs must be drained in 10 years & annual RMDs may be required too in some cases.
See Secure 2.0 thread for more details.
Bill Ackman is starting a fund for regular investors Bill Ackman's Europe-based fund Pershing Square Holdings/PSHZF ($10 billion) trades at a large 23% discount.
Bill Ackman is starting a fund for regular investors $25 billion?
Oops! After the roadshow, Bill Ackman will be happy with only $2.5-4.0 billion CEF PSUS initially. He will hard-cap the fund at $
10 billion - doesn't he know that "C" in CEF means closed, & they don't grow like OEFs or ETFs? To get to $
10 billion hard-cap, he will have to do lots of secondaries.
BTW, the largest US CEFs now are gold PHYS ($7.5 billion), multisector PDI ($6 billion), silver PSLV ($5 billion).
https://ca.finance.yahoo.com/news/ackman-cuts-funds-target-size-191640532.html
Buy Sell Why: ad infinitum. Today I sold some VONG (russell 1000) and split it among AMZN and GOOG. Dang, this trying to stick to indexing is hard. I regret selling them earlier this year and tell myself how can I go wrong with two companies that everyone I know uses.
January MFO Ratings Posted Thank you ybb. There is a note near the atop the chart explaining the roll-up methodology, but you mean add note inside the chart itself?
I do plan to expand notations and add to Definition page as we finished rolling-out the flow tools. Last couple steps: add flows for Fixed Periods, like we've done for Calendar Years. Then, integrate into MultiSearch, giving ability to screen for flows ... along with risk and return performance. That should be pretty cool.
Yes, the daily (or monthly) flows in the bottom bar chart are also rolled up, since Total Net Flows are computed from these values real time.
I will check on the CITs. That might help explain what Devesh pointed out with FCNTX at the last webinar. It's lost billions over last five years, despite good performance ... but unlike D&C, outflows cannot be explained by share class. Its AUM remains about $
120B, because performance has offset outflows, apparently. If not CITs, maybe just the challenge to actively managed funds, even good ones?
c
FCNTX Flows and Return Data Last 5 Years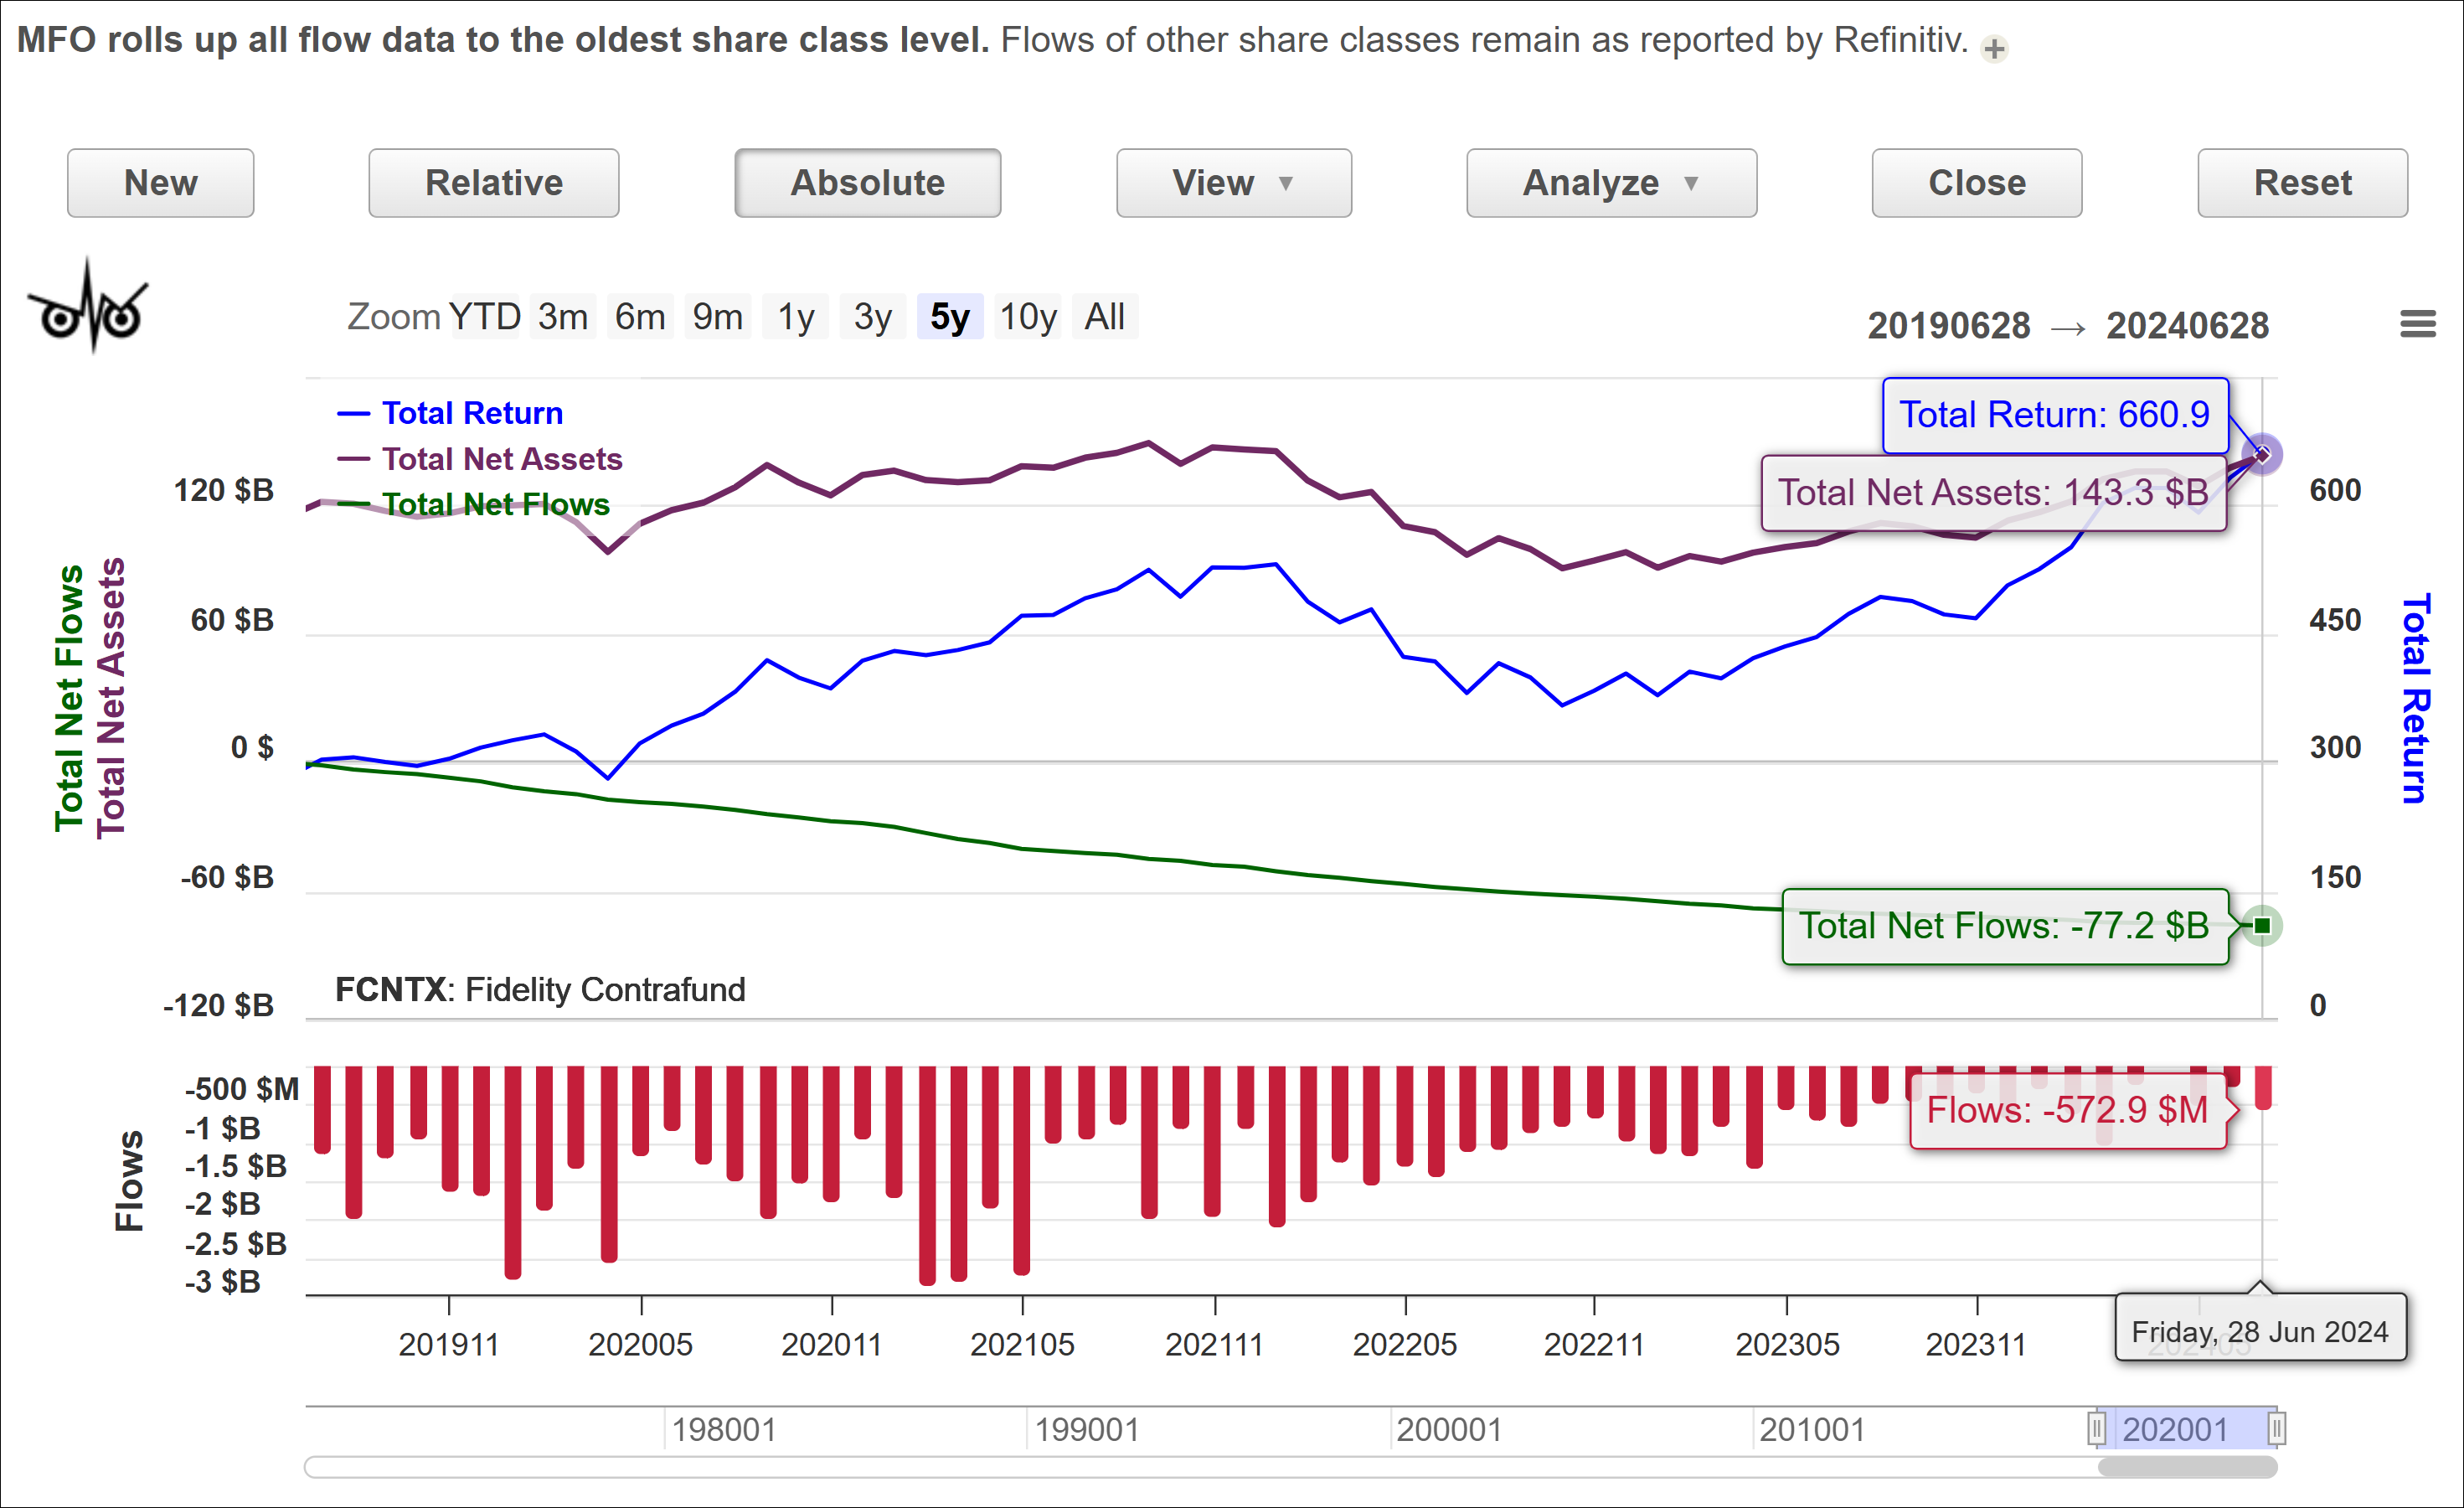
Rotation City. U.S. equity and bonds +1.
Rotation City. U.S. equity and bonds @Crash AT&T’s business and consumer wireline revenues account for ~25% of quarterly revenues, and show a slow but steady decline. This is offset by growth in their mobility segment plus fiber. 40% of fiber customers end up with their combined wireless plan. *I had their wireless plan and then went to fiber. I get better internet speeds, equal programming with DirectTV for $
100 less a month than Spectrum. AT&T also expects a bump due to the upcoming upgrade cycle of the new Apple phones.
I’ve got to think BCE will benefit from many of the same technology shifts as AT&T with their similar fiber buildout, but the market doesn’t appear to be in agreement.
Rotation City. U.S. equity and bonds @JD_co Could you tell me which one of Mag7 is leading the race to the most "down" since 7/
11 ?


