
It looks like you're new here. If you want to get involved, click one of these buttons!
The NYT notes some potential problems:Have they determined that the health benefit outweighs any long-term problems? I remember the hype about amphetamines in the 50s.
From the same NYTimes piece:Have they determined that the health benefit outweighs any long-term problems? I remember the hype about amphetamines in the 50s.
The Institute for Clinical and Economic Review, an influential nonprofit group, asked about a year ago if the new weight-loss drugs are cost-effective, meaning that their value in terms of a better quality of life, a longer life and benefit to society exceeds their cost.
Wegovy [approved for weight loss], the group reported, was not cost-effective. But the institute relied on an early and less precise estimate of the drug’s net price.
When shown Wegovy’s estimated net price in the A.E.I. research, the group’s chief medical officer, Dr. David M. Rind, said that if the calculations were correct, Wegovy was cost-effective but “still poses major budget challenges.”
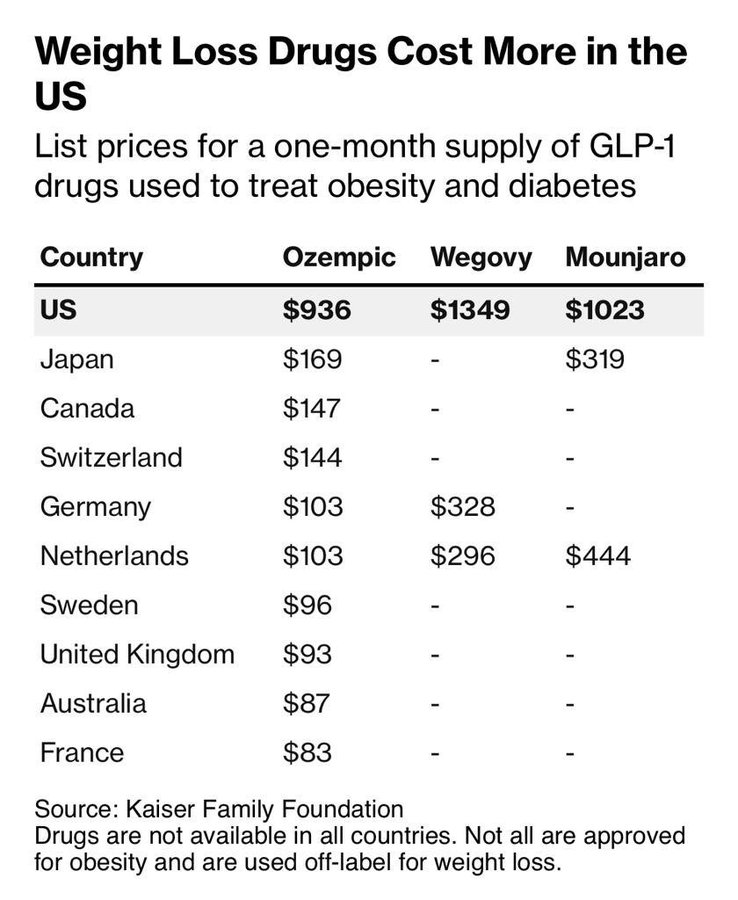
The key word in the graphic is list, as in list prices. The NYTimes gives a nice summary of an AEI study on what these drugs actually cost, net. That AEI study also notes that Rybelsus - with the same active ingredient (semaglutide) and same manufacturer (Novo Nordisk) as Ozempic and Wegovy - is delivered in tablet form.New diabetes/obesity drug prices per month (image below should open), https://twitter.com/Jason/status/1692641465363493146
Only injectables, no oral tabs yet.
Most insurance cover them only for diabetes, not obesity.
The NYTimes quotes "Jalpa Doshi, professor of medicine and director of the economics evaluation unit at the University of Pennsylvania" as speculating that prices will drop as competition increases. I'm not so sure. These will all be patented drugs (high barrier to entry) with a limited number of players, suggesting de facto (implicit collusion) oligopoly pricing.Net prices, the revenue divided by the number of prescriptions in their analysis, appear to be around $700 every four weeks for Wegovy, or about $650 less than the list price; about $300 for Ozempic, or nearly $650 less than the list price; and approximately $215 for Mounjaro, or about $800 less than its list price.
... and ...Wegovy, the same drug as Ozempic, is approved for weight loss. [Ozempic is not, though it also causes weight loss.] But the price of Ozempic is substantially lower than Wegovy’s price.
The reason may be that Ozempic has a direct competitor in Mounjaro.
Actual prices paid and insurance coverage are all over the map. As the NYTimes notes, "Those on Medicare, for instance, have no insurance coverage for Wegovy because Medicare is prevented by law from covering weight-loss drugs."An effective cure for [hepatitis C] initially cost as much as $84,000, leading to dire warnings that the cost would be comparable to “total spending in the United States on all drugs.”
The list price of the hepatitis C treatment plunged, as competitors entered the market. Pharmacy benefit managers, which negotiate with drug makers, had more leverage as companies competed. Net prices fell accordingly.
Well, someone has to pay for all the advertising ....New diabetes/obesity drug prices per month (image below should open), https://twitter.com/Jason/status/1692641465363493146
Only injectables, no oral tabs yet.
Most insurance cover them only for diabetes, not obesity.
Sounds right to me. Can’t react to every bit of news. Markets run to extremes. I’ve recently picked up a few additional shares of the food conglomerate I mentioned earlier at lower prices.I am not an 'active' investor. I tend to set it and forget it …”
© 2015 Mutual Fund Observer. All rights reserved.
© 2015 Mutual Fund Observer. All rights reserved. Powered by Vanilla


