
It looks like you're new here. If you want to get involved, click one of these buttons!
Today's Ed Yardeni column is titled : "Soft Patch Getting Softer Possibly Raising Odds of Fed Rate Cut in September & Stock Market Meltup"
Bad news is good news. until...bad news is bad news?
Perhaps the Fed anticipates them?[S]aid Mr. Dooley, “no matther whether th’ constitution follows th’ flag or not, th’ supreme coort follows th’ iliction returns.

Podcast:Why leading strategist, Ed Yardeni says this bull market is reminiscent of the 1920s when stock prices soared, the economy was growing and technology was leading the way.


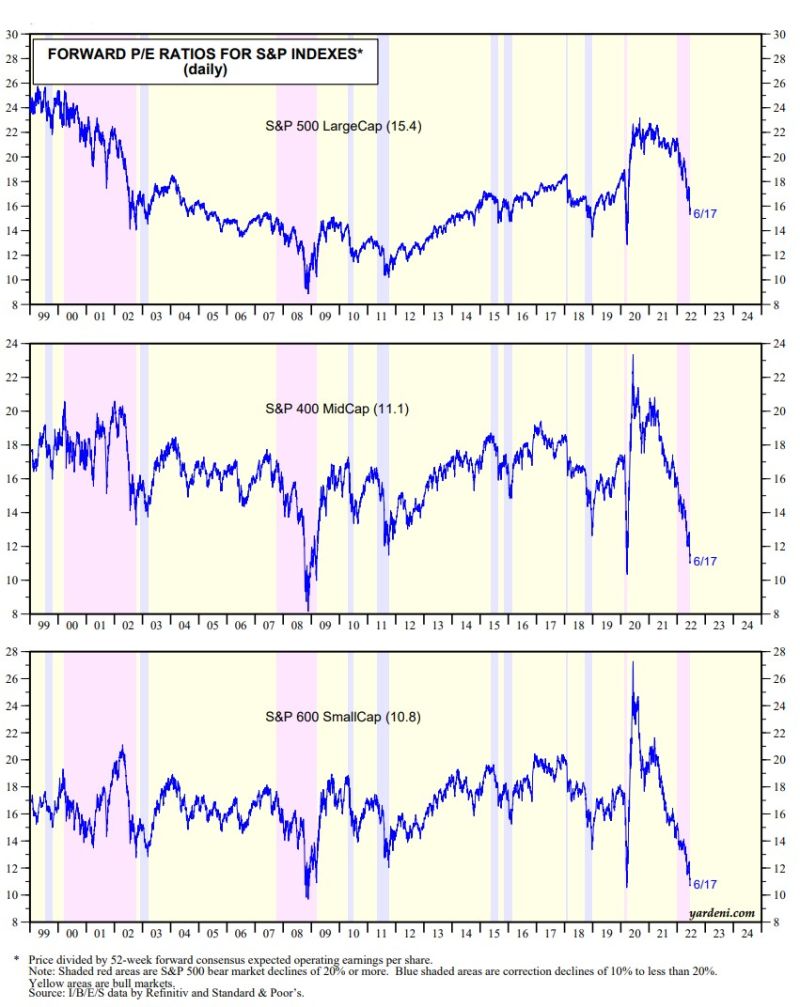
While the fwd P/E for small-cap (SC) R2000 has dropped dramatically, R2000 has many unprofitable companies (30-40% ?). Looking at more selective SP MC 400 and SP SC 600, those fwd P/Es have also dropped dramatically. See these charts by Yardeni via a Twitter post,
https://twitter.com/ayeshatariq/status/1538469641722413062
© 2015 Mutual Fund Observer. All rights reserved.
© 2015 Mutual Fund Observer. All rights reserved. Powered by Vanilla


