
Originally published in April 1, 2015 Commentary
It’s easy enough to look back at the last bear market to see which funds avoided massive drawdown. Unfortunately, portfolio construction of those same funds may not defend against the next bear, which may be driven by different instabilities.
Dodge & Cox Balanced Fund (DODBX) comes to mind. In the difficult period between August 2000 and September 2002, it only drew down 11.6% versus the S&P 500’s -44.7% and Vanguard’s Balanced Index VBINX -22.4%. Better yet, it actually delivered a healthy positive return versus a loss for most balanced funds.
Owners of that fund (like I was and remain) were disappointed then when during the next bear market from November 2007 to February 2009, DODBX performed miserably. Max drawdown of -45.8%, which took 41 months to recover, and underperformance of -6.9% per year versus peers. A value-oriented fund house, D&C avoided growth tech stocks during the 2000 bubble, but ran head-on into the financial bubble of 2008. Indeed, as the saying goes, not all bear markets are the same.
Similarly, funds may have avoided or tamed the last bear by being heavy cash, diversifying into uncorrelated assets, hedging or perhaps even going net short, only to underperform in the subsequent bull market. Many esteemed fund managers are in good company here, including Robert Arnott, John Hussman, Andrew Redleaf, Eric Cinnamond to name a few.
Morningstar actually defines a so-called “bear-market ranking,” although honestly this metric must be one of least maintained and least acknowledged on its website. “Bear-market rankings compare how funds have held up during market downturns over the past five years.” The metric looks at how funds have performed over the past five years relative to peers during down months. Applying the methodology over the past 50 years reveals just how many “bear-market months” investors have endured, as depicted in the following chart:
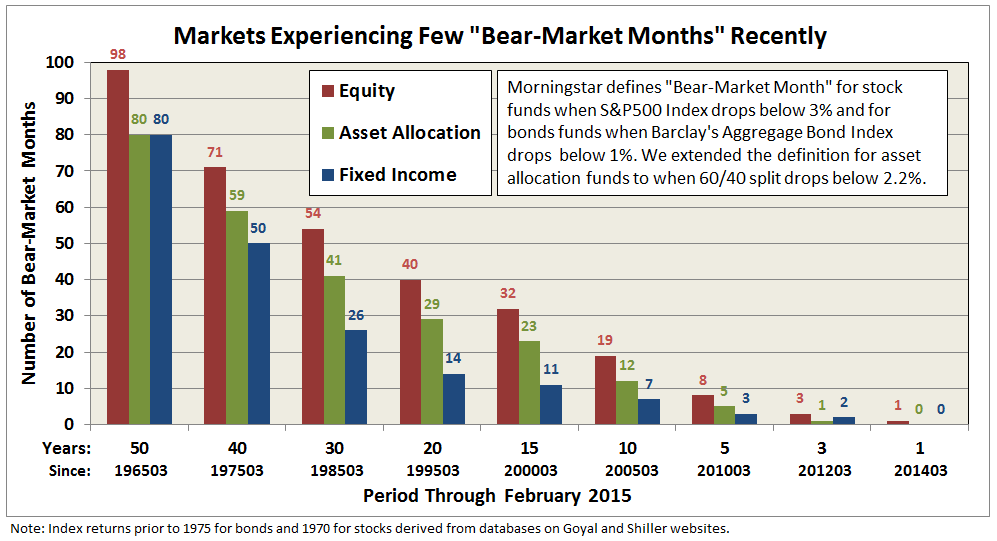
The long term average shows that equity funds experience a monthly drop below 3% about twice a year and fixed income funds experience a drop below 1% about three times every two years. There have been virtually no such drops this past year, which helps explain the five-year screening window.
The key question is whether a fund’s performance during these relatively scarce down months is a precursor to its performance during a genuine bear market, which is marked by a 20% drawdown from previous peak for equity funds.
Taking a cue from Morningstar’s methodology (but tailoring it somewhat), let’s define “bear market deviation (BMDEV)” as the downside deviation during bear-market months. Basically, BMDEV indicates the typical percentage decline based only on a fund’s performance during bear-market months. (See Ratings System Definitions and A Look at Risk Adjusted Returns.)
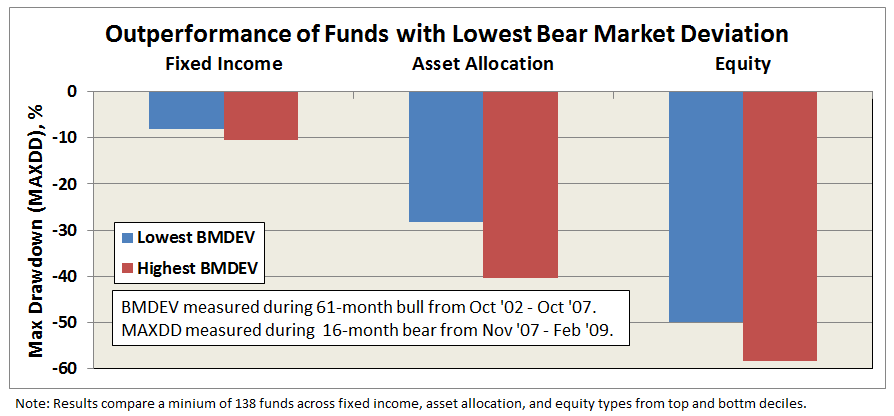
The bull market period preceding 2008 was just over five years, October 2002 through October 2007, setting up a good test case. Calculating BMDEV for the 3500 or so existing funds during that period, ranking them by decile within peer group, and then assessing subsequent bear market performance provides an encouraging result … funds with the lowest bear market deviation (BMDEV) well out-performed funds with the highest bear market deviation, as depicted below.
Comparing the same funds across the full cycle reveals comparable if not superior absolute return performance of funds with the lowest bear market deviation. A look at the individual funds includes some top performers:
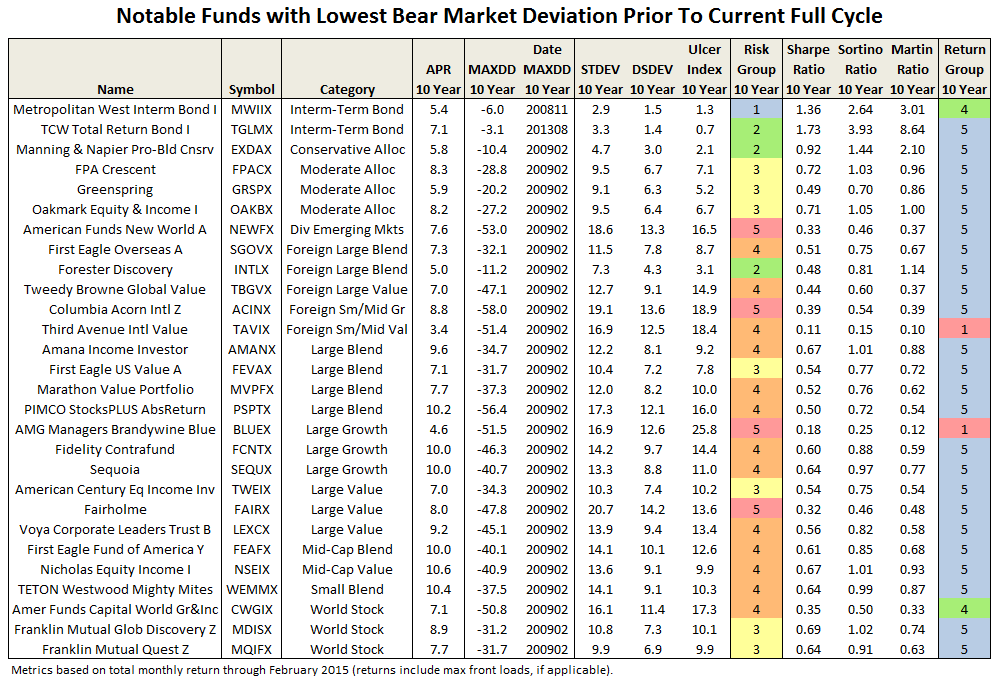
The correlation did not hold up in all cases, of course, but it is a reminder that the superior return often goes hand-in-hand with protecting the downside.
Posturing then for the future, which funds have the lowest bear-market deviation over the current bull market? Evaluating the 5500 or so existing funds since March 2009 produces a list of about 450 funds. Some notables are listed below and the full list can be downloaded here. (Note: The full list includes all funds with lowest decile BMDEV, regardless of load, manager change, expense ratio, availability, min purchase, etc., so please consider accordingly.)
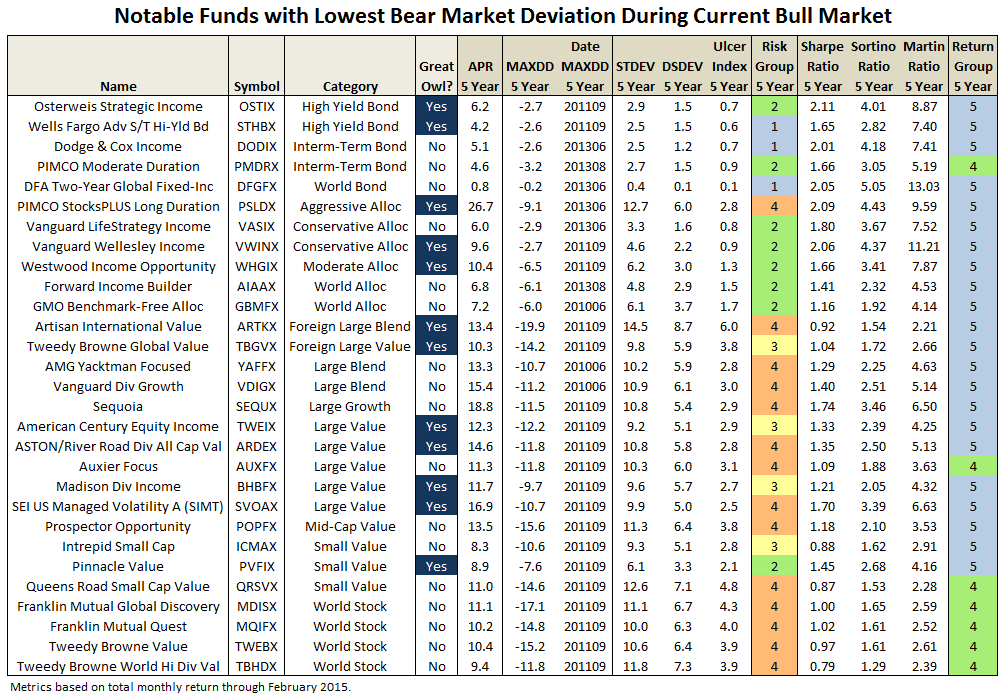
All of the funds on the above list seem to make a habit of mitigating drawdown, experiencing a fraction of the market’s bear-market months. In fact, a backward look of the current group reveals similar over-performance during the financial crisis when compared to those funds with the highest BMDEV.
Also, scanning through the categories above, it appears quite possible to have some protection against downside without necessarily resorting to long/short, market neutral, tactical allocation, and other so-called alternative investments. Although granted, the time frame for many of the alternatives categories is rather limited.
In any case, perhaps there is something to be said for “bear-market rankings” after all. Certainly, it seems a worthy enough risk metric to be part of an investor’s due diligence. We will work to make available updates of bear-market rankings for all funds to MFO readers in the future.