
Originally published in January 1, 2014 Commentary
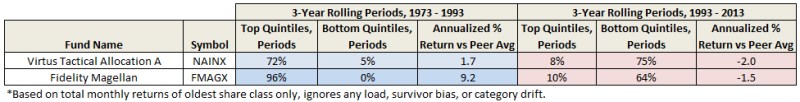
It’s 1993. Ten moderate allocation funds are available that have existed for 20 years or more. A diligent, well intended investor wants to purchase one of them based on persistent superior performance. The investor examines rolling 3-year risk-adjusted returns every month during the preceding 20 years, which amounts to 205 evaluation periods, and delightfully discovers Virtus Tactical Allocation (NAINX).
It outperformed nearly 3/4ths of the time, while it under-performed only 5%. NAINX essentially equaled or beat its peers 194 out of 205 periods. Encouraged, the investor purchases the fund making a long-term commitment to buy-and-hold.
It’s now 2013, twenty years later. How has NAINX performed? To the investor’s horror, Virtus Tactical Allocation underperformed 3/4ths of the time since purchased! And the fund that outperformed most persistently? Mairs & Power Balanced (MAPOX), of course.
Back to 1993. This time a more aggressive investor applies the same methodology to the large growth category and finds an extraordinary fund, named Fidelity Magellan (FMAGX). This fund outperformed nearly 100% of the time across 205 rolling 3-year periods over 20 years versus 31 other long-time peers. But during the next 20 years…? Not well, unfortunately. This investor would have done better choosing Fidelity Contrafund (FCNTX). How can this be? Most industry experts would attribute the colossal shift in FMAGX performance to the resignation of legendary fund manager Peter Lynch in 1990.
MJG, one of the heavy contributors to MFO’s discussion board, posts regularly about the difficulty of staying on top of one’s peer group, often citing results from Standard & Poor’s Index Versus Active Indexing (SPIVA) reports. Here is the top lesson-learned from ten years of these reports:
“Over a five-year horizon…a majority of active funds in most categories fail to outperform indexes. If an investing horizon is five years or longer, a passive approach may be preferable.”
The December 2013 SPIVA “Persistence Scorecard” has just been published, which Joshua Brown writes insightfully about in “Persistence is a Killer.” The scorecard once again shows that only a small fraction of top performing domestic equity mutual funds remain on top across any 2, 3, or 5 year period.
What does mutual fund non-persistence look like across 40 years? Here’s one depiction:
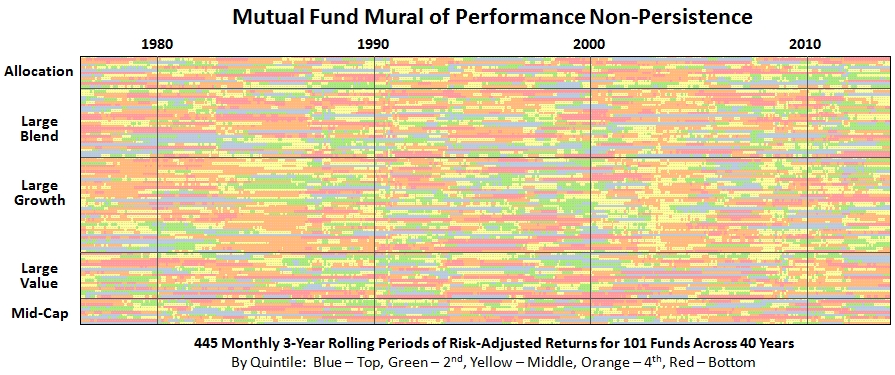
The image (or “mural”) represents monthly rank by color-coded quintiles of risk-adjusted returns, specifically Martin Ratio, for 101 funds across five categories. The funds have existed for 40 years through September 2013. The calculations use total monthly returns of oldest share class only, ignoring any load, survivor bias, and category drift. Within each category, the funds are listed alphabetically.
There are no long blue/green horizontal streaks. If anything, there seem to be more extended orange/red streaks, suggesting that if mutual fund persistence does exist, it’s in the wrong quintiles! (SPIVA actually finds similar result and such bottom funds tend to end-up merged or liquated.)
Looking across the 40 years of 3-year rolling risk-adjusted returns, some observations:
- 98% of funds spent some periods in every rank level…top, bottom, and all in-between
- 35% landed in the bottom two quintiles most of the time…that’s more than 1/3rd of all funds
- 13% were in the top two bottom quintiles…apparently harder to be persistently good than bad
- Sequoia (SEQUX) was the most persistent top performer…one of greatest mutual funds ever
- Wall Street (WALLX) was the most persistent cellar dweller…how can it still exist?
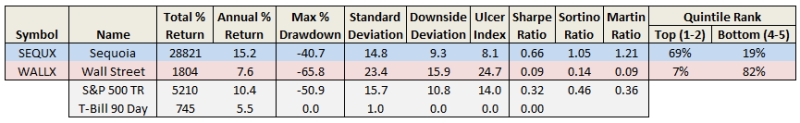
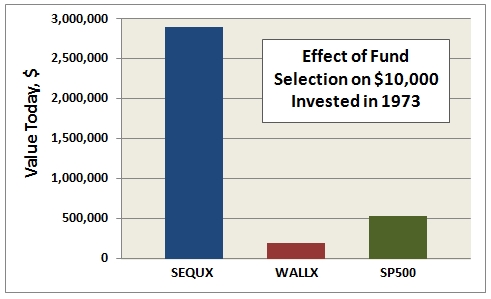
The difference in overall return between the most persistent winner and loser is breathtaking: SEQUX delivered 5.5 times more than SP500 and 16 times more than WALLX. Put another way, $10K invested in SEQUX in October 1973 is worth nearly $3M today. Here’s how the comparison looks:
So, while attaining persistence may be elusive, the motivation to achieve it is clear and present.
The implication of a lack of persistence strikes at the core of all fund rating methodologies that investors try to use to predict future returns, at least those based only on historical returns. It is, of course, why Kiplinger, Money, and Morningstar all try to incorporate additional factors, like shareholder friendliness, experience, and strategy, when compiling their Best Funds lists. An attempt, as Morningstar well states, to identify “funds with the highest potential of success.”
The MFO rating system was introduced in June 2013. The current 20-year Great Owls, shown below for moderate allocation and large growth categories, include funds that have achieved top performance rank over the past 20, 10, 5, and 3 year evaluation periods. (See Rating Definitions.)
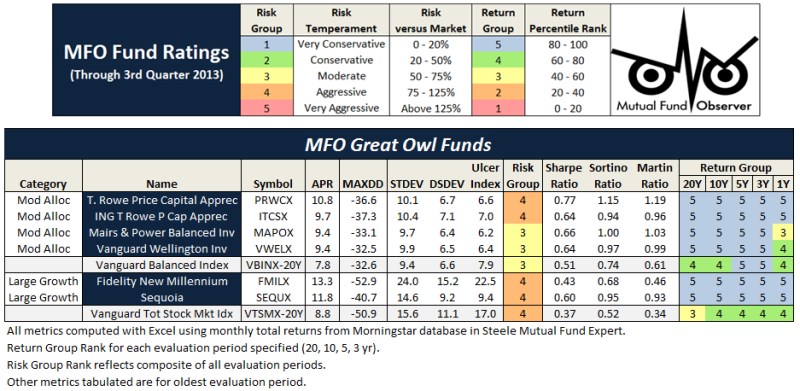
But will they be Great Owls next year? The system is strictly quantitative based on past returns, which means, alas, a gentle and all too ubiquitous reminder that past performance is not a guarantee of future results. (More qualitative assessments of fund strategy, stewardship, and promise are provided monthly in David’s fund profiles.) In any case and in the spirit of SPIVA, we will plan to publish periodically a Great Owl “Persistence Scorecard.”
31Dec2013/Charles