
Originally published in May 1, 2015 Commentary
Baseball season has started. MLB.TV actually plays more commercials than it used to, which sad to say I enjoy more than the silent “Commercial Break In Progress” screen, even if they are repetitive.
One commercial is for The Hartford Funds. The company launched a media campaign introducing a new tagline, “Our benchmark is the investor℠,” and its focus on “human-centric investing.”

Its website touts research they have done with MIT on aging, and its funds are actually sub-advised by Wellington Management.
A quick look shows 66 funds, each with some 6 share classes, and just under $100B AUM. Of the 66, most charge front loads up to 5.5% with an average annual expense ratio of just over 1%, including 12b-1 fee. And, 60 have been around for more than 3 years, averaging 15 years in fact.
How well have their funds performed over their lifetimes? Just average … a near even split between funds over-performing and under-performing their peers, including expenses.
We first started looking at fund family performance last year in the piece “How Good Is Your Fund Family?” Following much the same methodology, with all the same qualifications, below is a brief update. Shortly, we hope to publish an ongoing tally, or “Fund Family Score Card” if you will, because … during the next commercial break, while watching a fund family’s newest media campaign, we want to make it easier for you to gauge how well a fund family has performed against its peers.
The current playing field has about 6200 US funds packaged and usually marketed in 225 families. For our tally, each family includes at least 5 funds with ages 3 years or more. Oldest share class only, excluding money market, bear, trading, and specialized commodity funds. Though the numbers sound high, the field is actually dominated by just five families, as shown below:
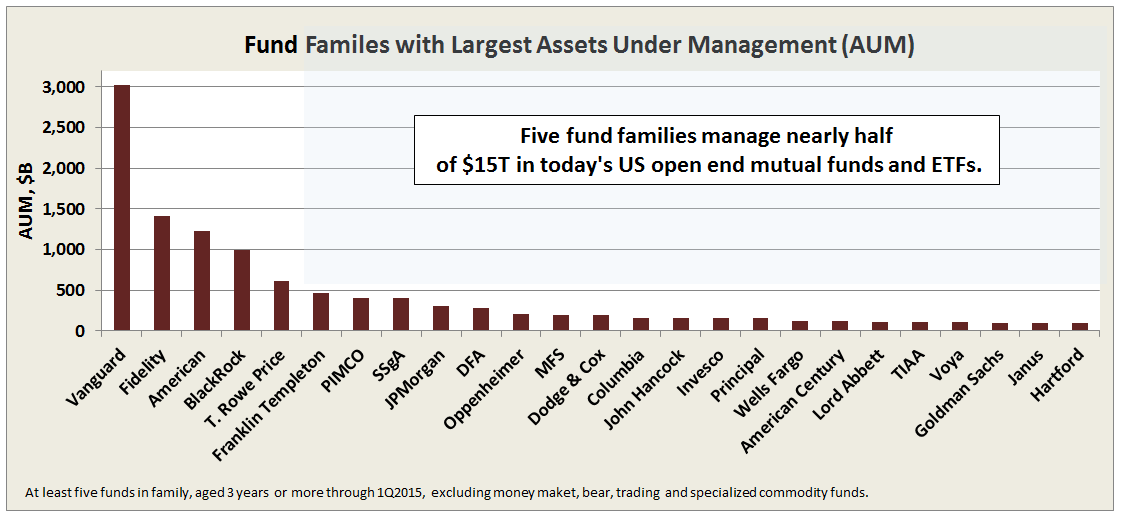
It is interesting that while Vanguard represents the largest family by AUM, with nearly twice its nearest competitor, its average annual ER of 0.22% is less than one third either Fidelity or American Funds, at 0.79% and 0.71%, respectively. So, even without front loads, which both the latter use to excess, they are likely raking in much more in fees than Vanguard.
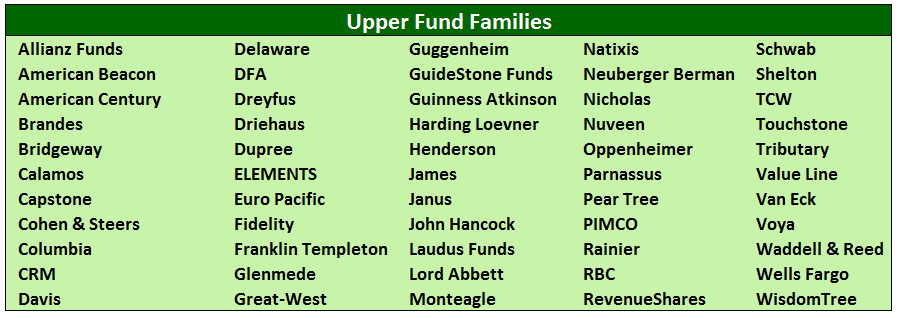
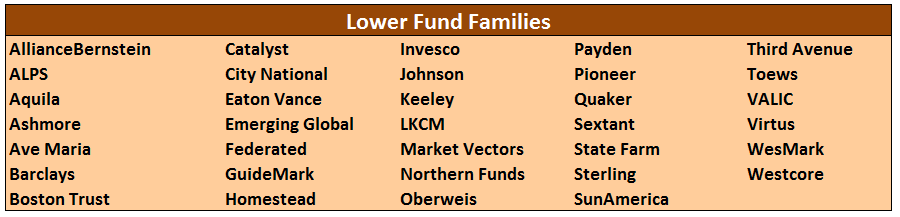
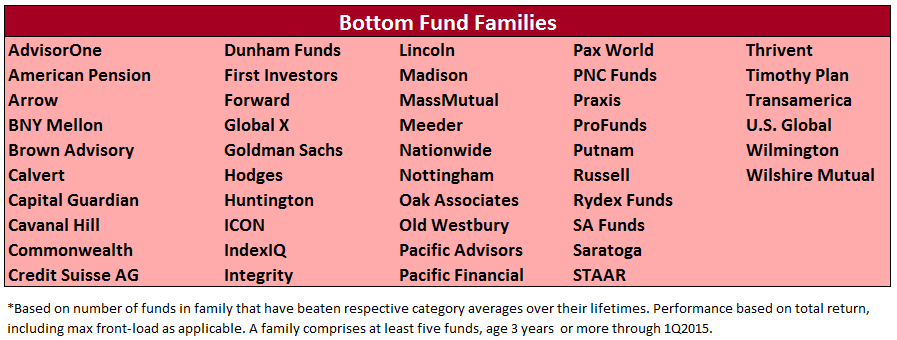
Ranking each of the 225 families based on number of funds that beat their category averages produces the following score card, by quintile, best to worst:
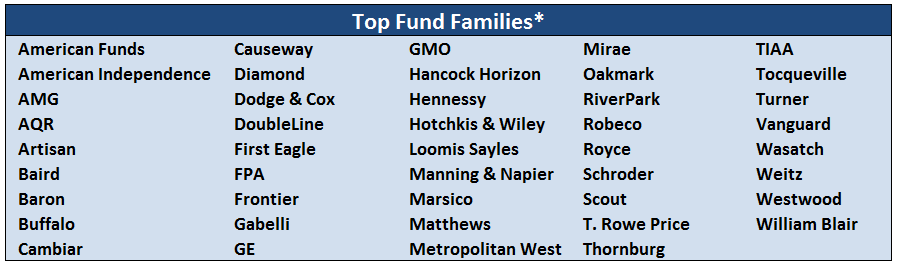
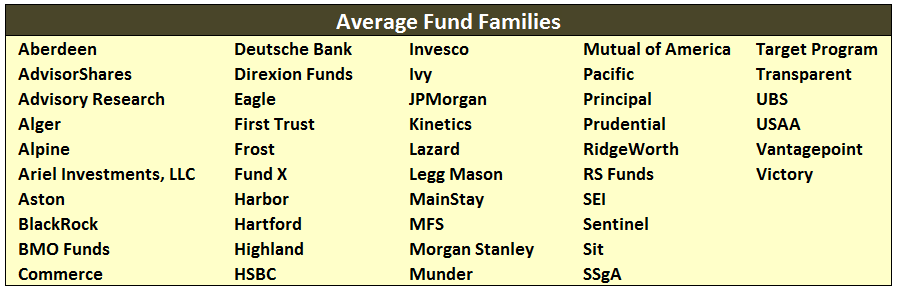
Of the five families, four are in top two quintiles: Vanguard, American Funds, Fidelity, and T. Rowe Price. In fact, of Vanguard’s 145 funds, 119 beat their peers. Extraordinary. But BlackRock is just average, like Hartford.
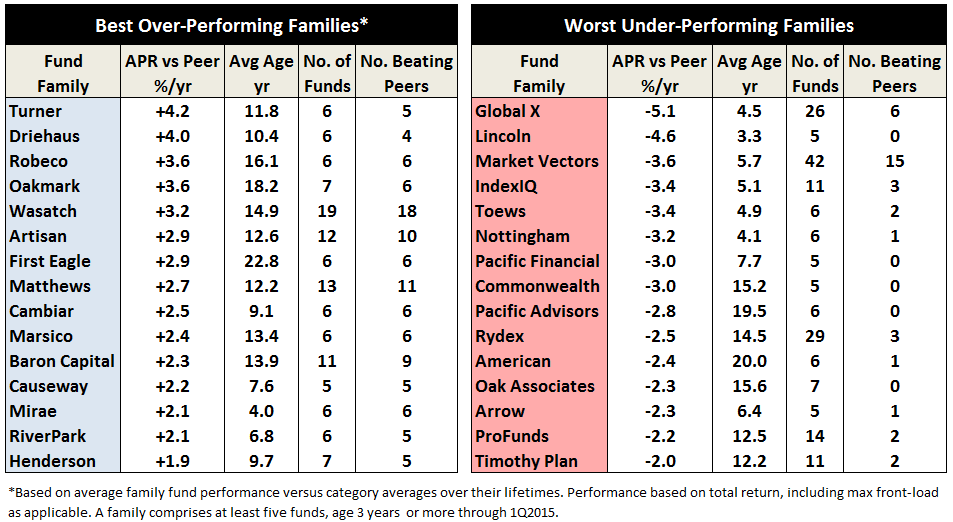
The difference in average total return between top and bottom fund families on score card is 3.1% per year!
The line-ups of some of the bottom quintile families include 100% under-performers, where every fund has returned less than its peers over their lifetimes: Commonwealth, Integrity, Lincoln, Oak Associates, Pacific Advisors, Pacific Financial, Praxis, STAAR. Do you think their investors know? Do the investors of Goldman Sachs know that their funds are bottom quintile … written-off to survivorship bias possibly?
Visiting the website of Oberweis, you don’t see that four of its six funds under-performed. Instead, you find: TWO FUNDS NAMED “BEST FUND” IN 2015 LIPPER AWARDS. Yes, its two over-performers.
While the line-ups of some top quintile families include 100% over-performers: Cambiar, Causeway, Dodge & Cox, First Eagle, Marsico, Mirae, Robeco, Tocqueville.
Here is a summary of some of the current best and worst:
While not meeting the “five funds” minimum, some other notables: Tweedy Browne has 4 of 4 over-performers, and Berwyn, FMI, Maris & Power, Meridian all have 3 of 3. As well as younger families off to great starts: KP, 14 of 14 over-performers, Rothschild 7 of 7, Gotham 5 of 5, and Grandeur Peak 4 of 4. We will find a way to call attention to these funds too on the future “Fund Family Score Card.”