
Dear friends,
There are days in spring when I’m not sure whether what I’m hearing is ticking or dripping. My students know that the end of the school year is nigh. If they glance up from their phones, it’s to glance out the window and across Augustana’s campus. It’s always pretty here, even in November, but there are about four to six weeks when it’s absolutely stunning. For three weeks in spring, the central campus is festooned with blossoms as serviceberry, cherry, apple, and lilac erupt. Again in October the maples dominate, painting the campus crimson and gold.

Photo courtesy of Augustana Spring Photo Contest winner, Shelby Burroughs.
It’s glorious!
Unless you’re trying to get students to learn about Nazi rhetorical strategies and the parallel strategies of demonization used across cultures. If you do that, then you hear the rhythmic tick, tick, tick as they count down the final weeks of the year.
Or is it the slower drip, drip, drip as their brains leak out of their ears and their IQs puddle on the classroom floor?
And still we find joy in the occasional glimpses of the tremendous growth they’ve already experienced and in the prospect that, come fall, they’ll be back, cheerful and recharged.
At least, until those durn maples take over.
The Dry Powder Gang, revisited
“Put your trust in God but keep your powder dry.”
Oliver Cromwell, 1650, to the soldiers of the New Model Army as they prepared to forge an Irish river and head into battle.
Cromwell was a dour, humorless (or “humourless”) religious fanatic charged with squashing every Catholic and every independent thought in the British Isles because, well, that’s what God demanded. Famine, plague, deportations, mass death and deportations followed.
But even Cromwell knew that the key to victory was prudent preparation; faith did not win battles in the absence of the carefully stocked dry gunpowder that powered the army. There were times to charge ahead and there were times to gather powder.
With investing likewise: there are times to be charge ahead and times to withdraw. Most investors struggle with that decision. Why?
- Most investment products feed our worst impulses. The investment industry has come to be dominated by passive, fully-invested products over the past five years; not coincidentally, that period has seen just one break in the upward rush. In cap-based funds, more money goes to the best performing stocks in the index so markets get driven by the momentum of fewer and fewer stocks. In 2015, for instance, just four stocks accounted for the S&P 500’s entire gain.
- Most professional investors worry more about accumulating assets than about serving investors. By most measures, the U.S. stock market is substantially overpriced but the cash reserves at mutual funds are at their lowest levels in history. Why? Because, as Jason Zweig writes, “cash is now a sin.” Cash is a drag on short-term returns and investors fixated on 1/3/5 year returns have poured their money into funds that are fully invested all the time, both index products and the cowardly “active” managers who merely shadow them. The technical term for “skilled investors who do not attract assets to the firm” is “unemployed.”
- Most of us are too optimistic. Most guys think of themselves as “good investors” or “above average” investors, mostly because “good” is such a vague term and almost none of us actually know how or what we’ve done. Quick quiz: what’s your personal rate of return over the last five years? How much of your portfolio was invested cautiously as the market approached its top in October 2007 and how much was invested aggressively at its bottom in March 2009? The honest answers for most of us are “dunno, dunno, dunno.”
It’s not just about investing. 95% of us think we’re above average drivers. One 1965 study of drivers responsible for car accidents that put people in the hospital found the same: the majority of those drivers rated themselves as “really good.” Jason Zweig talked through a lot of the research and its implications in chapter four of his book Your Money and Your Brain (2007). We originally linked to what turned out to be a plagiarized version of Jason’s work, masquerading as an advisor’s newsletter. (Thanks to Jason for letting us know of the goof.)
The result is that we’re tempted to take on too much risk, sublimely confident that it will all work out.
But it won’t. It never does. You need a manager who’s got your back, and you need him now. Here are three arguments in three pictures.
Argument one: stock prices are too danged high.
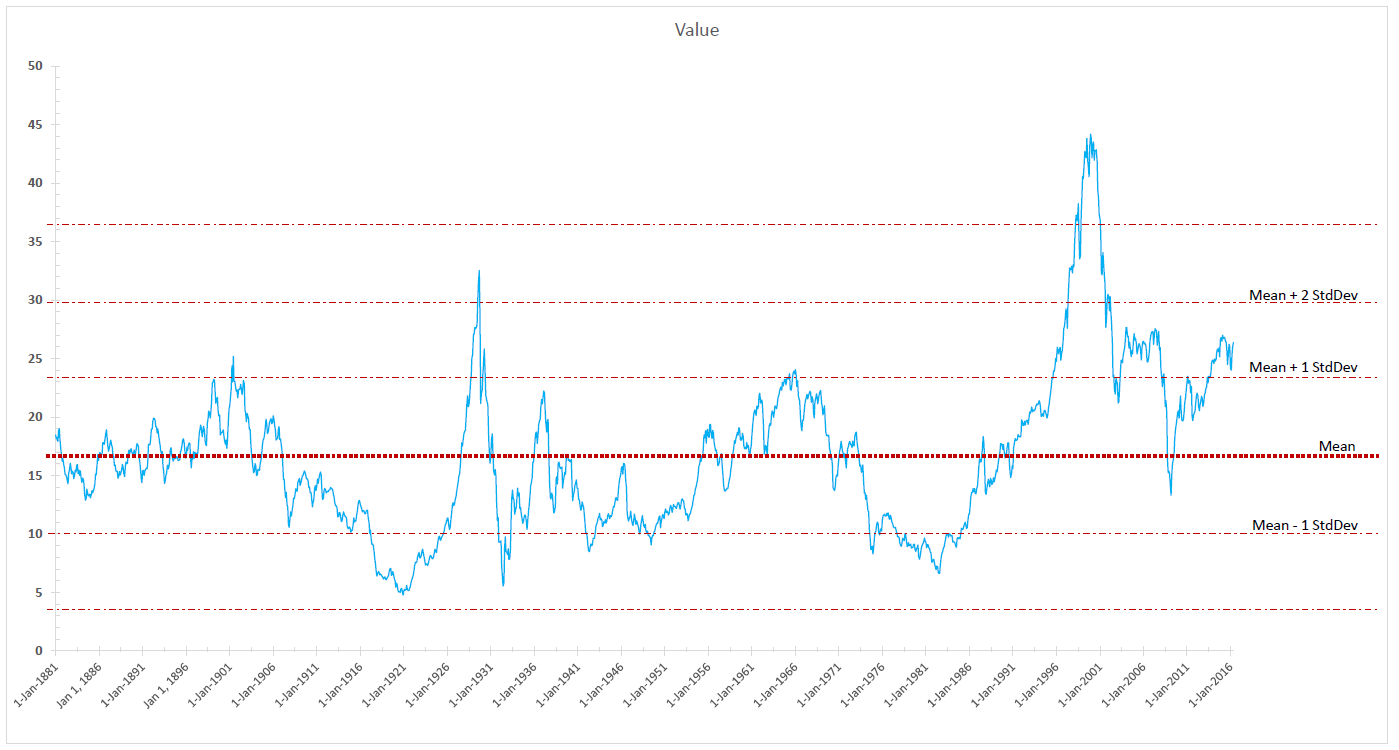
This chart shows valuation of the US stock market back to 1880; numbers get really sketchy before that. Valuation, on the left axis, is the CAPE P/E ratio which tries to adjust for the fact that earnings tend to be “lumpy” so it averages them over time. The “mean” line is the average value over 140 years. The adjacent red lines mark the boundaries of one standard deviation from the normal. That reflects the prices you’d expect to see in two years out of three. If you get above the two S.D. line, those are once in 20 years prices. Three standard deviation prices should occur once in 300 years.
The U.S. market went over a CAPE P/E of 24 just three times in the 20th century; it’s lived there in the 21st. The market’s P/E at its February 2016 bottom was still higher than the P/E at its October 2007 top.
Argument two: Price matters.
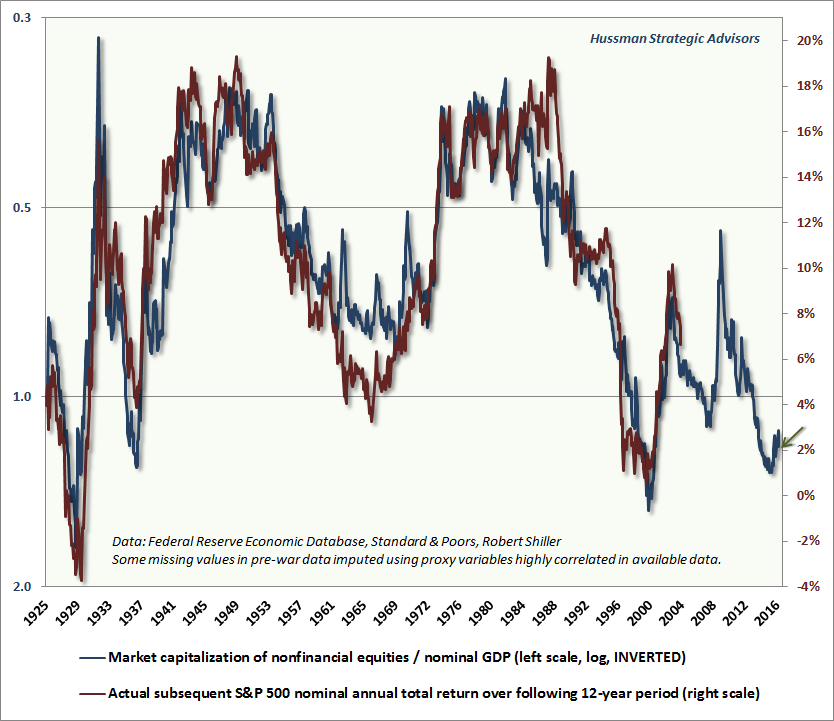
Thanks to Ryan Leggio of FPA for sharing this chart and John Hussman for creating it.
If you overpay for something, whether it’s $72 million for a “franchise quarterback” who’s only started seven NFL games ever, or 115 years’ worth of earnings for a share of Netflix stock, you’re going to be disappointed.
The chart above reflects the stock market’s valuation (measured by the value of the stock market as a percentage of the value of the “real economy,” so when the blue line is high, stocks are relatively inexpensive) overlaid with its returns over the following 12 years. With considerable consistency, price predicts future returns. By this measure, U.S. stocks are priced to return 2% a year. The only ways for that number to go up is for the U.S. economy to grow at an eye-watering rate or for prices to come down. A lot. Based on the market’s performance over the past 60 years, the folks at the Leuthold Group find that a return to the valuations seen in the average bear market would require a fall of 30-40% from where we were at the end of March. Given that earnings have deteriorated and prices have risen in the 30 days since then, you might need to add a point or two to the decline.
Argument three: Market collapses are scary
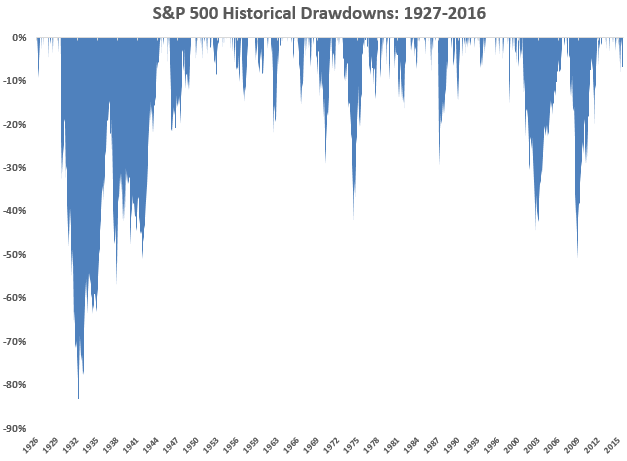 I think of this as “the icicle chart.” Ben Carlson, one of the Ritholtz managers, wrote a really thoughtful essay, rich in visuals, in April. He posted it on his Wealth of Commonsense blog under the name “180 years of market drawdowns.” He provided this graph as an antidote to those relentlessly cheerful logarithmic “mountain charts.” Those are the ones that show the stock market’s relentless climb with just niggling little “oopsies” from time to time. Losing half your portfolio is, viewed from the perspective of a few decades or a century, just a minor annoyance. Losing half your portfolio is, viewed from the perspective of a guy who needs to meet a mortgage, fund a college education and plan for the end of a teaching career, rather a bigger deal. Mr. Carlson concludes:
…stocks are constantly playing mind games with us. They generally go up but not every day, week, month or year. No one can predict what the future returns will be in the market … But predicting future risk is fairly easy — markets will continue to fluctuate and experience losses on a regular basis.
Market losses are the one constant that don’t change over time — get used to it.
Managers who’ve got your back
There are only a handful of managers left who take all of that seriously. The rest have been driven to unemployment or retirement by the relentless demand: fully invested, price be damned. They typically follow a simple model: stock by stock, determine a reasonable price for everyone in our investable universe. Recognize that stocks are risky, so buy them only when they’re selling at a healthy discount to that price. Hold them until they’re around full value, then move on regardless of whether their prices are still rising. Get out while the getting is good. If you can’t find anything worth buying today, hold cash, keep your powder dry and know that the next battle awaits.
They bear a terrible price for hewing to the discipline. Large firms won’t employ them since large firms, necessarily, value “sticky assets” above all else. 99.7% of the investment community views them as relics and their investors steadily drift away in favor of “hot hands.”
They are, in a real sense, the individual investor’s best friends. They’re the people who are willing to obsess over stocks when you’d rather obsess over the NFL draft or the Cubs’ resurgence. And they’re willing, on your behalf, to walk away from the party, to turn away from the cliff, to say “no” and go. They are the professionals who might reasonably claim …

This chart reflects every equity-oriented mutual fund that currently has somewhere between “a lot” and “the vast majority” of their portfolio in cash, awaiting the return of good values. Here’s how to read it. The first two columns are self-explanatory. The third represents how their portfolios have been repositioned between 2011 (when there are still reasonable valuations) and now. Endurance, for example, had two-thirds of its money in stocks in 2011 but only a quarter invested now. The fourth column is fund’s annual return for the period noted (full market cycle or since inception). The fifth shows the fund’s Sharpe ratio, a measure of risk-adjusted returns, against its peers. The sixth column shows you how its performed, again relative to its peer group, in bear market months. The last column is the comparison time frame. I’ve marked decisive superiority in blue, comparable performance in amber and underperformance in red. All data is month end, March 2016.
| Style | Change in equity exposure from 2011 – 2016 | Annual return | Sharpe ratio, compared to peers | Bear market rating, compared to peers | Comparison period | |
| Intrepid Endurance ICMAX | Small-cap value | 64%->24% | 8.0% | 0.64 vs 0.23 | 1 vs 6 | FMC |
| Bruce BRUFX | Flexible | 41 -> 46 | 7.2 | 0.56 vs 0.22 | 4 vs 6 | FMC |
| FPA Crescent FPACX | Flexible | 57 -> 52 | 6.0 | 0.54 vs 0.22 | 4 vs 6 | FMC |
| Centaur Total Return TILDX | Equity-income | 89 -> 40 | 7.4 | 0.51 vs 0.30 | 1 vs 5 | FMC |
| Pinnacle Value PVFIX | Small-cap core | 51 -> 52 | 3.9 | 0.41 vs 0.24 | 1 vs 6 | FMC |
| Intrepid Disciplined Value ICMCX | Mid-cap value | 81 -> 51 | 5.4 | 0.37 vs 0.29 | 1 vs 6 | FMC |
| Frank Value FRNKX | Mid-cap core | 83 -> 40 | 5.4 | 0.25 vs 0.27 | 1 vs 6 | FMC |
| Hennessy Total Return HDOGX | Large-cap value, Dogs of the Dow | 73 -> 51 | 3.4 | 0.24 vs 0.20 | 4 vs 4 | FMC |
| Bread & Butter BABFX | Multi-cap value | 69 -> 58 | 2.8 | 0.18 vs 0.21 | 1 vs 6 | FMC |
| Funds with records >5 years but less than the full market cycle | ||||||
| Cook & Bynum COBYX | Global large-cap core | 67% -> 54% | 9.6% | 1.21 vs 0.61 | 1 vs 6 | 08/2009 |
| Castle Focus MOATX | Global multi-cap core | 67 -> 66 | 7.5 | 1.02 vs 0.63 | 1 vs 6 | 08/2010 |
| ASTON / River Road Independent Value ARIVX | Small-cap value | 49 -> 18 | 4.1 | 0.61 vs 0.50 | 1 vs 6 | 01/2011 |
| Chou Opportunity CHOEX | Flexible | 74 -> 51 | 1.4 | 0.07 vs 0.62 | 10 vs 6 | 08/2010 |
| Two plausible benchmarks | ||||||
| Vanguard Total Stock Market VTSMX | Multi-cap core | 100 -> 100 | 5.8% | 0.32 | 4 | FMC |
| Vanguard Balanced Index VBINX | Hybrid | 60 -> 60 | 5.6% | 0.52 | 1 | FMC |
There are four funds just beyond the pale: the funds have shorter records (though the managers often have long ones in other vehicles) but have disciplined investors at the helm and lots of cash on the books. They are:
Goodhaven GOODX
Hussman Strategic Dividend Value HSDVX
Linde Hansen Contrarian Value LHVAX
Poplar Forest Outlier PFOFX
No single measure is perfect and no strategy, however sensible, thrives in the absence of a sufficiently talented, disciplined manager. This is not a “best funds” list, much less a “you must buy it now, now, now!” list.
Bottom Line: being fully invested in stocks all the time is a bad idea. Allowing greed and fear, alternately, to set your market exposure is a worse idea. Believing that you, personally, are magically immune from those first two observations is the worst idea of all.
You should invest in stocks only when you’ll be richly repaid for the astronomical volatility you might be exposed to. Timing in and out of “the market” is, for most of us, far less reliable and far less rewarding than finding a manager who is disciplined and who is willing to sacrifice assets rather than sacrifice you. The dozen teams listed above have demonstrated that they deserve your attention, especially now.
Garbage in, garbage out: The 1/3/5/10 follies
On whole, we are not fans of reporting a fund’s one, three, five or even ten year records. In a dyspeptic moment I might suggest that the worship of standard reporting periods is universal, lunatic, destructive, obligatory, deluding, crippling, deranged, lazy, unwise, illogical and mayhap phantasmagoric.
On whole, I’d prefer that you not do it.
The easiest analogy might be to baseball. Here’s a quick quiz. Which of these statements is most meaningful to a baseball fan?
(a) My team won the last one, three and five innings!
(b) My team won the game.
We think it’s more useful to assess how a manager has performed over a full market cycle; that is, in good time and bad. The current market cycle began in October 2007, the day that the previous cycle reached its final peak and the market began its historic tumble. This cycle has included both a 51% loss for US large caps and a 223% rise. Folks who held on through both are up about 58% since the cycle began. That’s punky compared to the cycle that dominated the 1990s (up 533%) but durned fine compared to the cycle that ended in 2007 with a tiny 14% gain over seven years.
If you don’t judge your investments by meaningful measures, you cannot make meaningful decisions. Here’s a simple illustration.
If you look at the past 12 months, the Vanguard 500 Index is up 1.8% (through the end of March) and FPA Crescent is down 2.4%. Conclusion: Crescent sucks, buy the index!
Over the past three years, the 500 is up 39% and Crescent is up 18.6%. More sucking.
Over the past five years, the 500 is up 71% and Crescent is up 38%. Maximum suckage! But so far, we’re measuring only raw performance in the good times.
Over the course of the full market cycle, including the 2007-09 crash, Crescent is up 64% to the 500’s gain of 58%. More importantly, the index subjected its investors to a 51% decline compared to Crescent’s 29% drop. In bear market months, Crescent’s investors have slipped 7%, while the index investors dropped 11%.
We weigh the balance of your risks and returns by computing measures of risk-adjusted performance, such as the Sharpe and Martin ratios. Taking both halves of the equation (risk and return) into account and measuring performance over a meaningful period (the full market cycle), Crescent clubs the index.
| Sharpe | Martin | Ulcer Index | |
| Crescent | 0.54 | 0.72 | 7.9 |
| Vanguard 500 | 0.32 | 0.30 | 17.6 |
Three quick points:
- It’s easy to disastrously misjudge a fund when you rely on the wrong metrics; we think that arbitrary time periods and returns without consideration of risks are the disastrously wrong metrics.
- It’s not just that funds like Crescent serve their investors better, it’s that funds such as Crescent serve long-term investors decisively better. Over time, they allow their investors to both eat well and sleep well.
- The key is a manager’s willingness to let money walk out the door rather than betray his investors and his standards. In the late 1990s, GMO – a staunchly contrarian bunch who would not bend to the demands of investors blinded by the market’s 50-60% annual gains – lost over half of its assets. Crescent has lost $5 billion. Centaur, Intrepid, Pinnacle – all down by 50% or more all because they’ve refused to sell out to an increasingly narrow, extraordinarily overpriced bull market that’s approaching its eighth year.
Eight years of gains. Wow.
Had I mentioned, per Leuthold, that the only other bull market to reach its eight year anniversary ended in 1929?
Who has served their investors best?
Using Charles’s fund data screener at MFO Premium, I searched among the funds that predominately invest in U.S. equities for those with the highest risk-adjusted returns over the full market cycle.
This table shows the funds with the highest Sharpe ratios, along with supplemental risk-return measures. It’s sorted by Sharpe but I’ve also highlighted the top five funds (more in the case of a tie) in each measure with Vanguard’s Total Stock Market Index added as a sort of universal benchmark.
| Category | Ulcer Index | Sharpe Ratio | Sortino Ratio | Martin Ratio | ||
| Lower is better | Higher | Higher | Higher | |||
| Reynolds Blue Chip Growth | RBCGX | Multi-C Growth | 5.9 | 0.68 | 1.15 | 1.76 |
| Intrepid Endurance | ICMAX | SC Value | 4.6 | 0.64 | 1.13 | 1.68 |
| Monetta Young | MYIFX | Multi-C Core | 10.6 | 0.6 | 0.97 | 0.91 |
| AMG Yacktman Focused | YAFFX | LC Core | 8.4 | 0.58 | 0.97 | 1.16 |
| AMG Yacktman | YACKX | LC Core | 9.2 | 0.57 | 0.94 | 1.01 |
| Parnassus Core Equity | PRBLX | Equity Income | 9.2 | 0.57 | 0.82 | 0.88 |
| Bruce | BRUFX | Flexible Portfolio | 12 | 0.56 | 0.81 | 0.57 |
| First Trust Value Line Dividend Index | FVD | Multi-C Value | 12.3 | 0.56 | 0.8 | 0.64 |
| American Century NT Mid Cap Value | ACLMX | Multi-C Value | 11.2 | 0.55 | 0.8 | 0.77 |
| Intrepid Capital | ICMBX | Flexible Portfolio | 6.3 | 0.55 | 0.82 | 0.94 |
| Parnassus Endeavor | PARWX | Multi-C Core | 10.9 | 0.55 | 0.86 | 0.94 |
| Prospector Opportunity | POPFX | Mid-Cap Core | 8.6 | 0.55 | 0.83 | 0.86 |
| FPA Crescent | FPACX | Flexible Portfolio | 7.9 | 0.54 | 0.77 | 0.72 |
| Vanguard Dividend Growth | VDIGX | Equity Income | 11 | 0.54 | 0.78 | 0.66 |
| American Century Mid Cap Value | ACMVX | Multi-C Value | 11.4 | 0.53 | 0.77 | 0.73 |
| BBH Core Select | BBTEX | LC Core | 9.4 | 0.53 | 0.77 | 0.76 |
| Marsico Flexible Capital | MFCFX | Flexible Portfolio | 13.5 | 0.52 | 0.8 | 0.65 |
| Nicholas Equity Income | NSEIX | Equity Income | 10.8 | 0.52 | 0.77 | 0.73 |
| Centaur Total Return | TILDX | Equity Income | 9 | 0.51 | 0.8 | 0.79 |
| PRIMECAP Odyssey Aggressive Growth | POAGX | Mid-Cap Growth | 15.8 | 0.51 | 0.79 | 0.66 |
| Principal MidCap | PMBPX | Multi-C Growth | 13.6 | 0.51 | 0.73 | 0.62 |
| Fidelity Small Cap Discovery | FSCRX | SC Core | 11.5 | 0.5 | 0.76 | 0.94 |
| Nicholas | NICSX | Multi-C Growth | 13 | 0.5 | 0.73 | 0.65 |
| Pioneer Fundamental Growth | PIGFX | LC Growth | 11.6 | 0.5 | 0.75 | 0.62 |
| American Century Equity Income | TWEIX | Equity Income | 11.1 | 0.48 | 0.68 | 0.5 |
| For comparison | ||||||
| Vanguard Total Stock Market | VTSMX | 17 | 0.32 | 0.46 | 0.32 | |
Things that stand out:
- Small, independent firms dominate the list. The ten largest fund complexes account for about two-thirds of the industry’s $18 trillion in assets. And yet, between them, they managed to produce two or three funds (depending on how you think about Primecap) on the list. American Century, a mid-sized firm, managed three. Intrepid, Nicholas, Parnassus and Yacktman each appeared twice and most appeared frequently on our top 50 list.
- Active managers dominate the list. Only one index fund finished among the top 25. Only seven of the top 50 funds are passive products. If you sort by our most risk-sensitive measure, the Ulcer Index, only three passive products place in the top 50. Apparently “fully invested all the time” costs more than low fees save.
- At most this is a place to start, not a place to end your inquiries. There are some truly excellent funds on the list and some whose presence might well be seriously misleading. Reynolds Blue Chip Growth, for instance, benefits a great deal by its decision to go entirely to cash before the market crashed in 2007. It outperformed its peers by 36% in the downturn but, other than for that one fortuitous move, has mostly trailed them in measures of both risk and return before and since.
Bottom line: The stock market, like war, is famous for “Months of boredom punctuated by moments of terror.” It’s those “moments of terror” that you’ve got to watch out for. That means you must look at how a manager serves you in both periods rather than limiting yourself to the “what have you done for me lately?” mindset.
My colleague Charles Boccadoro has been poring over oceans of data available through our premium fund screener. In the following story, he looks beyond the realm of individual funds to look for which fund families, including some fascinating smaller entrants, get it right most consistently.
Fund Family Scorecard
 We started looking at fund family performance two years ago, first in June 2014 commentary with How Good Is Your Fund Family?, and then An Update in May 2015.
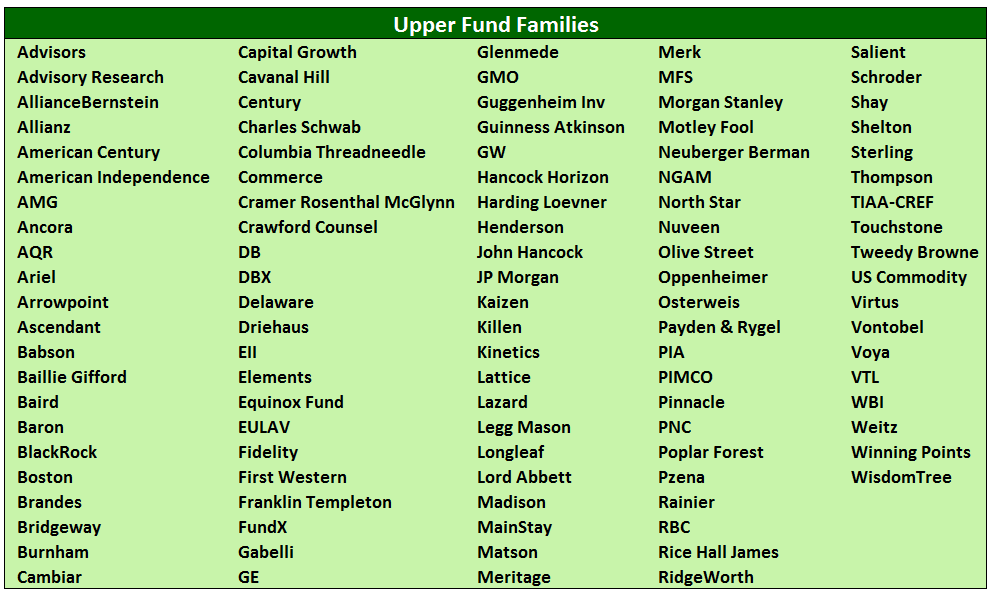
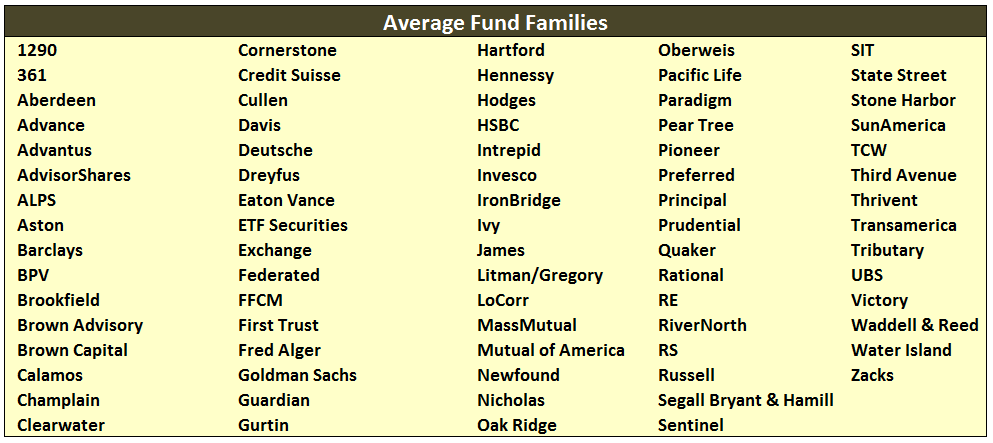
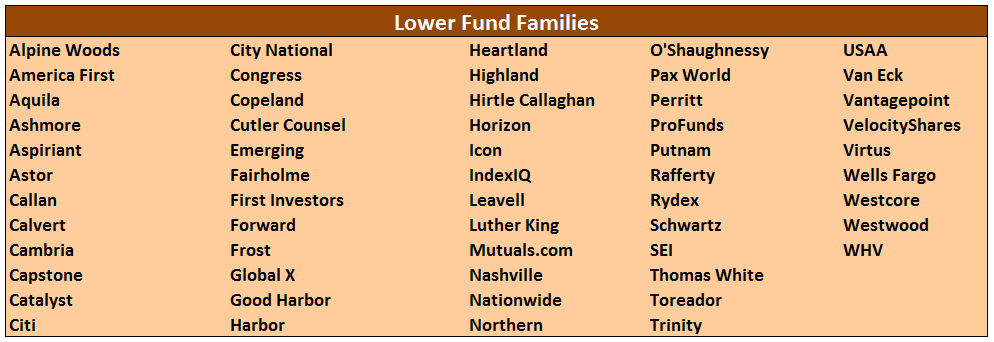
Below please find our MFO Family Fund Scorecard for May 2016, which reflects fund performance through 1st quarter. As a reminder, the card measures how well each fund in a family has performed against its peers since inception (or at least back to January 1960, which starts our Lipper database). Performance is absolute total return, reflecting reinvested dividends, but inclusive of fees and maximum front load, if applicable. The card groups families by quintile. (Download pdf version here.)
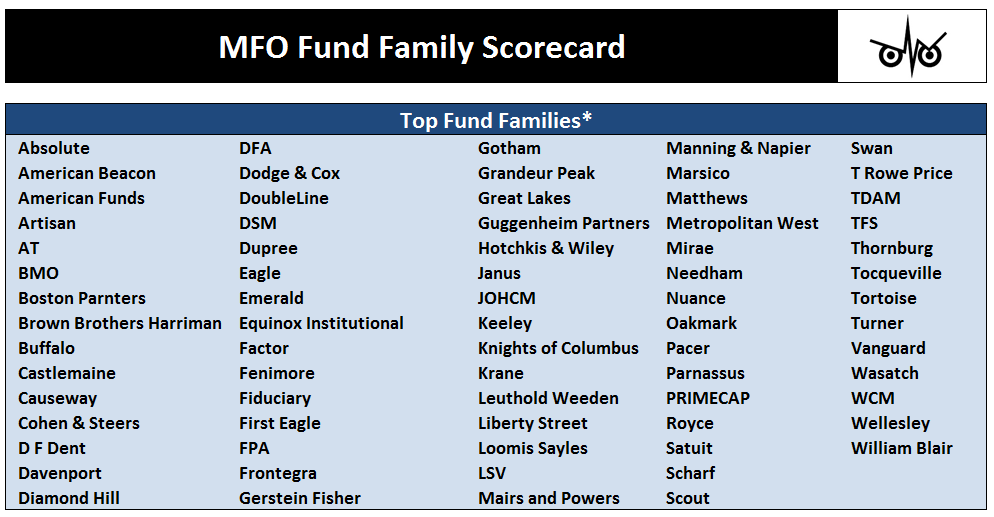
Some changes to methodology since last year:
- Categories now reflect those used by Lipper versus Morningstar, as discussed in Comparing Lipper Ratings. Similarly, all categories except money market are included, even so-called trading categories.
- Reduced from five to three the number of funds required to comprise a “fund family.” These changes respond to reader feedback from last year’s score card (eg., Where’s PRIMECAP?).
- Reduced from three years to just three months the minimum age for evaluation. Reasoning here being the desire to get heads-up of which young families are beating their peers out of the gate (eg., Grandeur Peak).
The result is about 400 “fund families,” or more precisely fund management companies; distilled from the 9,350 funds overall, oldest share class only.
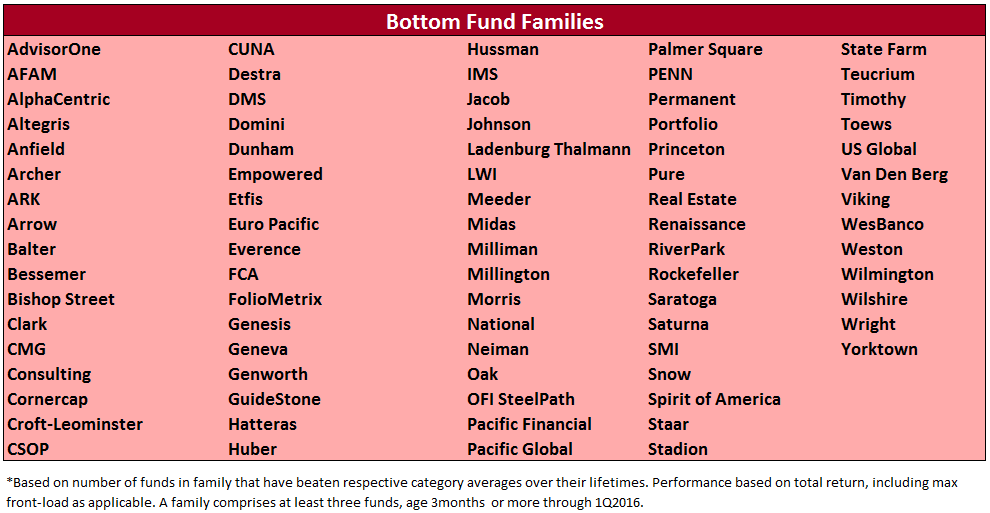
We recognize the card is flawed from the start. Results can be skewed by multiple factors, including survivorship-bias, share class differences, “improper” categorization, adviser and fund ownership changes, multiple sub-advisers, and inconsistent time frames … three months is too short to matter, lifetime is too long to care. Flaws notwithstanding, there is value in highlighting families that, for example, have not had a single fund beat its category average since inception. Like our legacy Three Alarm designation, prospective investors should ask: Why is that?
Take Saratoga Capital Management who is celebrating 20 years and offers a line-up of mutual funds as “The Portfolios of the Saratoga Advantage Trust.” From its brochure: “There are over 22,000 investment management firms in the United States. How do you choose the right one? Research, research and more research.” Fourteen of the funds offered in its line-up are managed by Saratoga itself. Average age: 15.6 years. How many have beaten average return in their respective categories? None. Zero. 0.

Fact is all seventeen funds in the Saratoga Advantage line-up have underperformed category average since inception. Why is that?
On a more positive note, a closer look at a couple groupings …
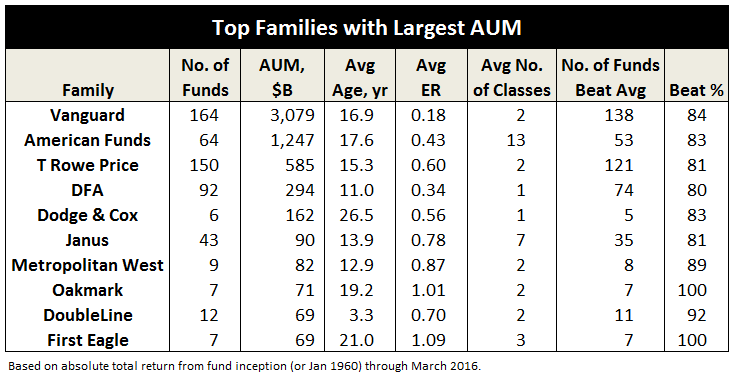
Good to see: Vanguard heads list of Top Families with Largest Assets Under Management (AUM), along with other shareholder friendly firms, like Dodge & Cox.
 And, a nod to the young and unbeaten … a short list of top families where every fund beats its category average.
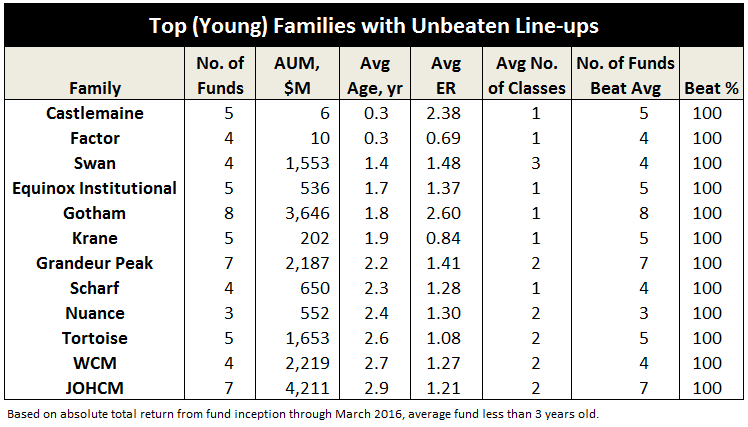
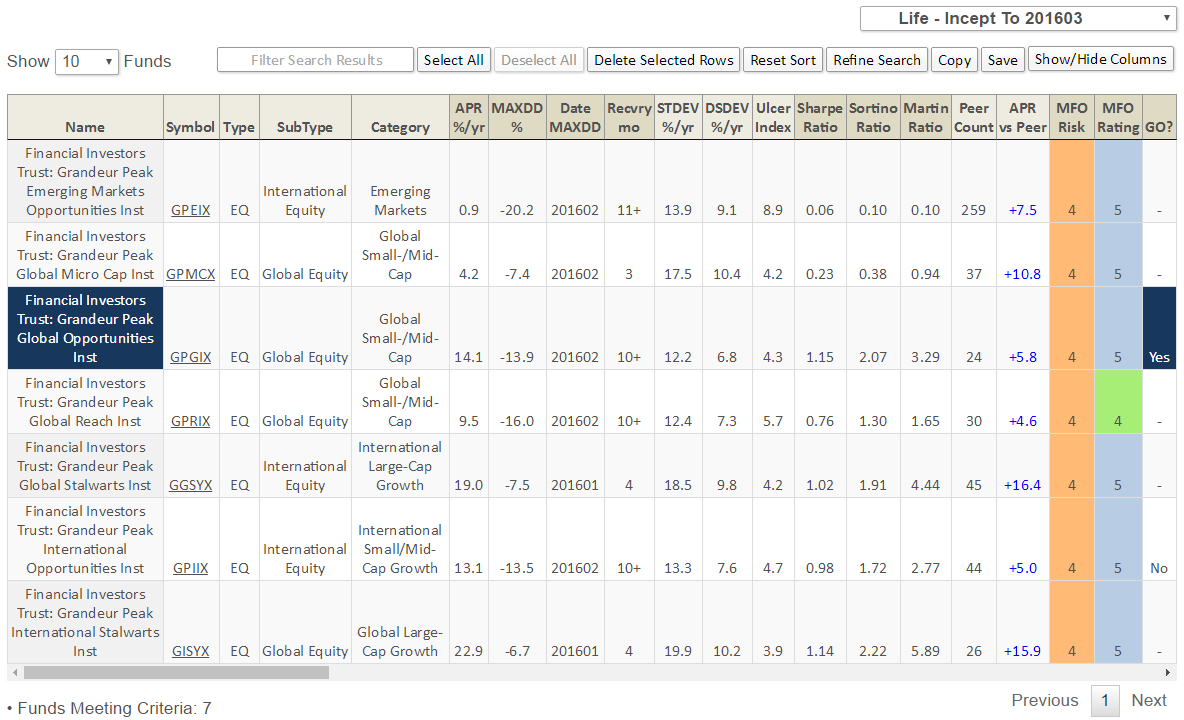
Gotham is led by renowned investor Joel Greenblatt. As for Grandeur Peak, David has been an outspoken champion since its inception. Below are its MFO Ratings (click image to enlarge):
MFO Fund Family Scorecard will soon be a regular feature on our Premium site, updated monthly, with downloadable tables showing performance and fund information for all families, like average ER, AUM, load, and shares classes.
All That Glitters …
By Edward Studzinski
One should forgive one’s enemies, but not before they are hanged.
Heinrich Heine
So, we are one-third through another year, and things still continue to be not as they should be, at least to the prognosticators of the central banks, the Masters of the Universe on Wall Street, and those who make their livings reporting on same, at Bubblevision Cable and elsewhere. I am less convinced than I used to be that, for media commentators, especially on cable, the correct comparison is to The Gong Show. More often than not, I think a more appropriate comparison is to the skit performed by the late, great, and underappreciated Ernie Kovacs, “The Song of the Nairobi Trio.”
And lest I forget, this is the day after another of Uncle Warren’s Circuses, held in Omaha to capacity crowds. An interesting question there is whether, down the road some fifty years, students of financial and investing history discover after doing the appropriate first order original source research, that what Uncle Warren said he did in terms of his investment research methodology and what he in reality did, were perhaps two different things. Of course, if that were the case, one might wonder how all those who have made almost as good a living selling the teaching of the methodology, either through writing or university programs, failed to observe same before that. But what the heck, in a week where the NY Times prints an article entitled “Obama Lobbies for His Legacy” and the irony is not picked up on, it is a statement of the times.
 The best performing asset class in this quarter has been – gold. Actually the best performing asset class has been the gold miners, with silver not too far behind. We have had gold with a mid-teen’s total return. And depending on which previous metals vehicle you have invested in, you may have seen as much as a 60%+ total return (looking at the germane Vanguard fund). Probably the second best area generically has been energy, but again, you had to choose your spots, and also distinguish between levered and unlevered investments, as well as proven reserves versus hopes and prayers.
I think gold is worth commenting on, since it is often reviled as a “barbarous relic.” The usual argument against it that it is just a hunk of something, with a value that goes up and down according to market prices, and it throws off no cash flow.
That argument changes of course in a world of negative interest rates, with central banks in Europe and one may expect shortly, parts of Asia, penalizing the holding of cash by putting a surcharge on it (the negative rate).
A second argument against it is that is often subject to governmental intervention and political manipulation. A wonderful book that I still recommend, and the subjects of whom I met when I was involved with The Santa Fe Institute in New Mexico, is The Predictors by Thomas A. Bass. A group of physicists used chaos theory in developing a quantitative approach to investing with extensive modeling. One of the comments from that book that I have long remembered is that, as they were going through various asset and commodity classes, doing their research and modeling, they came to the conclusion that they could not apply their approach to gold. Why? Because looking at its history of price movements, they became convinced that the movements reflected almost always at some point, the hand of government intervention. An exercise of interest would be to ponder how, over the last ten years, at various points it had been in the political interests of the United States and/or its allies, that the price of gold in relation to the price of the dollar, and those commodities pegged to it, such as petroleum, had moved in such a fashion that did not make sense in terms of supply and demand, but made perfect sense in terms of economic power and the stability of the dollar. I would suggest, among other things, one follow the cases in London involving the European banks that were involved in price fixing of the gold price in London. I would also suggest following the timetable involving the mandated exit of banks such as J.P. Morgan from commodity trading and warehousing of various commodities.
Exeunt, stage left. New scenario, enter our heroes, the Chinese. Now you have to give China credit, because they really do think in terms of centuries, as opposed to when the next presidential or other election cycle begins in a country like the U.S. Faced with events around 2011 and 2012 that perhaps may have seemed to be more about keeping the price of gold and other financial metrics in synch to not impact the 2012 elections here, they moved on. We of course see that they moved on in a “fool me once fashion.” We now have a Shanghai metals exchange with, as of this May, a gold price fixing twice a day. In fact, I suspect very quickly we will see whole set of unintended consequences. China is the largest miner of gold in the world, and all of its domestic supply each year, stays there. As I have said previously in these columns, China is thought to have the largest gold reserves in the world, at in excess of 30,000 tons. Russia is thought to be second, not close, but not exactly a slouch either.
So, does the U.S. dollar continue as the single reserve currency (fiat only, tied solely to our promise to pay) in the world? Or, at some point, does the Chinese currency become its equal as a reserve currency? What happens to the U.S. economy should that come to pass? Interesting question, is it not? On the one hand, we have the view in the U.S. financial press of instability in the Chinese stock market (at least on the Shanghai stock exchange), with extreme volatility. And on the other hand, we have Chinese companies, with some degree of state involvement or ownership, with the financial resources to acquire or make bids on large pieces of arable land or natural resources companies, in Africa, Australia, and Canada. How do we reconcile these events? Actually, the better question is, do we even try and reconcile these events? If you watch the nightly network news, we are so self-centered upon what is not important or critical to our national survival, that we miss the big picture.
Which brings me to the question most of you are asking at this point – what does he really think about gold? Some years ago, at a Grant’s Interest Rate Observer conference, Seth Klarman was one of the speakers and was asked about gold. And his answer was that, at the price it was at, they wanted to have some representation, not in the physical metal itself, but in some of the gold miners as a call option. It would not be more than 5% of a portfolio so that in the event it proved a mistake, the portfolio would not be hurt too badly (the opposite of a Valeant position). If the price of gold went up accordingly, the mine stocks would perhaps achieve a 5X or 10X return, which would help the overall returns of the portfolio (given the nature of events that would trigger those kinds of price movements). Remember, Klarman above all is focused on preserving capital.
And that is how I pretty much view gold, as I view flood insurance or earthquake insurance. Which, when you study flood insurance contracts you learn does not just cover flooding but also cases of extreme rain where, the house you built on the hill or mountain goes sliding down the hill in a massive mudslide. So when the catastrophic event can be covered for a reasonable price, you cover it (everyone forgets that in southern Illinois we have the New Madrid fault, which the last time it caused a major quake, made recent California or Japanese events seem like minor things). And when the prices to cover those events become extreme, recognizing the extreme overvaluation of the underlying asset, you should reconsider the ownership (something most people with coastal property should start to think about).
Twenty-odd years ago, when I first joined Harris Associates, I was assigned to cover DeBeers, the diamond company, since we were the largest shareholders in North America. I knew nothing about mining, and I knew nothing about diamonds, but I set out to learn. I soon found myself in London and Antwerp studying the businesses and meeting managements and engineers. And one thing I learned about the extractive industries is you have to differentiate the managements. There are some for whom there is always another project to consume capital. You either must expand a mine or find another vein, regardless of what the price of the underlying commodity may be (we see this same tendency with managements in the petroleum business). And there are other managements who understand that if you know the mineral is there sitting in the ground, and you have a pretty good idea of how much of it is there, you can let it sit, assuming a politically and legally stable environment, until the return on invested capital justifies bringing it out. For those who want to develop this theme more, I suggest subscribing to Grant’s Interest Rate Observer and reading not just its current issues but its library of back issues. Just remember to always apply your own circumstances rather than accept what you read or are told.
Drafting a Fixed Income Team
By Leigh Walzer
It is May 1. The time of flowers, maypoles and labor solidarity.
For football fans it is also time for that annual tradition, the NFL draft. Representatives of every professional football team assemble in Chicago and conspire to divide up the rights to the 250 best college players. The draft is preceded by an extensive period of due diligence.
Some teams are known to stockpile the best available talent. Other teams focus on the positions where they have the greatest need; if there are more skilled players available at other positions they try to trade up or down to get the most value out of their picks. Others focus on the players who offer the best fit, emphasizing size, speed, precision, character, or other traits.
The highly competitive world of professional sports offers a laboratory for investors selecting managers. Usually at Trapezoid we focus on finding the most skillful asset managers, particularly those with active styles who are likely to give investors their money’s worth. In the equity world, identifying skill is three quarters of the recipe for investment success.
But when we apply our principles to fixed income investing, the story is a little different. The difference in skill between the top 10% and bottom 10% is only half as great as for the equity world. In other words, time spent looking for the next Jeff Gundlach is only half as productive as time spent looking for the next Bill Miller.
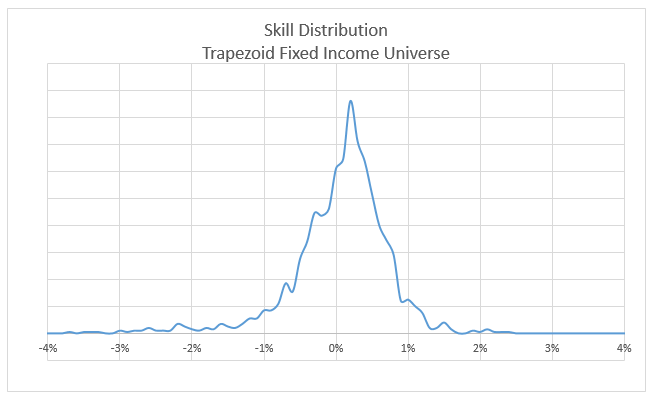
Exhibit I
That assumes you can identify the good fixed income managers. Allocators report the tools at their disposal to analyze fixed income managers are not as good as in equities.
Some people argue that in sports, as in investing, the efficient market hypothesis rules. The blog Five-thirty-eight argues that No Team Can Beat the Draft. General managers who were seen as geniuses at one point in their career either reverted to the mean or strayed from their discipline.
Readers might at this point be tempted to simply buy a bond ETF or passive mutual fund like VTBXX. Our preliminary view is that investors can do better. Many fixed income products are hard to reproduce in indices; and the expense difference for active management is not as great. We measure skill (see below) and estimate funds in the top ten percentile add approximately 80 basis points over the long haul; this is more than sufficient to justify the added expense.
However, investors need to think about the topic a little differently. In fixed income, skillful funds exist but they are associated with a fund which may concentrate in a specific sector, duration, and other attributes. It is often not practical to hedge those attributes – you have to take the bundle. Below, we identify n emerging market debt fund which shows strong skill relative to its peers; but the sector has historically been high-risk and low return which might dampen your enthusiasm. It is not unlike the highly regarded quarterback prospect with off-the-field character issues.
When selecting managers, skill has to be balanced against not only the skill and the attractiveness of the sector but also the fit within a larger portfolio. We are not football experts. But we are sympathetic to the view that the long term success of franchises like the New England Patriots is based on a similar principle: finding players who are more valuable to them than the rest of the league because the players fit well with a particular system.
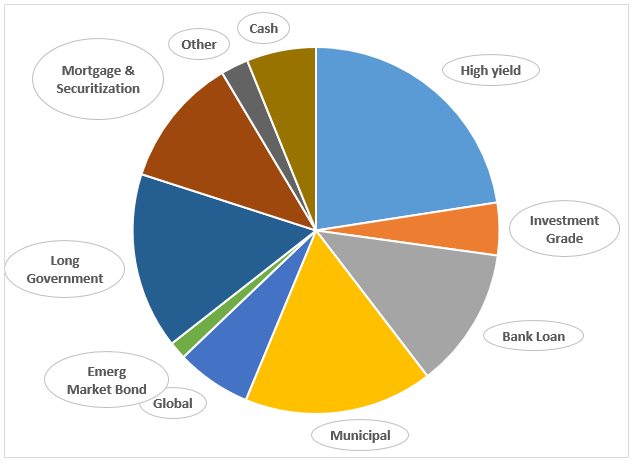
To illustrate this point, we constructed an idealized fixed income portfolio. We identified 22 skilled bond managers and let our optimizer choose the best fund allocation. Instead of settling upon the manager with the best track record or highest skill, the model allocated to 8 different funds. Some of those were themselves multi-sector funds. So we ended up fairly diversified across fixed income sectors.
Exhibit I
Sector Diversification in one Optimized Portfolio
Characteristics of a Good Bond Portfolio
We repeated this exercise a number of times, varying the choice of funds, the way we thought of skill, and other inputs. We are mindful that not every investor has access to institutional classes and tax-rates vary. While the specific fund allocations varied considerably with each iteration, we observed many similarities throughout.:
BUSINESS CREDIT: Corporate bonds received the largest allocation; the majority of that went to high yield and bank loans rather than investment grade bonds
DON’T OVERLOAD ON MUNIs. Even for taxable investors, municipal funds comprised only a minority of the portfolio.
STAY SHORT: Shorter duration funds were favored. The example above had a duration of 5.1 years, but some iterations were much shorter
DIVERSIFY, UP TO A POINT: Five to eight funds may be enough.
Bond funds are more susceptible than equity funds to “black swan” events. Funds churn out reliable yield and NAV holds steady through most of the credit cycle until a wave of defaults or credit loss pops up in an unexpected place. It is tough for any quantitative due diligence system to ferret out this risk, but long track records help. In the equity space five years of history may be sufficient to gauge the manager’s skill. But in fixed income we may be reluctant to trust a strategy which hasn’t weathered a credit crunch. It may help to filter out managers and funds which weren’t around in 2008. Even then, we might be preparing our portfolio to fight the last war.
Identifying Skilled Managers
The recipe for a good fixed income portfolio is to find good funds covering a number of bond sectors and mix them just right. We showed earlier that fixed income manager skill is distributed along a classic bell curve. What do we mean by skill and how do we identify the top 10%?
The principles we apply in fixed income are the same as for equities but the methodology is the same. While the fixed income model is not yet available on our website, readers of Mutual Fund Observer may sample the equity model by registering at www.fundattribution.com. We value strong performance relative to risk. While absolute return is important, we see value in funds which achieve good results while sitting on large cash balances – or with low correlation to their sectors. And we look for managers who have outperformed their peer group -or relevant indices – preferably over a long period of time. We also consider the trend in skill.
For fixed income we currently rely on a fitted regression model do determine skill. A few caveats are in order. This approach isn’t quite as sophisticated as what we do with equity funds. We don’t use the holdings data to directly measure what the manager is up to, we simply infer it. We don’t break skill down into a series of components. We rely on gross performance of subsectors rather than passive indices. We haven’t back-tested this approach to see whether it makes relevant predictions for future periods. And we don’t try to assess the likelihood that future skill will exceed expenses. Essentially, the funds which show up well in this screen outperformed a composite peer group chosen by an algorithm over a considerable period of time. While we call them skillful, we haven’t ruled out that some were simply lucky. Or, worse, they could be generating good performance through a strategy which back to bite them in the long term. For all the reasons noted earlier, quantitative due diligence of portfolio managers has limitations. Ultimately, it pays to know what is inside the credit “black box”
Exhibit II lists some of the top-ranking funds in some of the major fixed income categories. We culled these from a list of 2500 fixed income funds, generally seeking top-decile performance, AUM of at least $200mm, and sufficient history with the fund and manager.
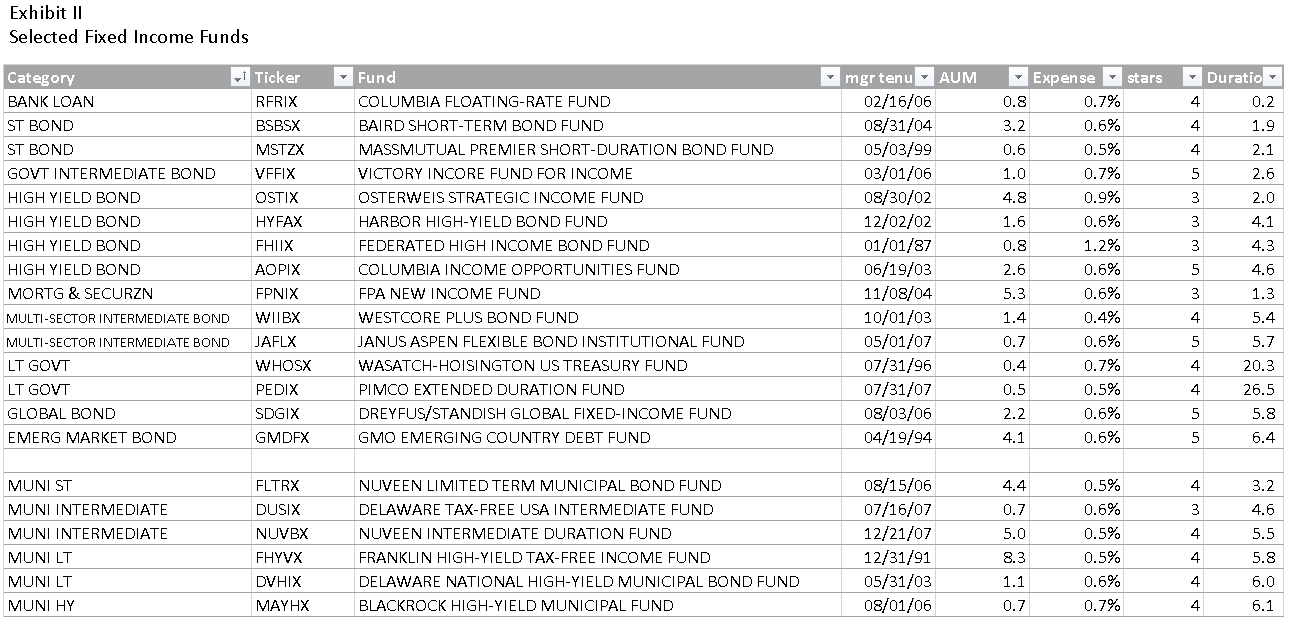
We haven’t reviewed these funds in detail. Readers with feedback on the list are welcome to contact me at [email protected]
From time to time, the media likes to anoint a single manager as the “bond king.” But we suggest that different shops seem to excel in different sectors. Four High Yield funds are included in the list led by Osterweis Strategic Income Fund (OSTIX). In the Bank Loan Category several funds show better but Columbia Floating-Rate Fund (RFRIX) is the only fund with the requisite tenure. The multi-sector funds listed here invest in corporate, mortgage, and government obligations. We are not familiar with Wasatch-Hoisington US Treasury Fund (WHOSX), but it seems to have outperformed its category by extending its duration.
FPA New Income Fund (FPNIX) is categorized with the Mortgage Funds, but 40% of its portfolio is in asset-backed securities including subprime auto. Some mortgage-weighted funds with excellent five year records who show up as skillful but weren’t tested in the financial crisis or had a management change were excluded. Notable among those is TCW Total Return Bond Fund (TGLMX).
Skilled managers in the municipal area include Nuveen (at the short to intermediate end), Delaware, Franklin, and Blackrock (for High Yield Munis).
Equity
Style diversification seems less important in the equity area. We tried constructing a portfolio using 42 “best of breed” equity funds from the Trapezoid Honor Roll. Our optimizer proposed investing 80% of the portfolio in the fund with the highest Sharpe Ratio. While this seems extreme, it does suggest equity allocators can in general look for the “best available athlete” and worry less about portfolio fit.
Bottom Line
Even though fixed income returns fall in a narrower range than their equity counterparts, funds whose skill justify their expense structure are more abundant. Portfolio fit and sector timeliness sometimes trumps skill; diversification among fixed income sectors seems to be very important; and the right portfolio can vary from client to client. If in doubt, stay short. Quantitative models are important but strive to understand what you are investing in.
 What’s the Trapezoid story? Leigh Walzer has over 25 years of experience in the investment management industry as a portfolio manager and investment analyst. He’s worked with and for some frighteningly good folks. He holds an A.B. in Statistics from Princeton University and an M.B.A. from Harvard University. Leigh is the CEO and founder of Trapezoid, LLC, as well as the creator of the Orthogonal Attribution Engine. The Orthogonal Attribution Engine isolates the skill delivered by fund managers in excess of what is available through investable passive alternatives and other indices. The system aspires to, and already shows encouraging signs of, a fair degree of predictive validity.
The stuff Leigh shares here reflects the richness of the analytics available on his site and through Trapezoid’s services. If you’re an independent RIA or an individual investor who need serious data to make serious decisions, Leigh offers something no one else comes close to. More complete information can be found at www.fundattribution.com. MFO readers can sign up for a free demo.
The Alt Perspective: Commentary and news from DailyAlts.
 April has come to a close and another Fed meeting has passed without a rate rise. At the same time, markets have continued to rally with the equity market, as measured by the S&P 500 Index, gaining another 0.39% in April, bringing the 3-month total return to 7.05%. Bonds also rallied as the Barclays U.S. Aggregated Bond Index gained 0.38% in April, and 2.02% over the past 3-months. Not bad for traditional asset classes.
Strong rallies are periods when alternative strategies lag the broad markets given that they are often hedged in their exposure to traditional asset classes. And this is what we saw in April, with managed futures funds dropping 1.76%, bear market funds losing 1.36% and market neutral funds shedding 0.40%. At the same time, long/short equity funds eked out a gain of 0.06%, multi-alternative funds gained 0.29%, non-traditional bond funds gained 1.54% and multi-currency funds added 1.57%. Not a stellar month for alternative funds, but investors can’t always make money in all areas of their portfolio – diversification has its benefits as well as its drawbacks.
News Highlights from April
- Highland Capital, who had originally filed to launch a series of 17 alternative ETFs, decided to take a different course of action and shut down the 3 hedge fund replication ETFs it launched less than a year ago. It’s unlikely any of the remaining 14 funds will see the bid or ask of a trade.
- Morningstar has made some modifications to its alternative fund classifications, creating two new alternative fund categories: Long/Short Credit and Option Writing. The changes went into effect on April 29.
- Alternative fund (mutual funds and ETFs) inflows continued to be positive in March, with nearly $2.1 billion of new assets going into the category. Managed futures funds gained just over $1 billion in assets and multi-alternative funds picked up nearly $500 million, but the big gainer was volatility based funds which added $1.5 billion as a category.
- Both Calamos and Catalyst hit the market this month with new alternative mutual funds what were converted from hedge funds. Calamos launched a global long/short equity fund managed by Phineus Partners, a firm they acquired in 2015, while Catalyst launched a hedged equity (with an alpha overlay) fund (this one is a bit more complicated on the surface) that is sub-advised by Millburn Ridgefield.
- Fidelity Investments did an about face on more than $2 billion of assets allocated to two multi-alternative mutual funds that were set up specifically, and exclusively, for their clients. One fund was managed by Blackstone, while the other by Arden Asset Management (which was recently acquired by Aberdeen).
Potential Regulatory Changes
One of the more serious issues currently on the table is a proposal by the Securities and Exchange Commission (SEC) to limit the use of derivatives and leverage in mutual funds. Keith Black, Managing Director of Curriculum and Exams for the CAIA Association, wrote a good piece for Pensions & Investments that covers some of the key issues. In the article, Black states that if the regulations are passes as is, it will “substantially alter the universe of alternative strategy funds available to investors.” While not expected to be implemented in its current form, fund managers are nevertheless concerned. The limitations proposed by the SEC would severely constrain some fund managers in their ability to implement the investment strategies they use today, and that would not be limited just to managers of alternative funds.
Greater levels of transparency and more sensible reporting are certainly needed for many funds. This is an initiative that funds should undertake themselves, rather than wait for the regulators to force their hand. But greater limits on the use of derivatives and leverage would, in many cases, go against the grain of benefiting investors.
Observer Fund Profiles: ARIVX and TILDX
Each month the Observer provides in-depth profiles of between two and four funds. Our “Most Intriguing New Funds” are funds launched within the past couple years that most frequently feature experienced managers leading innovative newer funds. “Stars in the Shadows” are older funds that have attracted far less attention than they deserve.
Aston River Road Independent Value (ARIVX). If James Brown is the godfather of soul, then Eric Cinnamond might be thought the godfather of small cap, absolute value investing. He’s been at it since 1996 and he suspects that folks who own lots of small cap stocks today are going to want to sell them to him, for a lot less than they paid, sooner rather than later.
Centaur Total Return (TILDX). If Steppenwolf (“I like smoke and lightnin’ / Heavy metal thunder”) was born to be wild, then Zeke Ashton was born to be mild (“thoughtless risk now damages future performance”). While Steppenwolf’s name is cool, Mr. Ashton’s combination of blue chips, cash and calls has been far more profitable (and, of course, prudent).
Launch Alert: LMCG International Small Cap
LMCG International Small Cap (ISMRX/ISMIX) launched on April 1, 2016 but it’s actually a new platform for an institutional “collective trust” that’s been in operation since August 26, 2010.
LMCG Investments is a Boston-based adviser with about $7 billion of mostly institutional and high net worth individual assets. They were once “Lee Munder Capital Group” and they do subadvise some retail funds but they are not linked to the old Munder family of funds.
The fund invests primarily in international small cap stocks from developed markets, though they can invest small slices in both the US and the emerging markets. “Small cap” translates to market caps between $50 million and $7 billion with the current weighted capitalization in the portfolio at $2.9 billion. They target companies with “good growth prospects and high quality of earnings,” then buy them when they’re attractively valued. They position themselves as a quant fund with a fundamentalist’s bias; that is, they’ve constructed screens to help them identify the same attributes that other good fundamental, bottoms-up guys look for. They screen 2,500 stocks daily and are hopeful that the quantitative discipline helps them avoid a lot of human errors such as style drift and overcommittment to particular stocks. Eventually the portfolio will hold between 90-125 more-or-less equally weighted stocks.
Four things stand out about the fund:
1. It’s cheap.
Morningstar’s benchmarking data is too cute by half since they provide separate group benchmarks for load and no-load funds, institutional and non-institutional funds and both category average and “Fee Level Comparison Group Median” numbers. In general, you’d expect to pay somewhere between 1.35% and 1.50% for a fund in this category. With an opening e.r. of 1.10%, LMCG will be one of the four cheapest options for retail investors.
2. It’s in an arena where active managers thrive.
Standard & Poor’s SPIVA scorecards track the prospect that an active manager will outperform his benchmark. In domestic small cap core funds, the chance is about 1 in 7 over a five year period. For international small cap core, though, the chance is 1 in 2 and that’s despite the generally high expenses that the average fund carries. More to the point, funds like Vanguard FTSE All-World ex-US Small Cap Index (VFSVX) are distinctly poor performers, trailing 90% of their peers over the past three- and five-year periods.
3. It’s got an experienced management team.
The fund is managed by Gordon Johnson, who has 23 years of experience managing global portfolios and developing quantitative investment models. Before joining LMCG in 2006 he had six years at Evergreen Investments and, before that, managed the Colonial Fund. (And, like me, he has a PhD from UMass.) Co-manager Shannon Ericson joined LMCG at the same time, also from Evergreen, and has had stints at Independence International Associates and Mellon Trust. Together they also co-manage LMCG Global Market Neutral Fund, ASTON/LMCG Emerging Markets and PACE International Emerging Markets. They’re assisted by Daniel Getler, CFA.
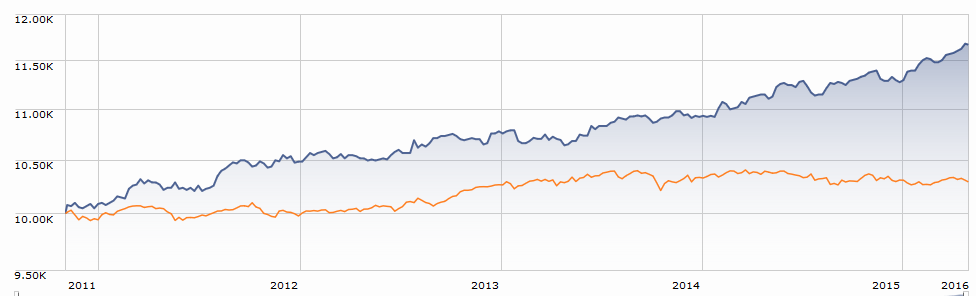
4. It’s got a strong track record.
The predecessor fund has been around since 2010 and it has outperformed its peer group and its benchmark index in each of the five calendar years of its existence.
It’s particularly interesting that the fund has been more than competitive in both up- and down-market years.
The fund’s initial expense ratio is 1.10%, after waivers, on Investor class shares and 0.85% on Institutional ones. The minimum initial investment is $2500 for Investor shares and $100,000 for the others.
 The ISMRX homepage is, understandably, thin on the content right now. The other funds’ homepages (Global Multicap and Global Market Neutral) aren’t exactly founts of information, but they do offer the prospect for a factsheet, manager Q&A and such as forthcoming. The LMCG homepage does offer access to their monthly commentary, LMCG Unfiltered. It’s short, clear and interesting. There was an note in their March 2016 issue that over the past eight years, US corporations have accounted for a slightly higher percentage of global corporate earnings (up from 36% in 2007 and 41% in 2015) but a substantially higher percentage of global stock market capitalization (from 47% to 59%). That suggests that the US market has been underwritten by the willingness of international investors to overpay for the safe haven of US markets and raises intriguing questions about what happens when there’s no longer a safe haven premium.
Funds in Registration
Before mutual funds can offered for sale to the public, their prospectuses and related documents need to be subject to SEC review for 75 days. During the so-called “silent period,” the prospectus is available for public (and regulator) review, but the advisers are not permitted to discuss them. We try to track down no-load retail funds and actively-managed ETFs in registration that you might want to put on your radar.
There are only five funds in registration now, most set to launch by the end of June.
While it’s not likely to lead to scintillating cocktail party conversation, DoubleLine Ultra Short Bond Fund is apt to be really solid and useful. And it is run by Bonnie Baha, who once asked The Jeffrey why he was such a jerk.
AMG SouthernSun Global Opportunities Fund is a sort of global version of SouthernSun Small Cap (SSSFX). Okay, it’s a sort of smid-cap global version of Small Cap. SSSFX tends to be a high-beta fund that captures a lot more of the upside than its peers; that boldness has hurt it lately but is has serious charms.
Manager Changes
We’ve track down rather more than 55 manager changes this month, including maternity leaves, sabbaticals, retirements and quietly unexplained departures. The most noteworthy might be the departure of Daniel Martino from T. Rowe Price New America Growth Fund (PRWAX).
Updates
Welcoming Bob Cochran
It is with undisguised, and largely unrestrained, glee that we announce the addition of Robert Cochran to the Mutual Fund Observer, Inc. Board of Directors. Bob is the lead portfolio manager, Chief Compliance Officer, and a principal of PDS Planning in Columbus, Ohio.
 We’ve been following Bob’s posts for the past 10 or 15 years where, as BobC, he’s been one of the most respected, thoughtful and generous contributors to our discussion board and the FundAlarm’s before that. The Observer aspires to serve two communities: the small, independent managers who are willing to stray from the herd and who are passionate about what they do (rather than about how much they can make) and the individual investors who deserve better than the timid, marketing-driven pap they’re so often fed. As we begin our sixth year, we thought that finding someone who is both active in the industry and broad in mind and spirit would allow us to serve folks better.
We believe that Bob is a great fit there. He’s been a financial professional for the past 31 years (he earned his CFP the same year I earned my PhD), writes thoughtfully and well, and had a stint teaching at Humboldt State in Arcata, a lovely town in northern California. He also serves on the Board for the Columbus Symphony (and was formerly their principal bassoonist) and Neighborhood Services, Inc., one of Ohio’s oldest food banks. Had I mentioned he’s prepping a national display garden? Me, I mostly buy extra bags of shredded hardwood mulch to bury my mistakes.
We are delighted that Bob agreed to join us, hopeful that we’ll be able to chart a useful course together, and grateful to him, and to you all, for your faith in us.
On being your own worst enemy
Chuck Jaffe, in “This is why mutual fund managers can’t beat a stock index more often” (April 14, 2016), meditated a bit upon the question of whether index funds and sliced bread belong in the same pantheon. He notes that while the easy comparisons favor index funds, there’s a strongly countervailing flow that starts with the simple recognition that 50% of funds must, by definition, underperform the group average. The question is, can you find the other 50%. Research by several large firms points in that direction. Fidelity reports that low-cost funds from large fund complexes are grrrrrrreat! American Funds reports that low cost funds with high levels of manager ownership are at least as great. My take was simpler: you need to worry less about whether your active fund is going to trail some index by 0.9% annually and worry more about whether you will, yet again, insist on being your own worst enemy:
“Your biggest risk isn’t that your manager will underperform, it’s that you’ll panic and do something stupid and self-destructive,” said David Snowball, founder of MutualFundObserver.com. “With luck, if you know what your manager is doing and why she’s doing it and if she communicates clearly and frequently, there’s at least the prospect that you’ll suppress the urge to self-immolation.”
On April 29, 2016, Morningstar added eight new fund categories, bringing their total is 122.The eight are:
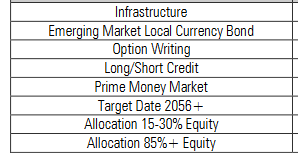
They renamed 10 other categories. The most noticeable will be the replacement of conservative, moderate and aggressive allocation categories with stipulations of the degree of market exposure. The moderate allocation category, once called “balanced,” is now the “Allocation 50-70% Equity” category.
Briefly Noted . . .
With unassailable logic that Aristotle himself would affirm, we learn from a recent SEC filing that “The Aristotle Value Equity Fund has not commenced operations and therefore is currently not available for purchase.”
Effective April 1, 2016, QS Batterymarch Financial Management, Inc. merged with QS Investors, LLC, to form QS Investors, LLC. QS was an independent quant firm purchased, in 2014, by Legg Mason to run their QS Batterymarch funds.
SMALL WINS FOR INVESTORS
AMG SouthernSun Small Cap Fund (SSSFX) reopened to new investors in the first week of April.
On April 7, 2016, the Board of Trustees of Crow Point Defined Risk Global Equity Income Fund (CGHAX/CGHIX) voted to abandon the plan of liquidation for the Fund and continue the Fund’s operations.
The Board of Trustees voted to reduce the expense cap on Dean Mid Cap Value Fund (DALCX) by 1.50% to 1.10%. That includes a small drop in the management fee.
Franklin Biotechnology Discovery Fund (FBDIX) will re-open to new investors May 16, 2016. The fund’s 23% loss in the first four months of 2016 might have created some room for (well, need for) new investors.
RS Partners Fund (RSPFX) reopened to new investors on March 1, 2016, just in case you’d missed it. RS, once Robertson Stephens, has been acquired by Victory Capital, so the fund may be soon renamed Victory RS Partners.
Sequoia Fund (SEQUX) has reopened in hopes of finding new investors. I won’t be one of them. There’s the prospect of a really substantial tax hit this year. In addition, we still don’t know what happened, whether it’s been fixed and whether the folks who left – including the last of the original managers – were the cause of the mess or the scapegoats for it. Until there’s some clarity, I’d be unwilling to invest for the sake of just owning a legendary name.
WCM Investment Management has voluntarily agreed to waive all of its fees and pay all of the operating expenses for WCM Focused Global Growth Fund (WFGGX) and WCM Focused Emerging Markets Fund (WFEMX) from May 1, 2016, through April 30, 2017. “The Advisor will not seek recoupment of any advisory fees it waived or Fund expenses it paid during such period.”
CLOSINGS (and related inconveniences)
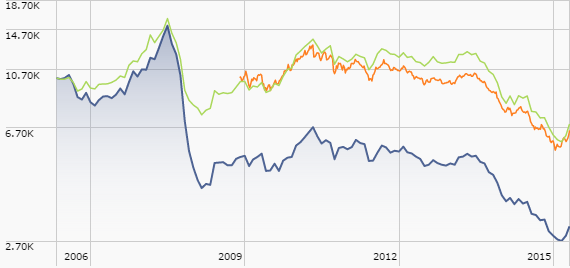
AC Alternatives® Market Neutral Value Fund (ACVQX) will close to new investors on May 25, 2016 except those who invest directly with American Century or through “certain financial intermediaries selected by American Century.” In an exceedingly odd twist, Morningstar describes it as having “average” returns, a fact belied by, well, all available evidence. In addition to beating their peers in every calendar year, the performance gap since inception is pretty substantial:
Folks closed out here and willing to consider an even more explosive take on market-neutral investing might want to look at Cognios Market Neutral Large Cap (COGIX).
Effective April 30, 2016, the Diamond Hill Small-Mid Cap Fund (DHMAX), with $1.8 billion in assets, closed to most new investors.
OLD WINE, NEW BOTTLES
On or about May 31, 2016, each Strategic Advisers® Multi-Manager Target Date Fund becomes a Fidelity Multi-Manager Target Date Fund.
The Primary Trend Fund has become Sims Total Return Fund (SIMFX). Sims Capital Management has been managing the fund since 2003 and just became the adviser, rather than just the sub-adviser. I wish them well, but the fact that they’ve trailed their peers in eight of the past 10 calendar years is going to make it a hard slog.
OFF TO THE DUSTBIN OF HISTORY
Appleton Group Risk Managed Growth Fund (AGPLX) has closed and will be liquidated at the close of business on June 27, 2016.
Aurora Horizons Fund (AHFAX) closed to new purchases on April 22, 2016 and will be liquidating its assets as of the close of business on May 31, 2016. As this alts fund passed its three-year mark, it was trailing 80% of its peers.
BPV Low Volatility Fund (BPLVX) has closed but “will continue to operate until on or about May 31, 2016, when it will be liquidated.” The fund is liquidating just as Morningstar is creating a category to track such option-writing strategies.
The Braver Tactical Opportunity Fund (BRAVX) has closed to new investors and will discontinue its operations effective May 27, 2016. It’s not at all a bad fund, it’s just not magical. Increasingly, it seems like that’s what it takes.
Stepping back from the edge of the grave: On March 30, 2016, the Board of Trustees of Two Roads Trust voted to abandon the plan of liquidation for the Breithorn Long/Short Fund (BRHIX) that was scheduled to occur on or about April 8, 2016.
Fidelity Advisor Short Fixed-Income Fund (FSFAX) is merging into Fidelity Short-Term Bond Fund (FSHBX) on or about July 15, 2016. Their performance over any reasonable time frame is nearly identical and FSHBX is cheaper, so it’s a clear winner for shareholders.
Nuveen Global Growth (NGGAX) and Nuveen Tradewinds Emerging Markets (NTEAX) funds will both be liquidated after the close of business on June 24, 2016.
Oppenheimer Commodity Strategy Total Return Fund (QRAAX) will liquidate on June 29, 2016. While the fund has almost $300 million in assets, its watershed moment might have happened in 2008:
Driven by the adviser’s “its inability to market the Fund and [fact] that it does not desire to continue to support the Fund,” Outfitter Fund (OTFTX) and its fly-fishing logo will liquidate on or about May 26, 2016.
Panther Small Cap Fund (PCGSX) will be liquidated on or about May 16, 2016. Cool name, no assets, quickly deteriorating performance.
Putnam Voyager Fund (PVOYX) is merging into Putnam Growth Opportunities (POGAX) on July 15, 2016. Voyager’s performance was rightly described as “dismal” by Morningstar. Voyager’s manager was replaced in February by Growth Opportunities, after a string of bad bets: in the past six years, he mixed one brilliant year with two dismal ones and three pretty bad ones. He was appointed in late 2008 just before the market blasted off, rewarding all things risky. As soon as that phase passed, Voyager sank in the mud. To their credit, Voyager’s investors stayed with the fund and assets, still north of $3 billion, have only recently begun to slip. The new combined fund’s manager is no Peter Lynch, but he’s earning his keep.
Rivington Diversified International Equity Fund By WHV and Rivington Diversified Global Equity Fund By WHV have been closed and liquidated. “By WHV” sounds like a bad couture brand.
Stratus Government Securities (STGAX) and Growth Portfolio (STWAX) are both moving toward liquidation. Shareholders will rubberstamp the proposal on June 7, 2016.
The Board of Trustees, citing in light of “the ever-present goal of continuing to make all decisions and actions in the Best Interests of the Shareholders,” has decided to liquidate Valley Forge Fund (VAFGX).
 A queer and wonderful ride. Bernie Klawans – an aerospace engineer – ran it for decades, from 1971-2011, likely out of his garage. One-page website, no 800-number, no reports or newsletters or commentaries. Also an incredibly blurry logo that might well have been run through a mimeograph machine once or twice. Mr. Klawans brought on a successor when he was in his late 80s, worked with him for a couple years, retired in April and passed away within about six months. Then his chosen successor, Craig Arnholt, died unexpectedly within a year. The Board of Trustees actually managed the fund for six months (quite successful – they beat both their LV peers and the S&P) before finding a manager who’d run the fund for a pittance. The new guy was doing fine then … kapow! He lost 22% in September and October of 2014, when the rest of the market was essentially flat. That was a combination of a big stake in Fannie and Freddie – adverse court ruling cut their market value by half in a month – and energy exposure. He’s been staggering toward the cliff ever since.
Tocqueville Alternative Strategies Fund (TALSX) will “liquidate, dissolve and terminate [its] legal existence,” all on May 17, 2016. The fund is better than its three year record looks: it’s had two bad quarters in the last three, but often moved in the opposite direction of other alt funds and had a solid record up until Q3 2015.
William Blair Directional Multialternative Fund closed and liquidated on April 21, 2016.
William Blair Large Cap Value Fund (WLVNX) has closed and will liquidate on or about June 15, 2016. Soft performance, $3 million in assets, muerte.
In Closing . . .
Mutual Fund Observer celebrates its fifth anniversary with this issue. Our official launch was May 1, 2011 and since then we’ve enjoyed the company of nearly 800,000 readers (well, 795,688 seems like it’s near 800,000). Each month now we draw between 22,000 and 28,000 readers.
Thanks and thanks and more thanks to… David, Michael, William, and Richard. Many thanks, also, to John from California who sent a note with his donation that really brightened our day. As always, Gregory and Deb, your ongoing support is so appreciated.
 If you’re grateful at the absence of ads or fees and would like to help support the Observer, there are two popular options. Simple: make a tax-deductible contribution to the Observer. Folks contributing $100 or more in a year receive access to MFO Premium, the site that houses our custom fund screener and all of the data behind our stories.
Simplest: use our link to Amazon.com. We received about 6-7% of the value of anything you purchase through that link. It costs you nothing extra and is pretty much invisible. For those of you interested in knowing a bit more about the Observer’s history, scope and mission, we’ve linked our factsheet to the thumbnail on the left.

As usual, we’ll be at the Morningstar Conference, 13-15 June. Let us know if we might see you there.

Our June issue will be just a wee bit odd for the Observer. At the end of May I’m having one of those annoying round-number birthdays. I decided that, on whole, it would be substantially less annoying if I celebrated it somewhere even nicer than the Iowa-Illinois Quad Cities. The Isle of Skye, off the west coast of Scotland, in particular. Chip saw it as an opportunity to refine her palate by trying regional varieties of haggis (and scotch), so she agreed to join me for the adventure.
That means we’ll have to finish the June issue by May 20th, just about the time that some hundreds of students insist on graduating from our respective colleges. We’ll have the issue staged before we leave the country and will count on her IT staff to launch it. That means we’ll be out of contact for about two weeks, so we’ll have to ask for forbearance for unanswered email.
As ever,
