


Dear friends,
The theory says that our academic year ends in two weeks. As I gazed this morning across rows of slightly-stunned faces, I realized that the college’s schedule and the students’ don’t always align.
With the weather turning toward summer, the lawn calling and the campus in bloom, I’m intensely sympathetic.

That having been said, just a little more of their attention would be so helpful.
Time to put on your big-boy pants and check your investments
 Sorry, I don’t have a really gender-neutral alternatives to “big-boy pants.”
In all likelihood, you might expect to experience considerable ugliness in financial markets in the months ahead. That’s not a timing call, it’s a statement of the obvious.
What’s behind it?
The bull market in stocks is now the longest in U.S. history. The second- and third-longest bull markets ended (1929, 2000) in horrendous routs.
Market valuations, by any reasonable measure, are very extended. There are a million ways to calculate valuations and estimates of “fair value.” None of them say “cheap!” Almost all point to a market that’s at the top of its normal valuation range; by some measures, at the 99th percentile for its valuations.
The economy has not generated substantial earnings growth and the Congress does not seem poised to act constructively (or at all) to encourage it. At the same time, inflation (the PCE index) rose at its fastest rate since 2011.
The generally-pessimistic institutional investor Grantham, Mayo, van Otterloo (GMO) publishes monthly estimations of likely market returns over the next 5-7 years. It doesn’t involve a crystal ball, it simply assumes that the market returns to historically normal values; it’s a measure of what would happen to your portfolio if, by the end of 5-7 years, profits, price-to-earnings ratios and inflation returned to rates that are normal by historical standards.
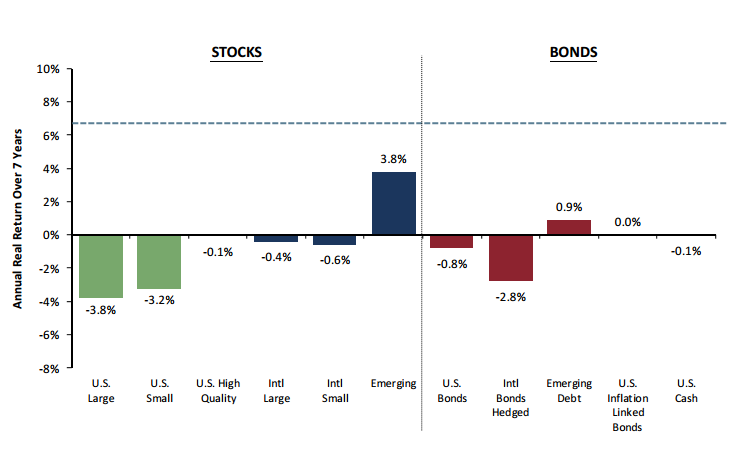
So, in inflation-adjusted terms, they estimate that high-quality U.S. stocks will earn zero and emerging markets stocks will earn a bit. Former Vanguard CEO Jack Bogle is more generous, by far, and estimates that you might be able to make 4%. As we noted last month, there are two ways to get there: with a bang, or with a whimper.
Jason Zweig, one of the sharpest of all the folks writing about finance, wrote an entirely fascinating and horrifying column in late April, “Whatever You Do, Don’t Read This Column” (4/30/2017). His most startling finding is that rich investors now expect to make more than ever before. Jason attributes it to faith in “an investing tooth fairy.”
Here’s our suggestion: check now to see if you’re ready for either possibility. GMO’s Ben Inker stated the obvious in the firm’s most recent quarterly letter (1Q2017): “It is impossible to determine if you are taking an appropriate amount of risk without understanding what the downside is for your portfolio, which means you simply have to do the exercise of understanding what can go wrong.”
One quick-and easy way to answer the “how bad could it get?” question is to look at your funds’ maximum drawdown; that is, the biggest loss they’ve suffered during the current market cycle.
Multiply the size of the loss by the weight of that fund in your portfolio. As an illustration, I’ve done the calculation for my non-retirement portfolio for you. I used the MFO Premium fund screener to isolate the maximum drawdown for each fund during the current market cycle which began in October, 2007.
Here are the funds that were actually around for the entire cycle:
| Fund | MaxDD | Portfolio Weight | Portfolio Impact |
| FPA Crescent | 29% | 17% | 4.9 |
| T Rowe Price Spectrum Income | 14 | 10 | 1.4 |
| Artisan International Value | 47 | 10 | 4.7 |
| Mathews Asian Growth & Income | 38 | 6 | 2.3 |
| Intrepid Endurance | 19 | 12 | 2.3 |
| 16 |
Those funds represent 55% of my entire portfolio. If they repeat their maximum drawdown, they’ll cost my portfolio about 16% of its total value.
What about newer funds? That’s a little tougher. None of them have been around long enough to experience a major drawdown event, so I had to estimate. Once again, I used the screener. First, I found average maximum drawdown by fund category since October, 2007. Second, I adjusted this average by the ratio of each fund’s volatility to average volatility since fund inception. (For this exercise, I used standard deviation as the volatility metric.) You’ll notice in the table below that I tend to invest in funds that experience lower volatility than their category peers.
| Fund | Category | Average MaxDD | Volatility Ratio | Estimated MaxDD |
Portfolio Weight | Portfolio Impact |
| Seafarer Overseas Growth & Income | Emerging Markets | 63 | 0.84 | 53 | 12 | 6.4 |
| RiverPark Strategic Income | Flexible Portfolio | 36 | 0.35 | 13 | 8 | 1.0 |
| RiverPark Short-Term High Yield | High Yield | 30 | 0.10 | 3 | 8 | 0.2 |
| Matthews Asia Strategic Income | Emerging Mrkts Hard Currency Debt | 27 | 0.73 | 20 | 6 | 1.2 |
| Grandeur Peak Global Microcap | Global Small-/Mid-Cap | 56 | 0.85 | 47 | 6 | 2.8 |
| Grandeur Peak Global Reach | Global Small-/Mid-Cap | 56 | 0.87 | 49 | 5 | 2.5 |
| 45 | 14 |
If you do that, you end up with a loss of about 30% in my portfolio, despite its cautious allocation. Currently, my allocation is just about 50/50% equity/fixed income, placing my overall portfolio in Lipper’s “Mixed Asset Moderate Allocation” category:
… a mix of between 40%-60% equity securities, with the remainder invested in bonds, cash, and cash equivalents.
The average maximum drawdown for funds in this category during the last bear market was -35%. If we look at the recovery times for my funds (that is, how long it took them to regain their previous peaks), there’s a good chance that I’d be in the red for three years or more.
Is that really a “loss”? Dan Wiener of Independent Adviser for Vanguard Investors and I had a short chat about it. Dan thinks you would merely have a smaller long term gain, rather than a loss.
Hi, David. You write that “there’s a good chance that I’d be in the red for three years or more.” That’s absolutely false unless you assume you bought all your funds on the day before the market starting going down. And that’s the kind of thinking that scares the bejeesus out of investors. If I invest $100 and it goes to $150 and then it drops 33% and I’m back to $100 I’m actually NOT in the red. I’m flat.
Dan’s argument centers on how you think about the cost-basis of your investments. If over the years I’d invested $20,000, it grew to $50,000 then a tantrum in the market reduced it to $33,000, how should I think about my position? Have I made 65% or lost 33%?
Dan’s sensible observation is that investors should think about all they’ve gained (from their initial value) over the years. My sense is that they would think about all they’ve lost (from their peak value). If you’ve got “dry powder” at hand and Dan’s steely nerve, you’d be better off. Sadly, few do.
So here’s the question: if I lost about one-third of my lifetime savings, what would I do? Could I ignore the loss, or would I react unwisely to it? Remember, at the point that I’d lost 30% of my total nest egg, I’d have no assurance that the losses would ever end (the early 1930s crash dropped the market by 90%).
If you don’t know how bad the loss in your portfolio could be, find out now! That’s the cheapest and best advice you’ll get in a year. You can’t plan without knowing, and you can’t react intelligently without planning.
We have faith in you, and we’ll help as much as we can. But you really need to start checking now, before the market scares you into doing something spectacularly unwise.
Thanks, as ever
Mutual Fund Observer celebrates its sixth anniversary with this issue. Hooray for us! Our official launch was May 1, 2011. Since then, we’ve enjoyed, and are grateful for, your company month after month. By happy coincidence, we celebrated the arrival of our one millionth reader sometime during the month of April.
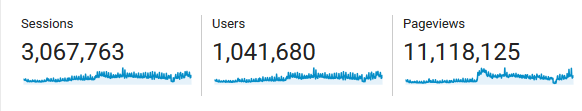
Yay for us, and thanks to you for joining us.
Thanks, in particular, to James, Sunil, Kirk, Kate and Donald, and to our four regular subscribers, Greg, Deb, Brian and Jonathan. We couldn’t do it without you.
If you’re grateful for the absence of ads or fees and would like to help support the Observer, there are two popular options. Simply make a tax-deductible contribution by check or through PayPal to the Observer. Folks contributing $100 or more in a year receive access to MFO Premium, the site that houses our custom fund screener and the data behind our stories.
Many fund profiles (Moerus, Centerstone, Matthews and maybe more!) are on their way in June, as is my attempt to answer the question, “what’s your beef for ETFs?”
Until then,
