


The knock on mutual fund performance numbers is that they’re static and arbitrary snapshots that give the illusion of being meaningful. What do you learn from looking at a fund’s five-year performance number? Mostly, you learn that the fund, through skill or luck, did well in the market conditions that obtained between December 2012 and December 2017. Sadly, we don’t have any reason to think those two dates are particularly important (why December 2012? ‘cause it was five years ago, duh!) and we don’t have any reason to believe they’ll tell us about performance in December 2018.
One way of creating a richer portrait of a fund’s risks and returns is by using rolling averages. A fund’s rolling five-year average reflects how it did in every 60 month period as far back as we’ve got data. A six year old fund has one five-year average but 12 rolling five year periods to assess; a ten year old fund has five five-year periods (2012-17, 2011-16) but 60 rolling five year periods.
Karen Wallace at Morningstar recently celebrated “Rolling Returns: A Powerful Analytical Tool That Anyone Can Use”(11/29/17). She notes that “they’re an extremely valuable tool for analyzing fund performance.”
Rolling period returns can provide a more in-depth view into a fund’s performance history than you can get by looking at a single-period trailing return. In a way it’s like comparing a panoramic photo of a forest to a snapshot of a small group of trees.
Rolling returns offer a wider-angle lens into a fund’s full return history. In addition to looking at a fund’s most recent five-year return you could also look at how it performed over many overlapping 60-month periods as far back as your performance data goes, or as far back as the current manager has been in charge, which can help you gain a fuller understanding of its historical performance trends throughout five-year holding periods in a variety of market environments.
The little complication is that for users wanting to screen the funds or do a side-by-side comparison, the “anyone” in the title translates to “anyone with a Morningstar Direct subscription.” Wikinvest reports the pricing for that service:
Morningstar Direct: Pricing for Morningstar Direct is based on the number of licenses purchased. We charge $16,000 for the first user, $10,500 for the second user, and $8,000 for each additional user.
Speaking on behalf of small investors everywhere: yikes!
Fortunately, those of us who are what Pittsburgh National Bank called “thousandaires” have two affordable and complementary ways to get some of that data.
Morningstar offers a picture of a fund’s rolling averages in their fund profiles. From a fund’s profile page, click on “chart” and, on the upper left corner of the chart click the “growth” pulldown menu and select “rolling returns.” You’ll see a chart with a bunch of bars on it. Now under “rolling period” select 36 months. Using Fidelity Low-Priced Stock as our test subject, here’s what you’ll see:
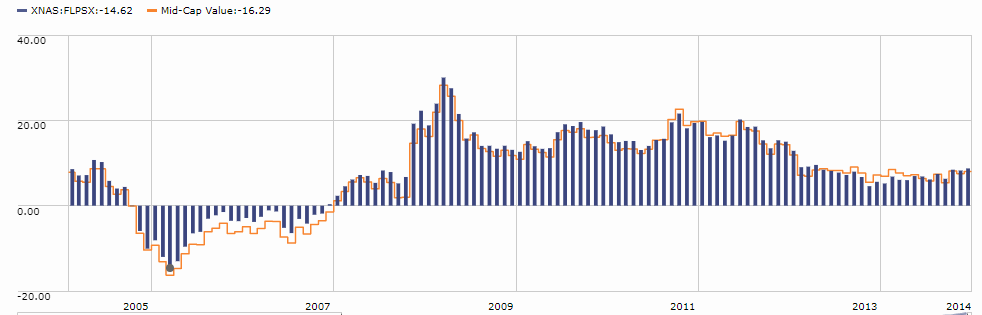
What does that chart tell you? Over the past 10 years, the fund’s worst-ever 36 month stretch saw an annualized loss of 14.5%, March of 2006 to February 2009. That’s the depths of the 2007-09 financial crisis. That’s better than its peers, represented by the orange line. Conclusion: great in bad times, competitive in good times, pretty steady overall.
MFO offers the data in a single, easy to read table. Here’s our version of the Fidelity Low-Priced Stock story.

What does that say? If you’re willing to hold FLPSX for three years (and there are 205 rolling three-year periods in the data), your worst-ever experience was an annualized loss of 14.6% and your best-ever experience would have been a gain of 30.1% annually. Over the long term, investors have received about 11.8% annually in the average three-year period. Solid! You can also see how much it pays to hold on through bad times: the worst-ever single year was a loss of 42.3% and the worst-ever five year stretch was a loss of 3.7% but the fund’s worst-ever decade still paid its investors 6.8% annually. If you compare the average returns, you see a striking stability: 11.8% annually if you’re willing to hold for three years, 11.6% if you’re willing to hold for five years, and 9.8% if you hold a decade. Why does the longest holding period have the lowest return? Because bear markets tend to show up every seven years or so, as a result many five year periods dodge any bear exposure while some 10 year periods contain at least bits of two bear cycles.
Those single-fund charts show you different angles of the same data. MFO Premium adds one additional tool that retail investors can’t access through Morningstar: our fund screener allows you to screen for funds based on their lowest 1, 3, 5, 10 and 20 year rolling averages.
Want a fund that’s never had a losing 12 month period in the past decade? No problem, there are 306 of them. Small problem, they’re all short-term, ultra-short term bond or money market funds.
Here’s a more interesting challenge: can we find a stock-oriented mutual fund that we can trust? We know stocks are volatile, so it’s not reasonable to hope for a fund that has never had a losing three-year run so let’s set reasonable criteria in hopes of finding a fund that has never disappointed. On our screener, I first set four rolling average requirements:
- 3 year rolling average: never worse than -2% / year
- 5 year rolling average: never worse than 0% / year
- 10 year rolling average: never worse than 6% / year
- 20 year rolling average: never worse than 8% / year
What does that mean? I ignored one-year averages because they’re so volatile and you should be ashamed of yourself if you invest with a one-year time horizon. I start with no more than minimal losses over 3 years, no worse than breaking even over five, with solid gains for long-term investors. And, just to placate folks who do freak out about the risk of short, severe downturns, I added a maximum drawdown screen of category 1 or 2; that is, below average to much below average maximum losses. Then I hit “go.”
Out of an 8000 fund universe, only one fund passed our screen. That fund is Oakmark Equity and Income (OAKBX), which our colleague Ed Studzinski co-managed with Clyde McGregor from 2000-early 2012. Here’s Morningstar’s picture of the fund rolling along:
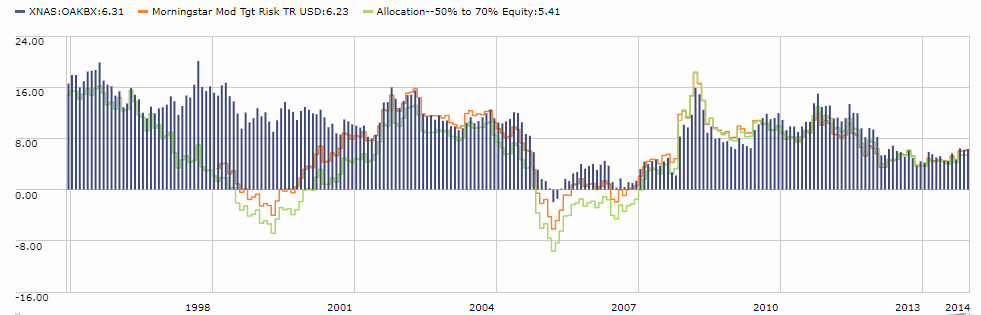
See all those periods where the green line (their peers) was below zero while their blue bars were way above zero? That’s where they’re being smart and risk-conscious, over and over again, while their peers foundered.
MFO’s screener output gives you a more precise slice of the data: over 229 three-year rolling periods, the worst stretch was -2.0/year, the best was 20.1%/year with an average of 9.8% annually for someone holding for 3 years. And 9.7% for 5-year periods, 9.1% for 10 year periods and 9.8% for 20 year ones. Do you get some sense of stunning consistency here? We do.

It has been a superb performer, though its future requires some tempering of expectations. With Ed gone, some of the sparkle is off the prose in their letters to investors. Honestly, I used to look forward to every one of Ed & Clyde’s letters for their insight and sharp writing. That experience makes me grateful that Ed agreed to join MFO’s merry band. And Clyde McGregor expects to retire by age 70; he’s 65 now, so investors need to anticipate some transition beginning in the next three years or so. Mr. McGregor has two co-managers, Colin Hudson and Edward J. Wojciechowski, both of whom joined Harris Associates in 2005 and were named to the fund’s management in 2013. I have no doubt that they’re both bright and industrious souls, but I also have no proof that they’ll meet the ridiculously high standard set by Messrs. McGregor and Studzinski.
But, for now and for the past 30 years, Oakmark Equity and Income has qualified as “the one fund you can trust.”