


With the high volatility over tariffs, uncertainty, and concerns over the independence of the Federal Reserve, parts of this article may be out of date within hours of completing it. How does one invest in this environment? I have updated my Investment System to reflect my current strategy. In short, it is set up as a traditional 60% stock/40% bond portfolio within a range of 55% to 65% stocks based on my investment model. I set the model up to make small quarterly adjustments based on volatility-adjusted momentum and a shift between international and domestic growth based on valuations and momentum.
In April, I searched for and found that I can download the monthly returns for the life of a fund in the MFO Premium fund screener and the Lipper global dataset. I began creating investment models over a decade ago using data mostly available at the St. Louis Federal Reserve Database (FRED). Using actual fund data from MFO is a huge improvement. The objective of the model is to maximize the returns on investments since 1995, given my constraints. There is a lot of data at FRED that covers this time period, and I want an “all-weather” approach with low turnover. I modified the Investment Model in April to use historical data on four equity funds and seven fixed income funds.
The Funds
The twelve funds that I included in the Investment Model are shown in Table #1 along with two excellent mixed-asset funds for a baseline: T Rowe Price Capital Appreciation Income (PRWCX) and FPA Crescent (FPACX). Notice that the SPDR S&P 500 ETF (SPY) returned 10.3% over the past thirty years while PRWCX and FPACX have competitive returns of 10.8% and 9.8%, respectively. The funds were selected that can neatly fit into a Bucket Approach. The bond selection includes riskier bond funds that have a low correlation to stocks and are less risky than stocks. The funds were selected to maximize the return in the Model while maintaining a low turnover philosophy.
Table #1: Funds In Investment Model – Thirty Year Metrics
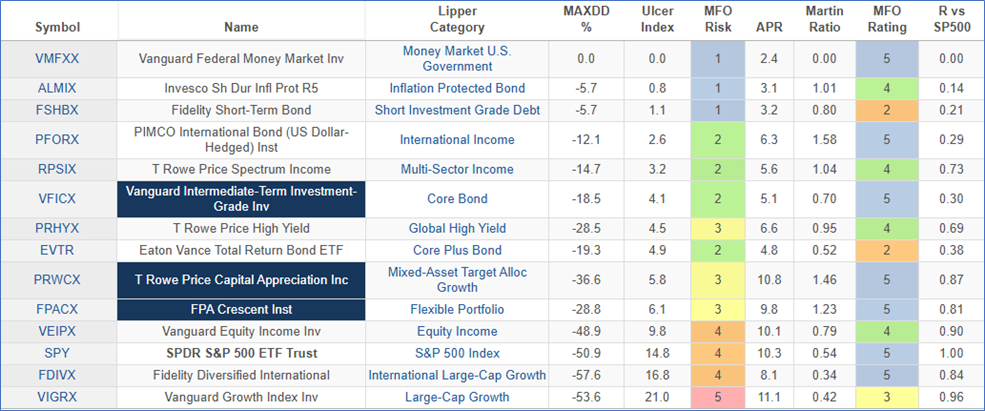
Source: Author Using MFO Premium fund screener and Lipper global dataset
During the time period from 1995 to 2013, many mixed-asset funds outperformed the S&P 500 for several reasons. First, bonds outperformed stocks during the two major bear markets, and international stocks outperformed domestic stocks over long periods of time, especially as domestic equities became overvalued during the Housing Bubble.
Figure #1: Funds In Investment Model – Total Return 1995 – 2013
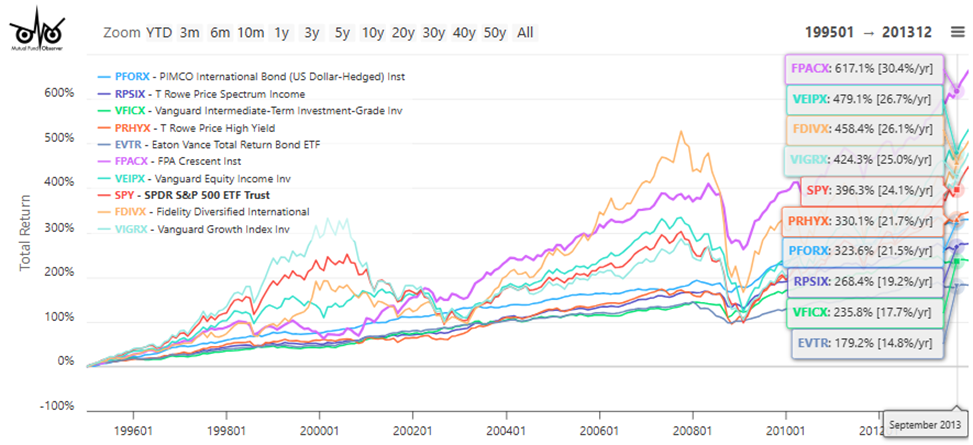
Source: Author Using MFO Premium fund screener and Lipper global dataset
During the time period from 2014 to 2025, Quantitative Easing and easy monetary policy suppressed bond yields, and valuations of domestic equities became overvalued. International equities have underperformed. As a result, mixed-asset funds have performed worse than the S&P 500.
Figure #2: Funds In Investment Model – Total Return 2014 – 2025
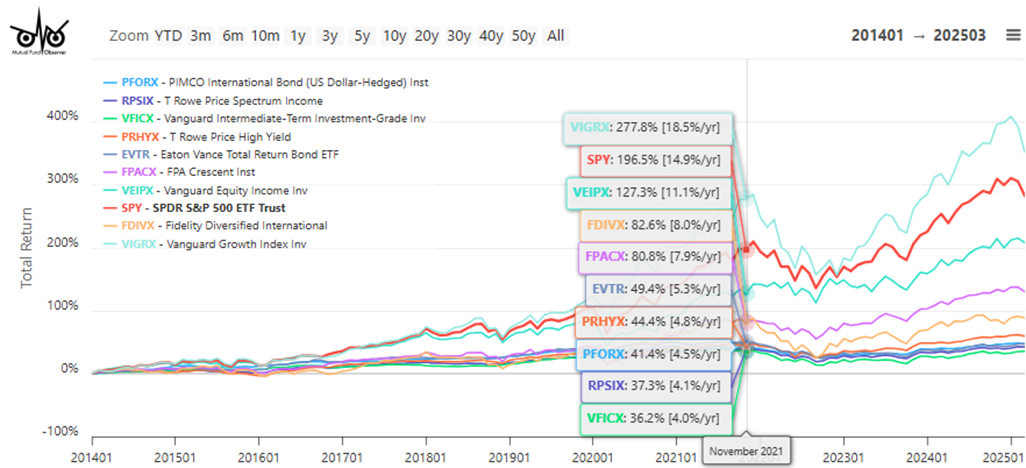
Source: Author Using MFO Premium fund screener and Lipper global dataset
At the start of the year, domestic stocks were highly valued. The S&P 500 was down almost ten percent year-to-date (as of April 22nd) compared to foreign large growth, which rose nearly 6% this year. The price-to-book value of the S&P 500 is still high compared to international stocks.
Table #2: Funds In Investment Model – Year-To-Date Performance
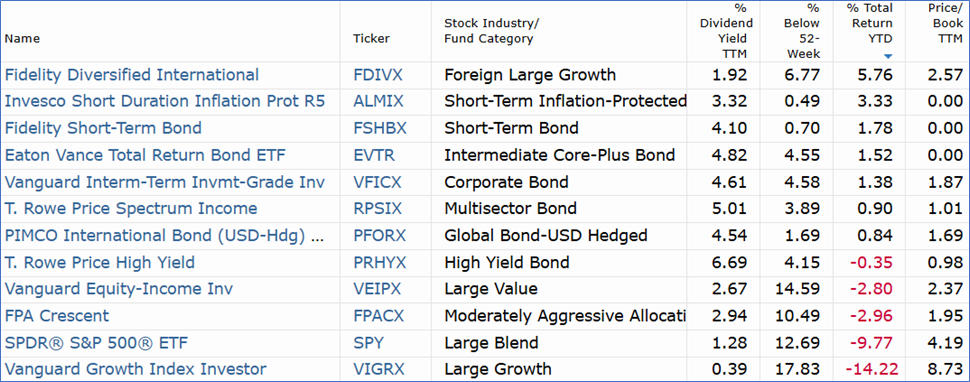
Source: Morningstar as of April 22nd, 2025
Portfolio Allocation and Performance
The investment model uses economic and financial indicators for the past thirty years to “nowcast” current market conditions. My investment strategy is to follow a traditional portfolio of funds with 60% allocated to stocks within a range of 55% to 65%, and 1) make adjustments quarterly for 2% of the portfolio based on quarterly returns adjusted for volatility, 2) shifting up to 5% of equity between domestic and international growth funds based on valuations and momentum, and 3) using the Investment Model calculated stock to bond ratio for “risk on – risk off”. The allocations over the past thirty years are shown in Figure #3.
The Investment Model likes cash, which I have capped at 15%. Money markets performed “less badly” than many bond funds during Quantitative Easing, and bond performance worsened starting in 2022. Cash is not trash. Recently, inflation-protected bonds have been performing well, as have short-term investment-grade and international bond funds. On the equity side, I limit the allocation to domestic growth stocks to 15% of the portfolio. The model began shifting allocations to international stocks as valuations increased, even though domestic growth was outperforming, but international stocks have performed exceptionally well in 2025.
Figure #3: Investment Model Allocations
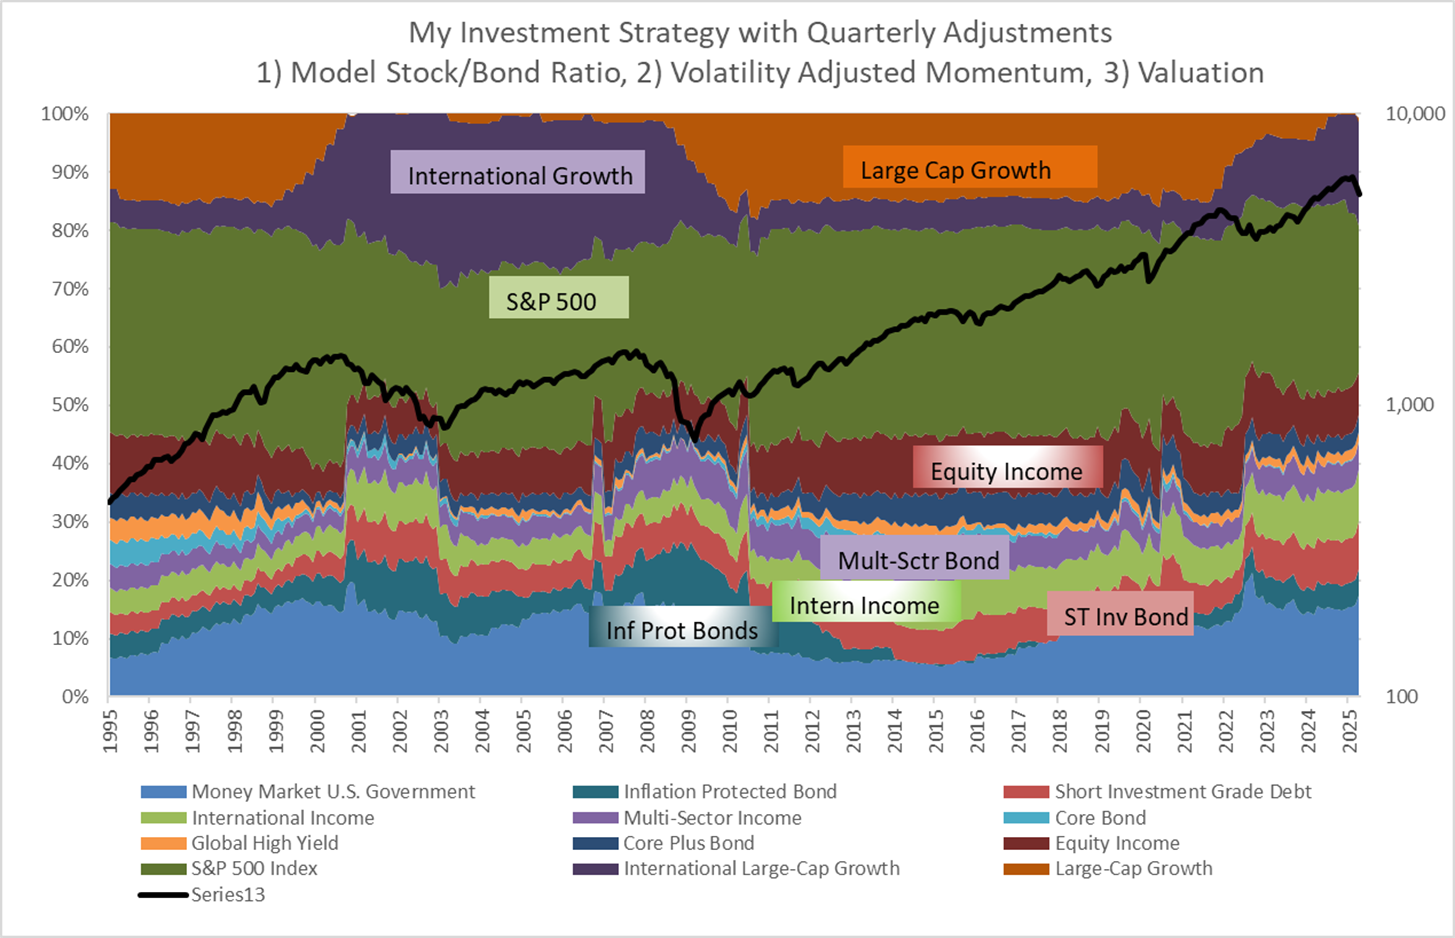
Source: Author
My objective is to learn from how different strategies work and not unrealistically optimize a back-tested strategy. I have the advantage of thirty years of economic data available at the St Louis Federal Reserve (FRED) database, hindsight on valuations, and actual fund performance. The Investment Model returned 11.6% APR over the thirty years compared to 10.3% for SPDR S&P 500 ETF (SPY), 10.8% for T Rowe Price Capital Appreciation Income (PRWCX), and 9.8% for FPA Crescent (FPACX).
Figure #4: Investment Model Total Return vs S&P500, FPACX, PRCWX
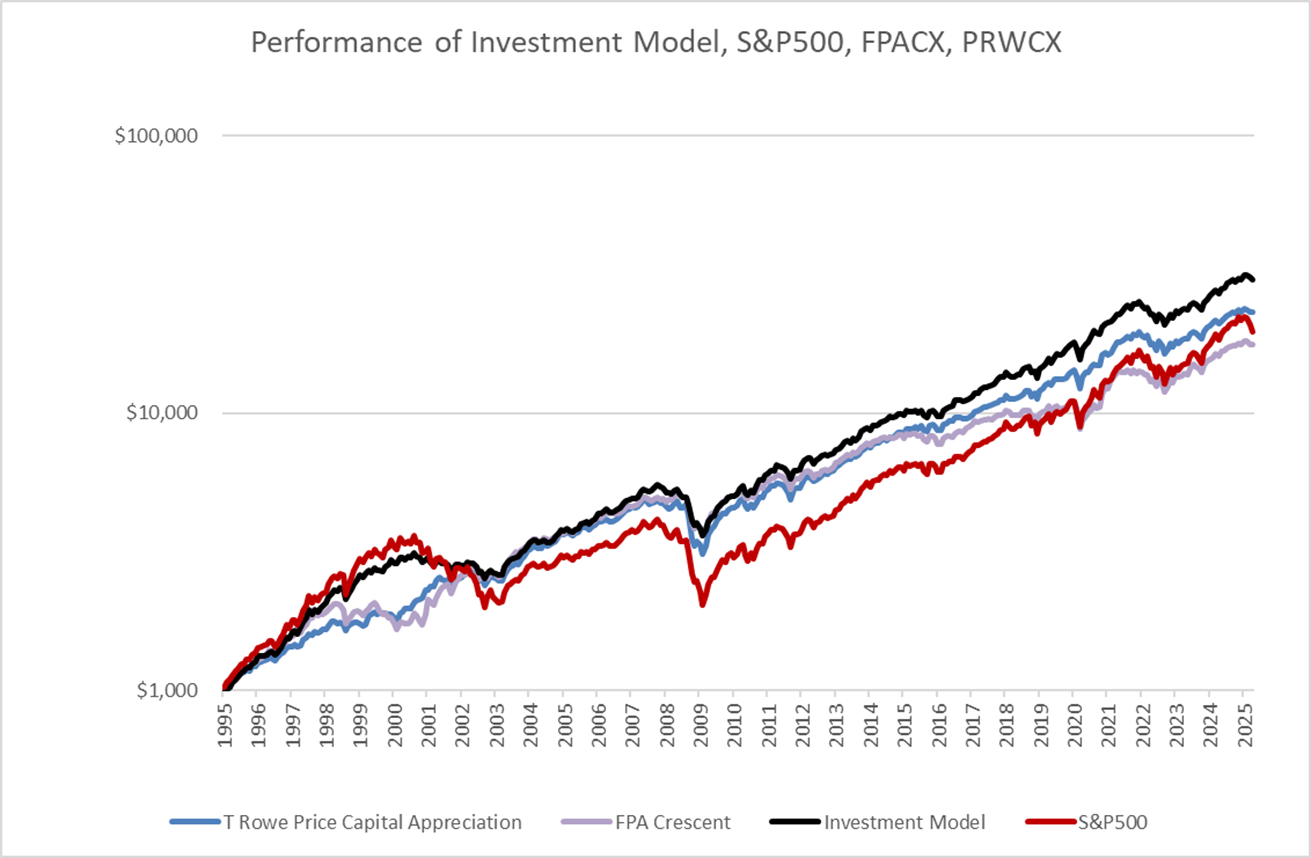
Source: Author
There are thirteen mixed asset funds that have returned 9% or more over the past thirty years during the time when the S&P 500 returned 10.3%. All of them have a higher risk-adjusted return as measured by the Martin Ratio than the S&P 500. Most of the mixed asset funds outperformed the S&P 500 during the 1995 to 2013 time period, while the S&P 500 outperformed since 2014.
My Assessment
The Investment Model has recommended a risk-off allocation of 55% since the middle of 2022. I let the winners run, and the allocation rose to 65% by the end of last year. As I described previously, I made withdrawals to refill short-term Investment Buckets and reduced ris,k lowering allocations below 60% prior to inauguration day. What drove this weakness when the market rose by twenty percent over the past two years?
The Investment Model consists of over thirty main indicators that are composed of over a hundred sub-indicators. Let’s take a look at a few of these. Nearly 70% of the gross domestic product is consumer spending. My Consumer Health Indicator, shown in Figure #5, estimates the consumer’s ability to spend in the future. It is based on Wages, Spending, Consumer Sentiment, Labor Conditions, Credit Delinquencies, Disposable Income, Savings Rates, and Consumable Orders. Where appropriate, these are adjusted for inflation. The Consumer is running out of breath. About two-thirds of households are living paycheck to paycheck, and about half of these don’t have enough savings to cover three months of living expenses. Social trends like “Under-Consumption Core” and “Don’t Buy 2025” reflect the desire to cut back on spending and save more.
Figure #5: Consumer Health
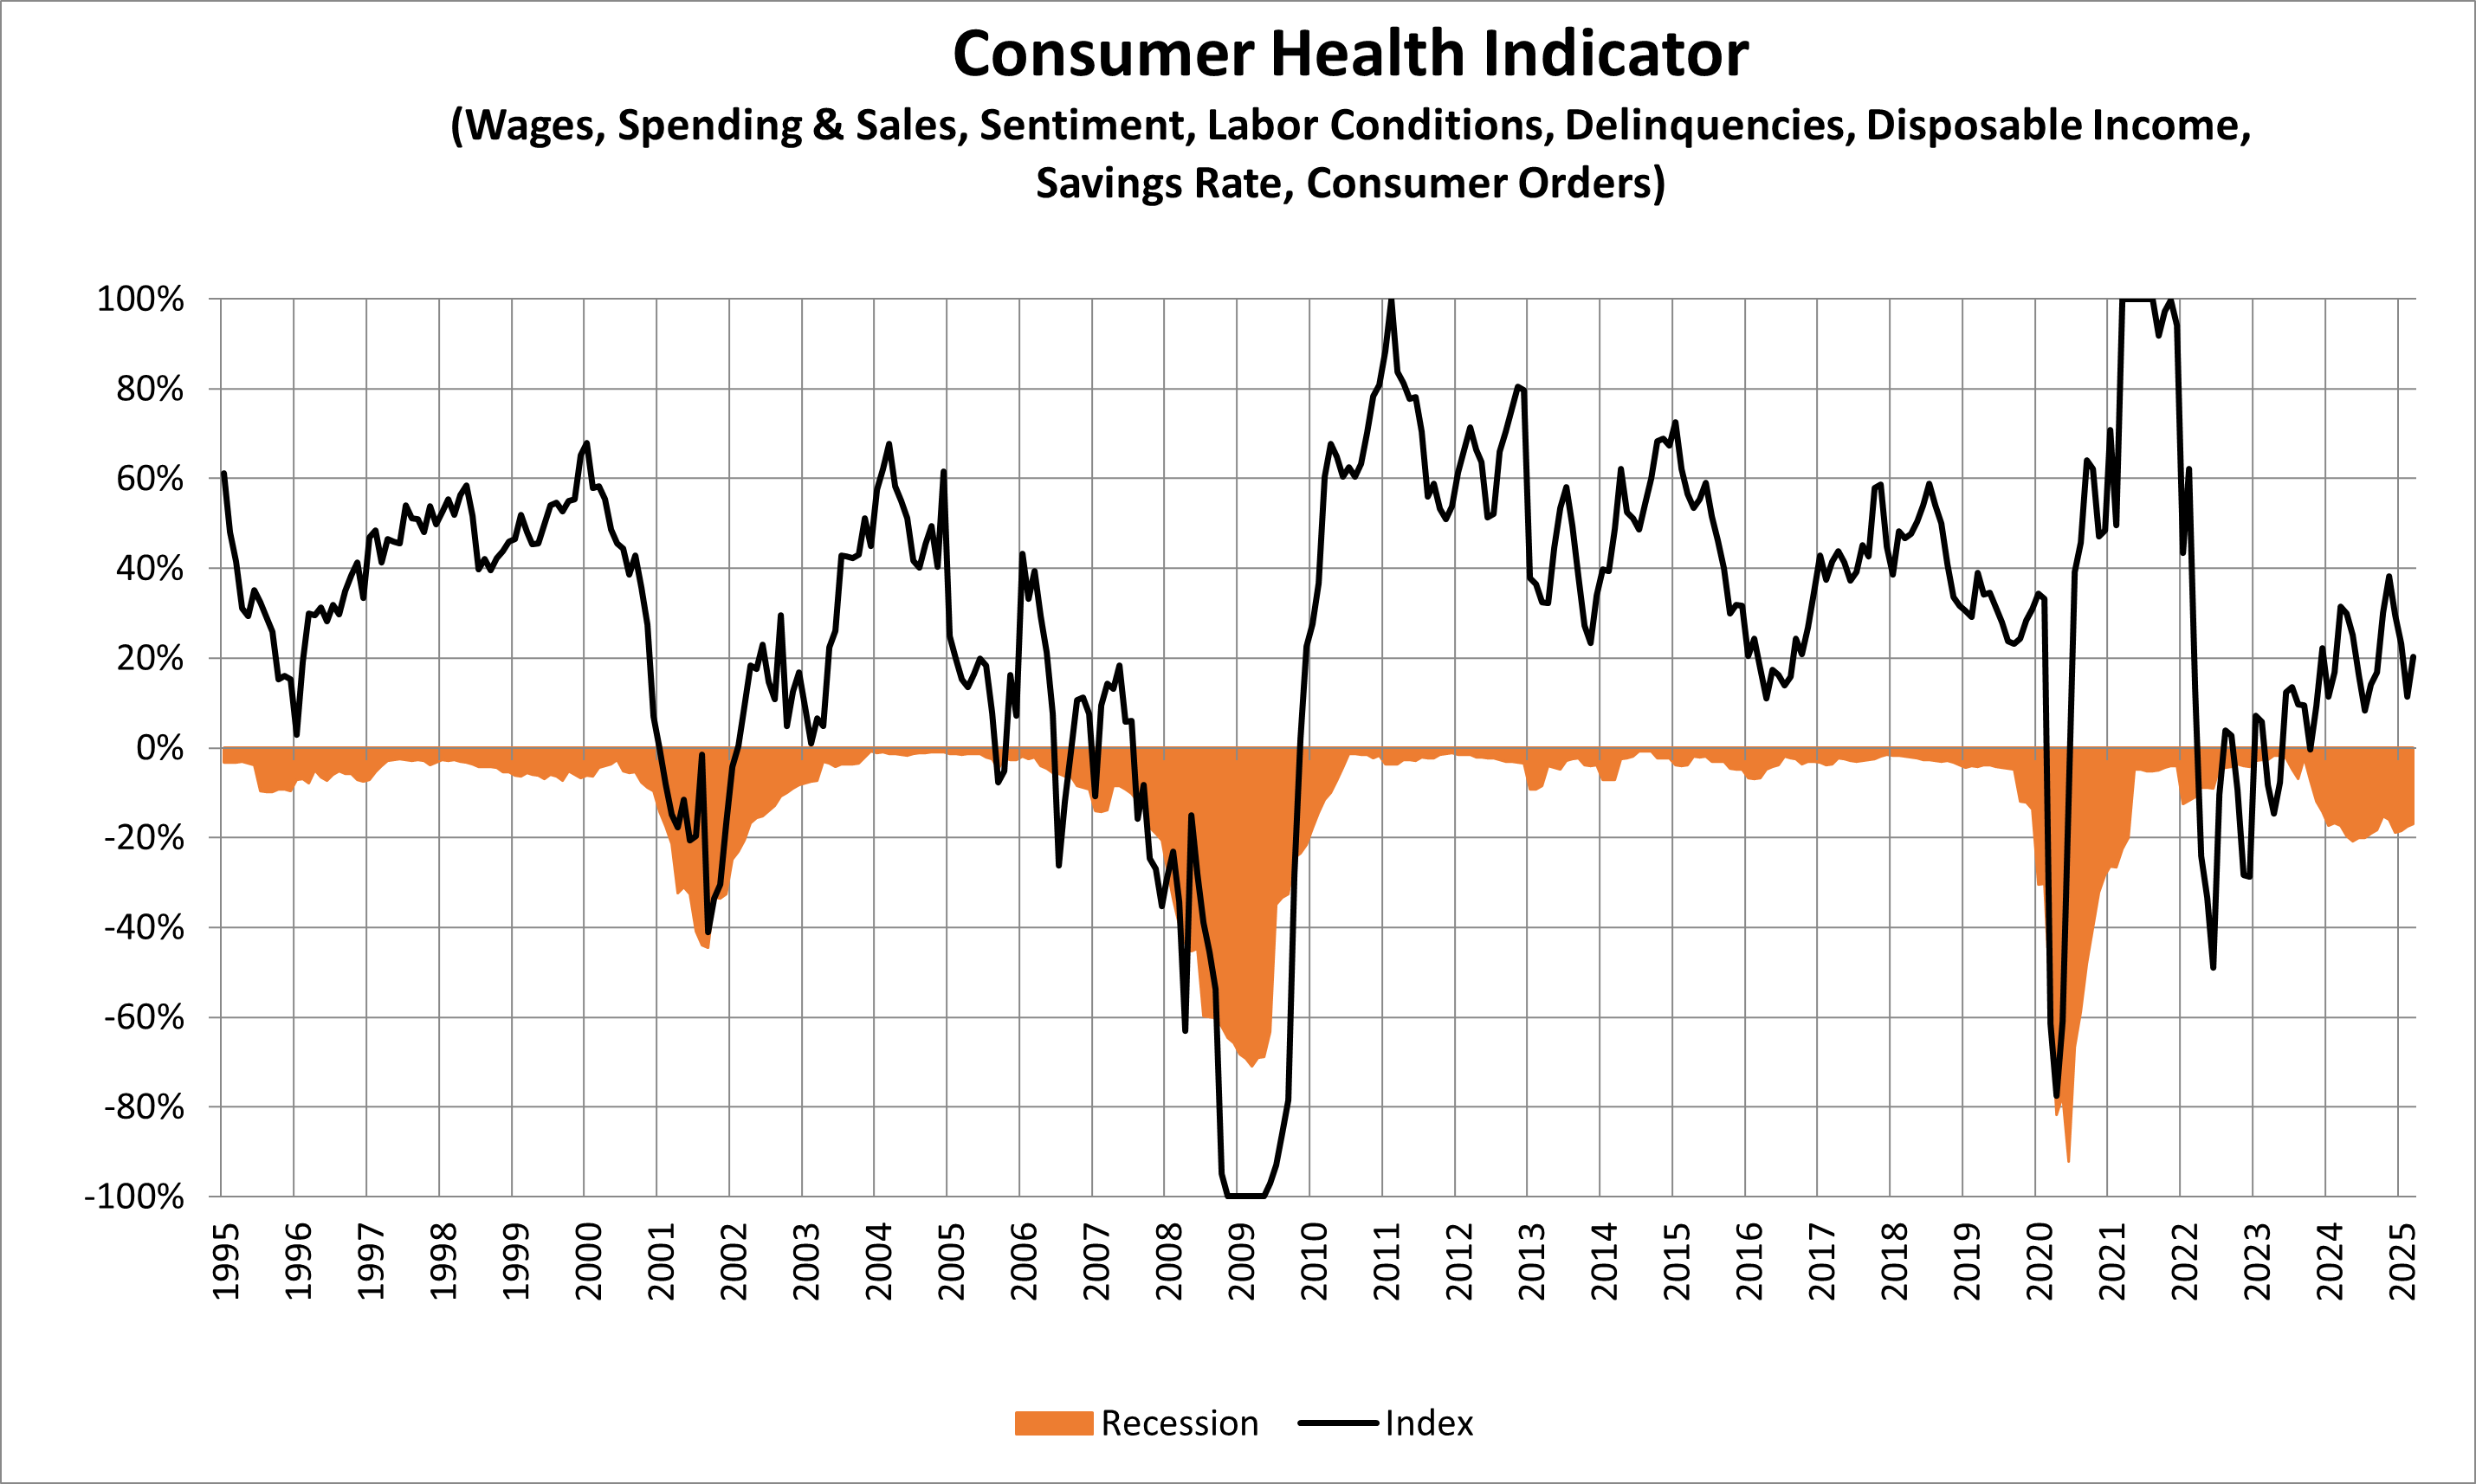
Source: Author Using St Louis Federal Reserve FRED database
Figure #6 is my Corporate Health Indicator, which is a composite of Net Value Added (a measure of contribution to the economy after depreciation), Profits, Sales, and the Prime Rate. Where appropriate, these are adjusted for inflation. Increasing tariffs will produce winners and losers, but a slowing economy will negatively impact most businesses.
Figure #6: Corporate Health
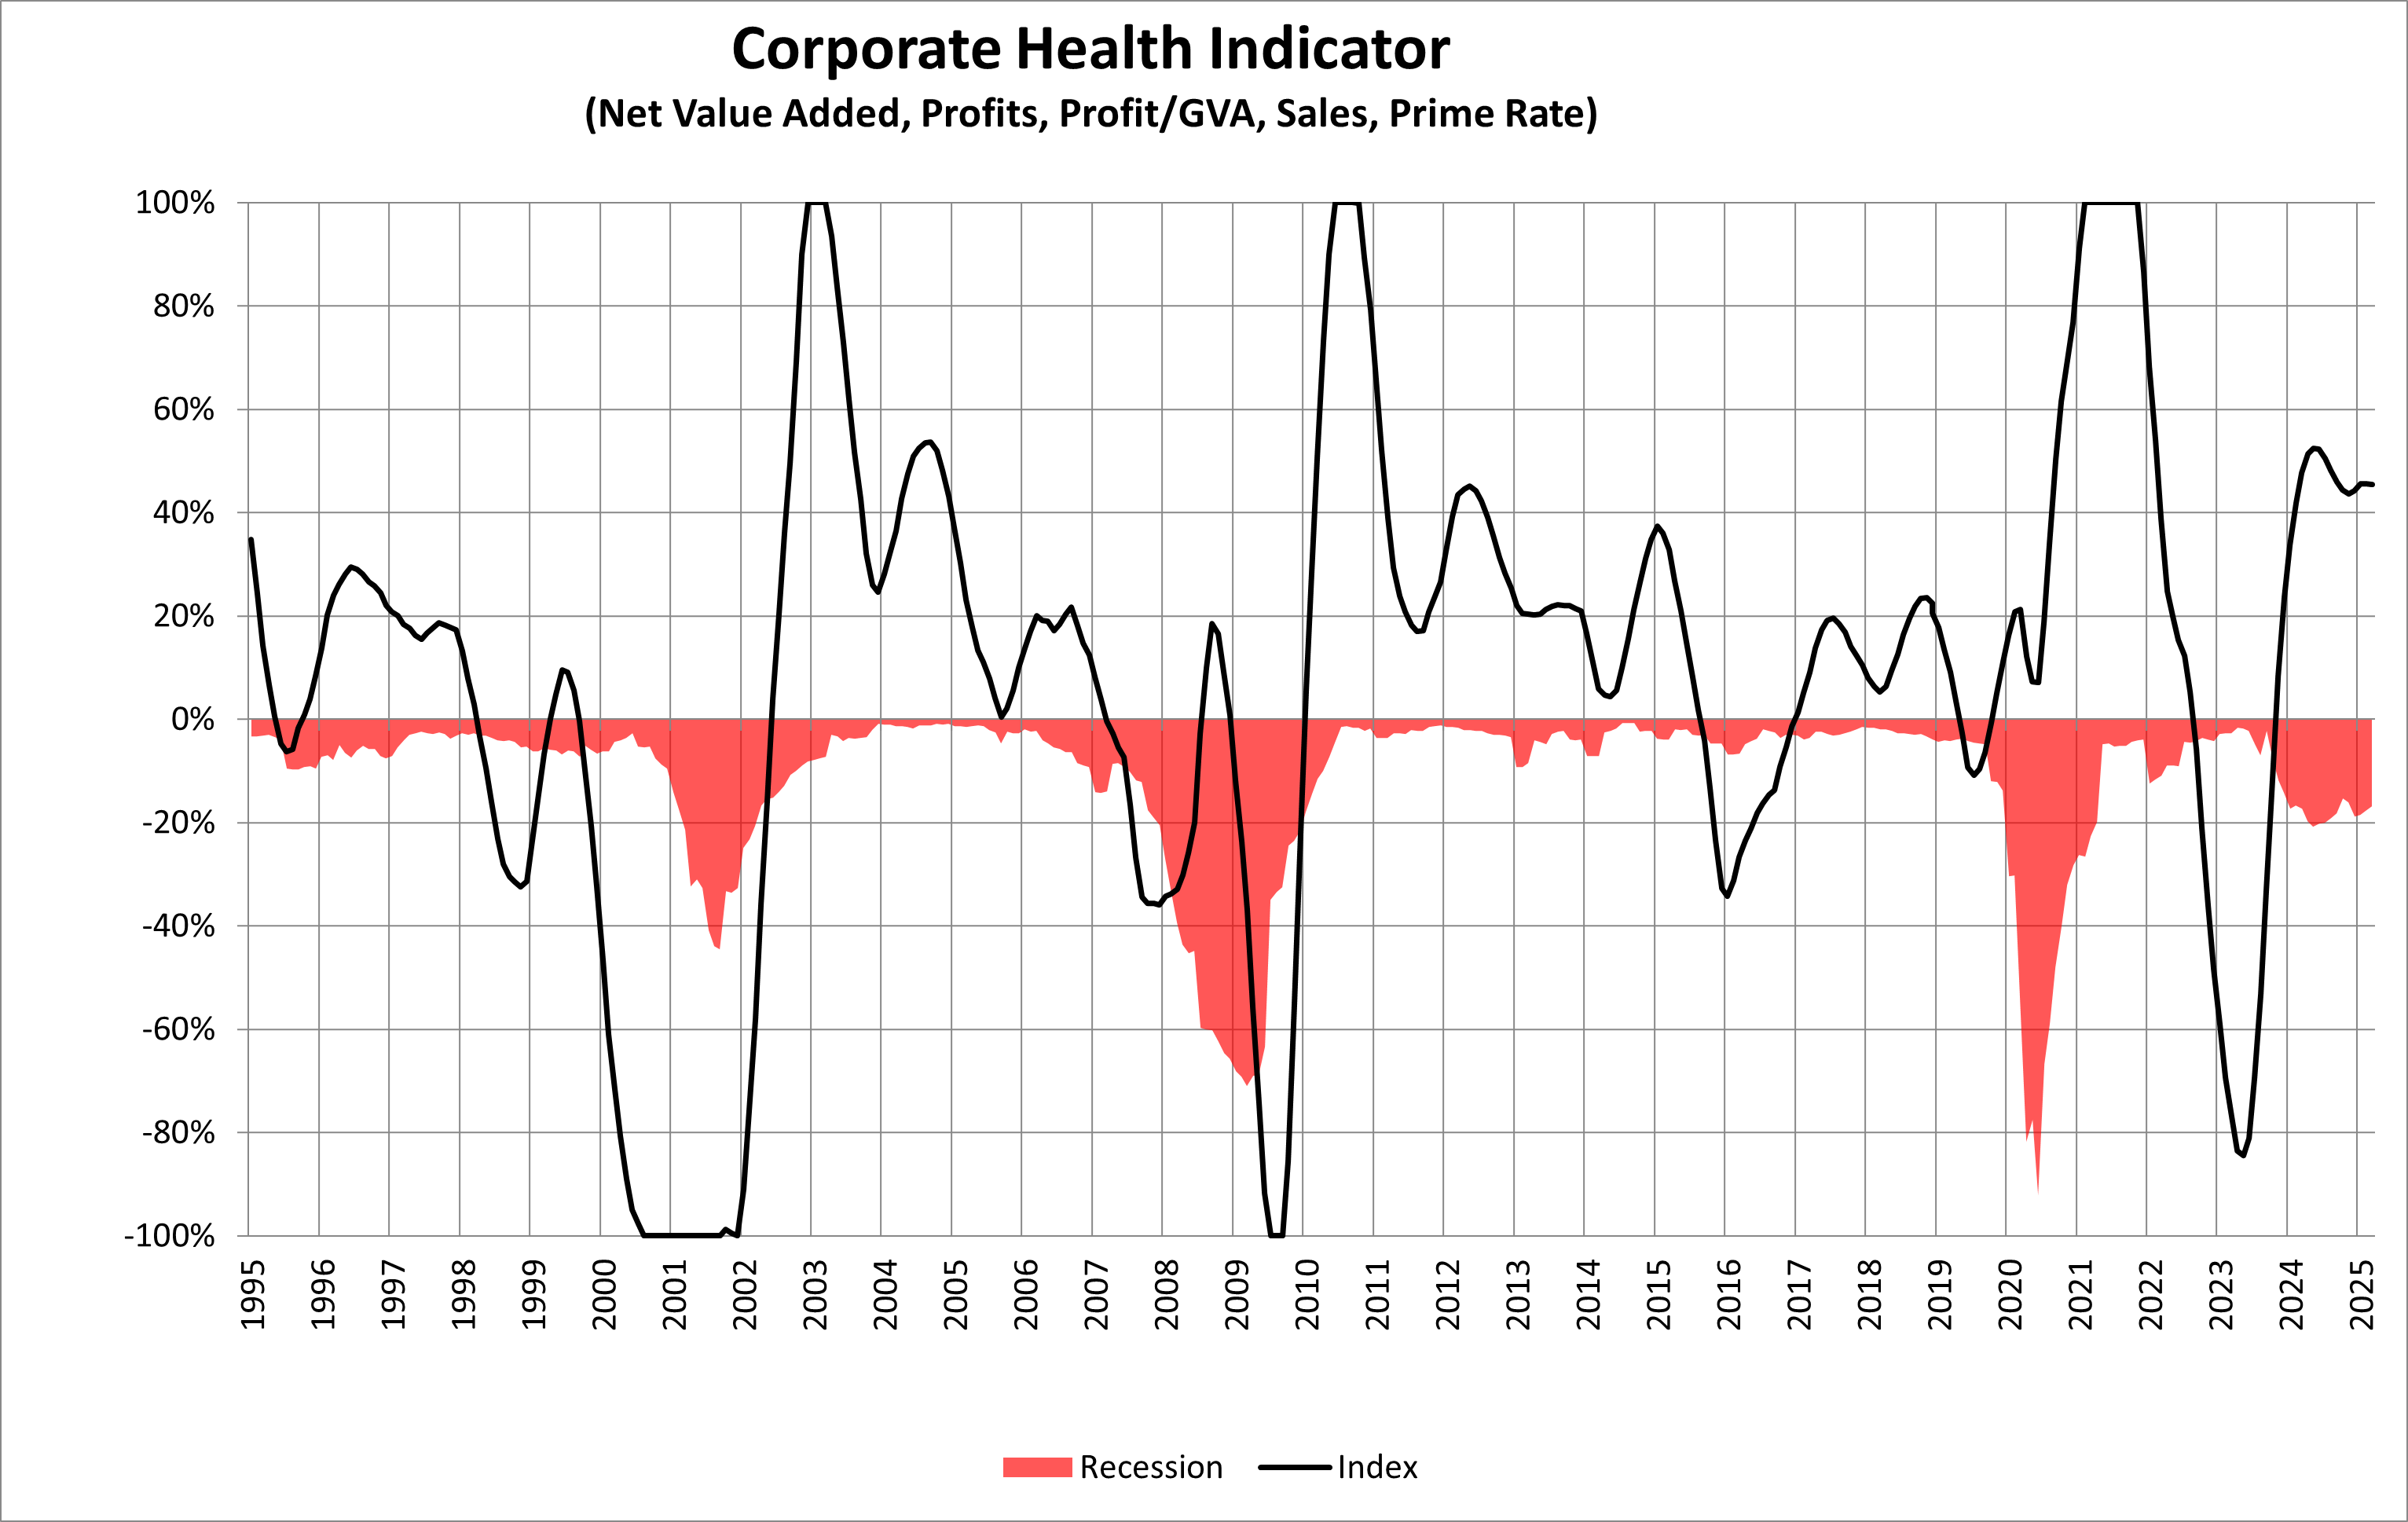
Source: Author Using St Louis Federal Reserve FRED database
In Figure #7, I composite a half dozen measures of valuation to conclude that prior to the market correction, equities rivaled the Technology Bubble for high valuations. They are still highly valued despite the current market correction.
Figure #7: Equity Valuation
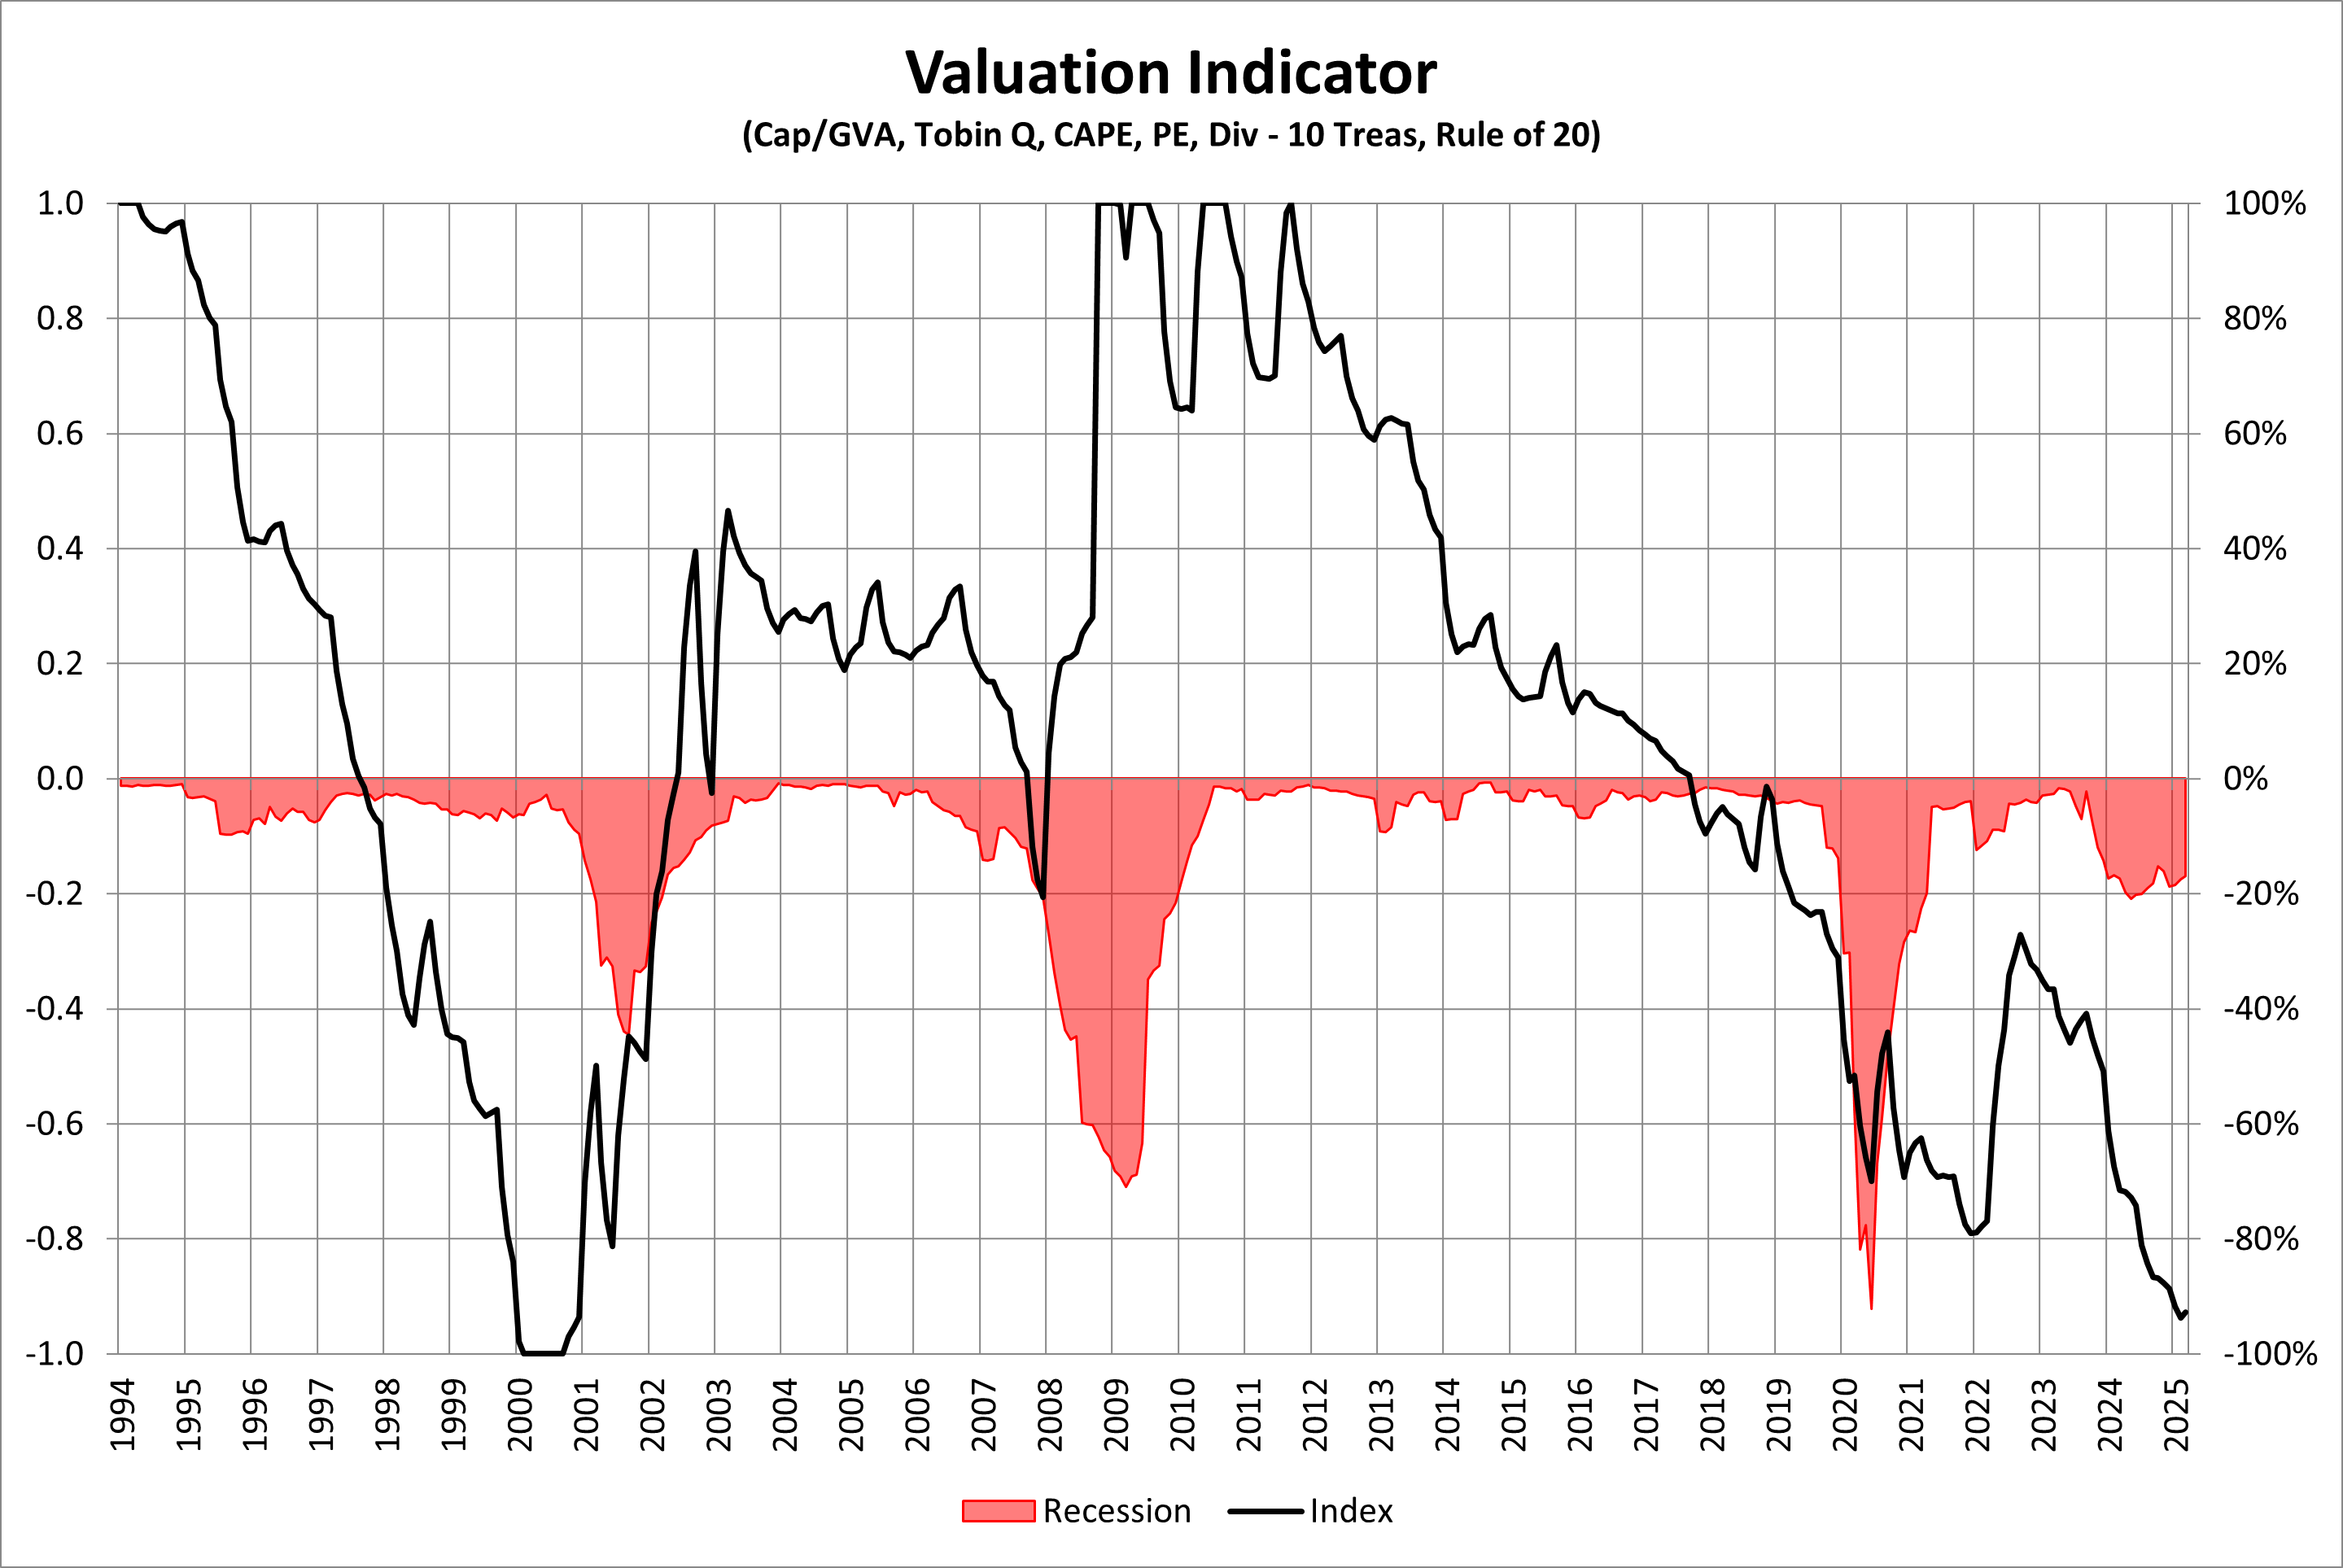
Source: Author Using St Louis Federal Reserve FRED database
Figure #8 shows my Recession Indicator. I built it to give advance warning of recessions. The probability of a recession (green line) has been falling steadily since 2022. The New York Federal Reserve recession probability based on the yield curve (black line) remains above 50%. Data impacted by tariffs and uncertainty will trickle in over the course of the year, and I expect the recession probability to rise substantially.
Figure #8: Recession Indicator
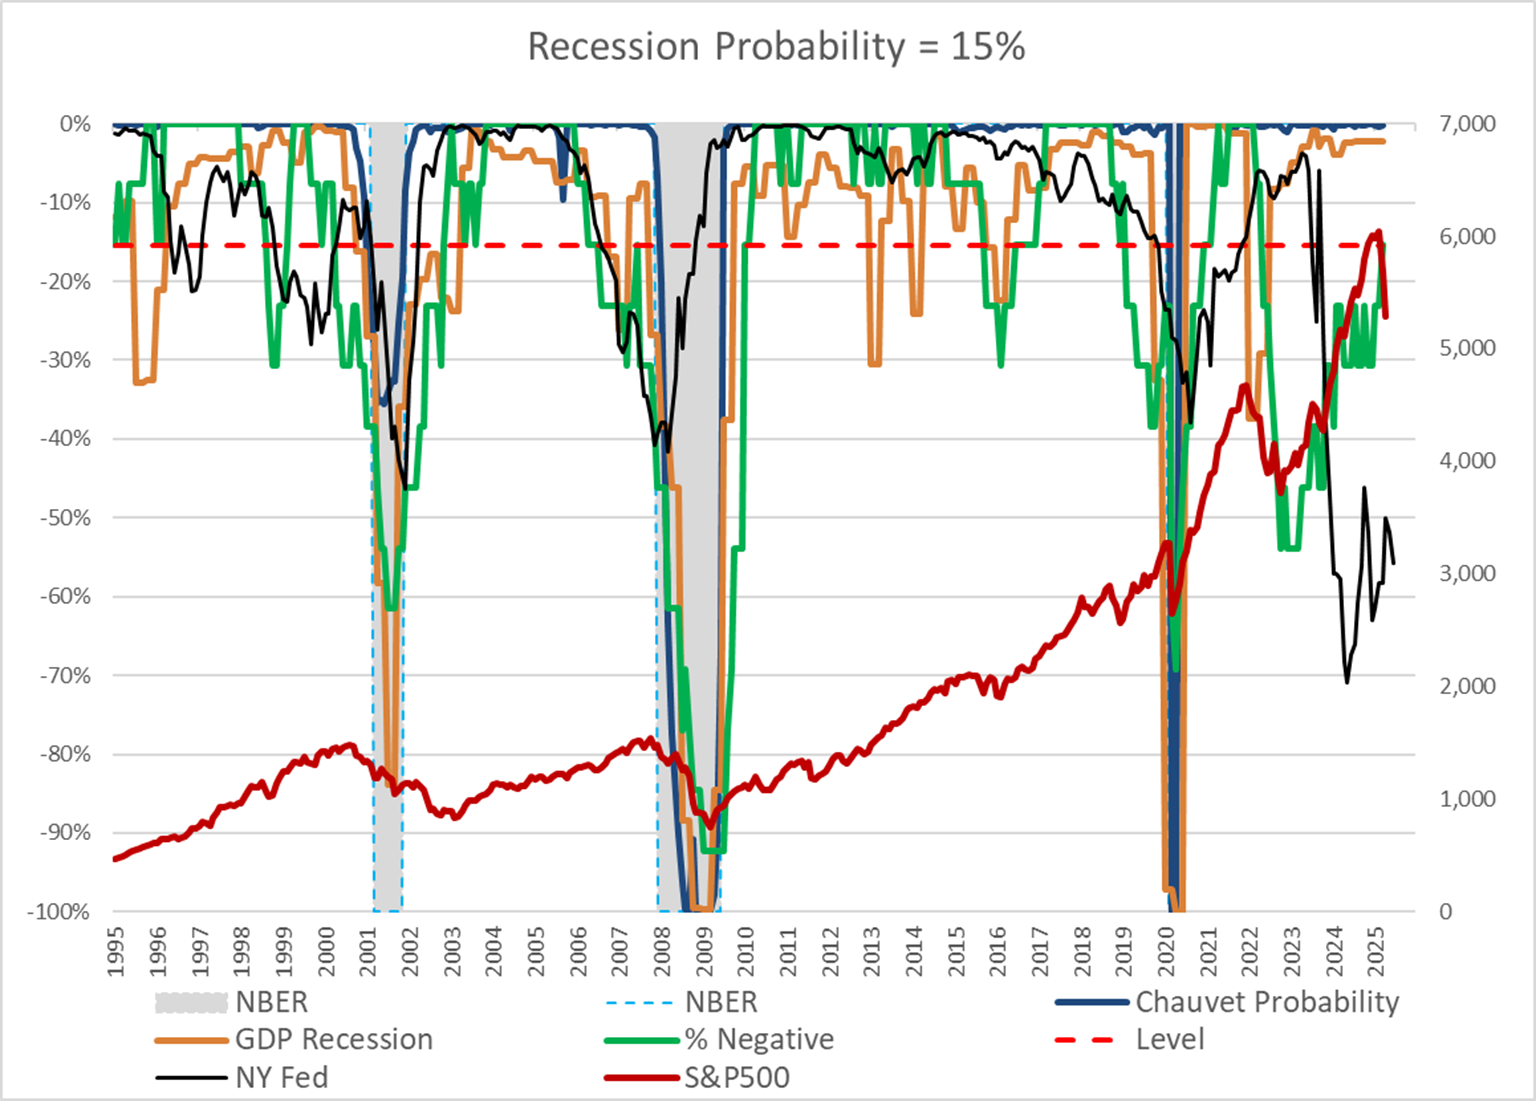
Source: Author Using St Louis Federal Reserve FRED database
Closing
The Investment Model is a good guideline for how I want to invest; however, there have been a lot of innovations in funds, the internet, and tools. I use Financial Advisors at Fidelity and Vanguard to manage over half of my investment, which is mostly in the moderate to higher risk accounts. I manage mostly the more conservative accounts for income. My overall portfolio has similar allocations to the types of funds in the Investment Model, but not the same funds.
I see similarities to the stagflation of the 1970s because tariffs increase inflation and the uncertainties associated with supply chain disruptions. I believe that less government spending and fewer regulations will return us closer to post-World War II stock market behavior, with more frequent and hopefully less severe recessions. The 1995-2013 investment environment will be more representative of the next decade than the 2014-2025 period.
High valuations are still a headwind for domestic equity returns. International investors have pulled money from US markets, keeping yields high on US 10-year Treasuries. The rising national debt will tend to keep interest rates higher for longer. Credit spreads on high-yield bonds are increasing. Uncertainty is built in until July 8th when the ninety-day pause on tariffs ends, or is extended, or trade deals are reached, or fresh demands are added, or…
Following the Model Portfolio, I intend to increase allocations to short-term investment-grade and inflation-protected bond funds over the course of the year. As for the uncertainty in the markets, my Investment Buckets for the Short- and Intermediate-term are solid with little volatility. I made major adjustments prior to inauguration day and have made a few changes due to tariffs or volatility. I will use volatility-adjusted momentum to adjust allocations for the rest of the year with a focus on ensuring the stability of withdrawals. I remain risk off.