


In my former life in the private sector prior to retiring, part of my role was risk mitigation; identifying potential bad things that might happen and minimizing their impact in case they do happen. I have carried that practice into investing. The financial landscape is constantly changing, but these changes are extreme this year. In preparation for the known unknown, I lowered my stock-to-bond allocation from 65% to 55% by changing what I manage. I desired to lower my stock-to-bond ratio even further to 50% within a range of 50% to 60% and was able to do so by changing my profile with my Financial Advisor at Fidelity.
I use Vanguard to manage a portion of my investments and enjoy reading Vanguard Capital Markets Model forecasts for insights about long-term returns. In January of this year, Isabel Wang described Vanguard’s view that investors could get a better risk-return trade-off by adopting a 40/60 portfolio than the traditional 60/40 portfolio, in “Consider flipping your 60/40 portfolio to 40/60 as bonds become more attractive than stocks”. The reason is that stocks are highly valued, which suggests below-average long-term returns, and starting yields are also high, which suggests above-average fixed income returns.
I follow the Bucket Approach artfully described by Christine Benz at Morningstar, recently, in The Bucket Approach to Building a Retirement Portfolio. I consider all my Traditional IRAs, which are managed collectively by Fidelity, Vanguard, and me, to be in the intermediate bucket because of required minimum withdrawals. The stock-to-bond allocation of this bucket is approximately 35% with half in international stocks. I want the intermediate bucket managed for risk-adjusted return.
Another responsibility of mine while working was implementing technology applications. I believe that there are a lot of benefits to artificial intelligence, but it will take more time to implement, require additional costs and resources to implement, and require huge investments in infrastructure. I believe that the domestic start market is overvalued, especially in the information technology sector. The allocation to information technology and communication services in my intermediate bucket is around 25% compared to 40% for the total market.
There you have it. I am a conservative value investor for the most part. Let’s continue with the risk audit.
Combining Tariffs and The Budget Bill
There are major changes happening in tariffs, the budget legislation, and policy changes, and the combined effects of these are unknown. This section focuses on the impacts of these changes. There are other factors as well, such as the impact of deportations on the labor market and the falling value of the dollar.
The Federal Reserve concluded in Trade-offs of Higher U.S. Tariffs: GDP, Revenues, and the Trade Deficit that tariffs can result in significant economic losses for the U.S., China, and the global economy, as much as 2% for the U.S. economy. The Yale Budget Lab estimated in State of U.S. Tariffs: July 7, 2025 that in “the long-run, the US economy is persistently -0.4% smaller.”
Final OBBBA Score Confirms Long Road to Fiscal Recovery by the Committee for a Responsible Federal Budget, estimates that the budget legislation costs $3.4T, as estimated by the Congressional Budget Office, and with interest, may cost $4.1T. The 2025 Budget Reconciliation Act Will Increase Debt While Modestly Boosting The Economy by The Tax Policy Center, estimates that debt as a share of gross domestic product will rise to 127% in 2034, and possibly higher compared to the CBO’s baseline of 117%. Hmmm, 2034 is the year that Social Security benefits will have to be reduced unless Congress acts to resolve the shortfall.
The Tax Foundation wrote Trump Tariffs Threaten to Offset Much of the “Big Beautiful Bill” Tax Cuts, combining potential impacts of both tariffs and the budget bill. They conclude, “Our analysis finds the current US-imposed and scheduled tariffs threaten to offset much of the economic benefits of the tax cuts, while falling short of paying for them.” They estimate that if the tariffs are left in place permanently, they will reduce long-run GDP by 0.5 percent before retaliation.
If tariffs are not passed along to consumers in the form of price increases, then they are absorbed as costs by companies. Zachary Folk at Forbes describes this effect in GM: Tariffs Cost Automaker $1.1 Billion Last Quarter. Shares of General Motors fell 8% upon reporting earnings impacted by tariffs.
Valuation Risk
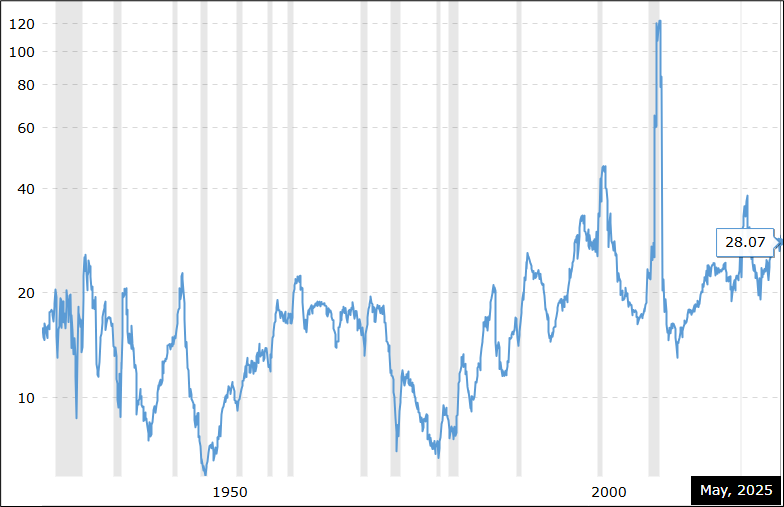
Figure #1 shows the S&P 500 price-to-earnings ratio for the past 90 years. The current price-to-earnings ratio is 29.5, which is higher than 94% of the past 90 years. In my investment model, as we see later, I composite the S&P 500 price-to-earnings ratio along with market capitalization to gross value added, Tobin’s Q Ratio of market value to replacement value, cyclically adjusted price-to-earnings ratio, S&P 500 dividends to 10-year Treasury yield, and Rule of 20 for inflation. No matter how I slice it, U.S. stocks are highly valued.
Figure #1: S&P 500 PE Ratio – 90 Year Historical Chart
Yield Risk
The yield on the US 10-year Treasury rose dramatically during the 1960s and 1970s, as a result of inflation, and fell to extremely low levels following the financial crisis as a result of Quantitative Easing and easy monetary policy. Figure #2 shows the yield on the 10-year Treasury along with the real yield as measured by subtracting the year-over-year changes in the personal consumption expenditures price index.
Since the 1960s, total public debt as a percent of gross domestic product has risen from 40% to 121%. I expect tariffs to increase inflation to 3% or higher in the short term. While I expect short and intermediate yields to fall at the end of the year, rising national debt and inflation could result in periods with higher yields.
Figure #2: Nominal and Real Yield on Ten-Year Treasuries
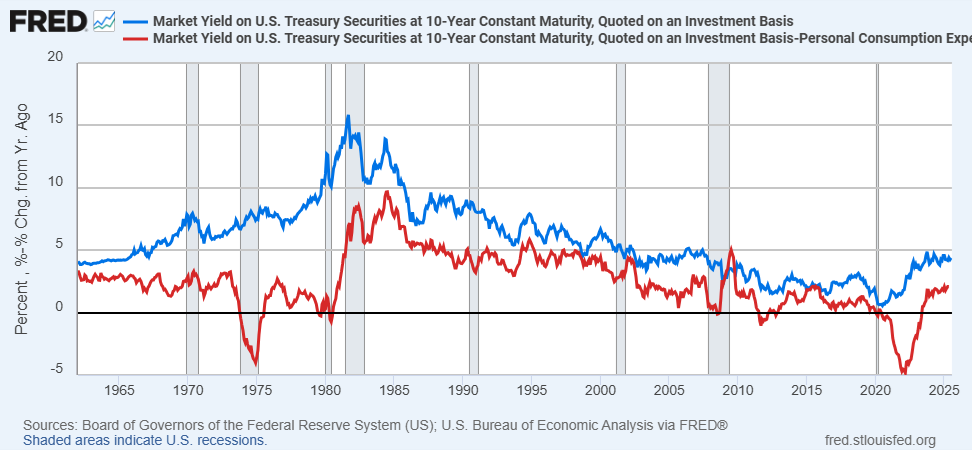
Source: Author Using St. Louis Federal Reserve FRED Database.
Investment Model
Figure #3 contains the results of my Investment Model (black line) compared to the S&P 500 (red line), T Rowe Price Capital Appreciation (PRWCX, purple line), FPA Crescent (FPACX, green line), and Vanguard Wellington (VWELX, blue line), along with my Valuation Indicator (orange dotted line, right scale) where a minus one indicates the stock market is highly overvalued. Here are my observations, 1) over the past thirty years some actively managed mixed asset funds have performed about as well as the S&P 500, 2) during periods with normal interest rates, mixed asset funds can outperform the S&P 500, and 3) since the financial crisis stocks have outperformed mixed asset funds because Quantitative Easing and easy monetary policy punished bond returns and stocks have become highly valued. Real GDP grew at an average 2.55% annual rate from 1995 through 2012, and 2.4% from 2013 through 2025Q1.
I expect the markets to be more volatile over the coming decade with more frequent bouts of inflation. I expect more conservative allocations will again outperform the S&P 500 on a risk-adjusted basis.
Figure #3: Investment Model Results Compared to Selected Mixed Asset Funds
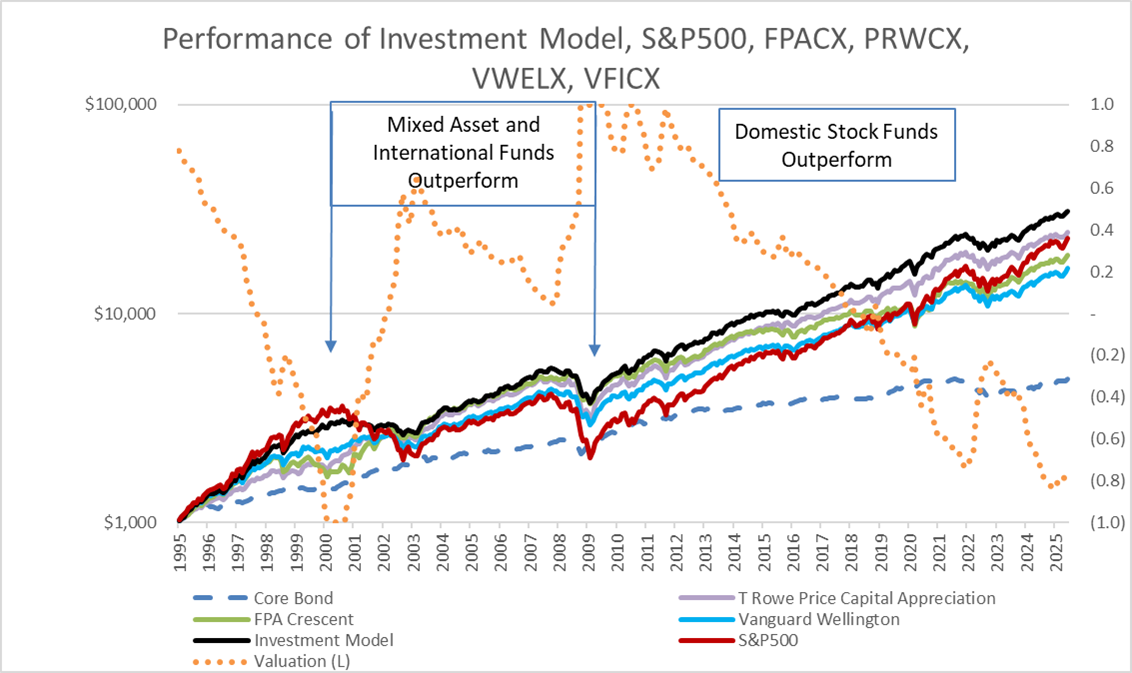
Source: Author Using St. Louis Federal Reserve FRED Database and MFO Premium fund screener, and Lipper global dataset.
Table #1 shows the funds that I use in my investment model. They were selected based on having good risk-adjusted performance for the past thirty years. I use minimum and maximum allocation constraints for the funds. I update small allocation changes quarterly based on volatility-adjusted three-month returns and valuations. The current allocation seems reasonable. The allocation to money markets may be too high if the Federal Reserve lowers interest rates in September. On the other hand, money market funds are available to buy during market dips.
Table #1: Funds in the Author’s Investment Model – Three-Year Metrics
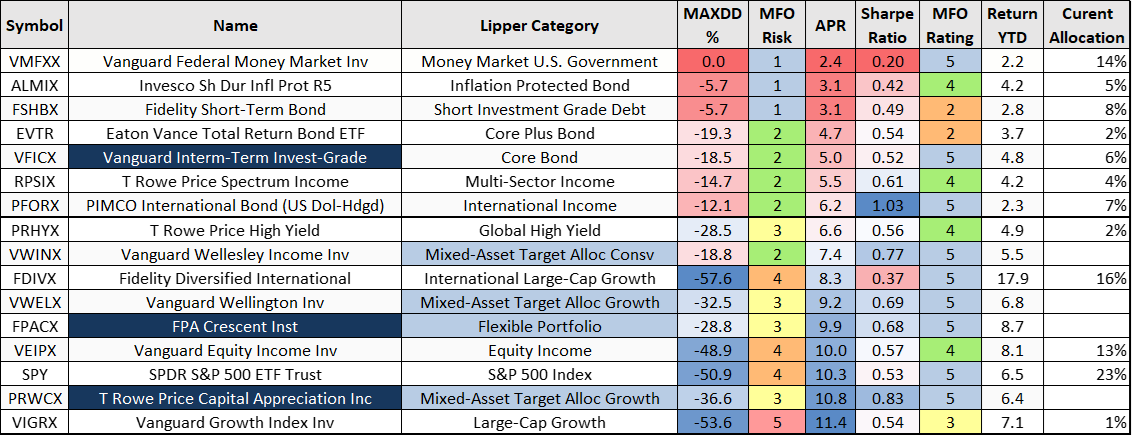
Source: Author Using MFO Premium fund screener and Lipper global dataset; Morningstar for year-to-date returns as of July 24th.
Figure #4: Funds in the Author’s Investment Model
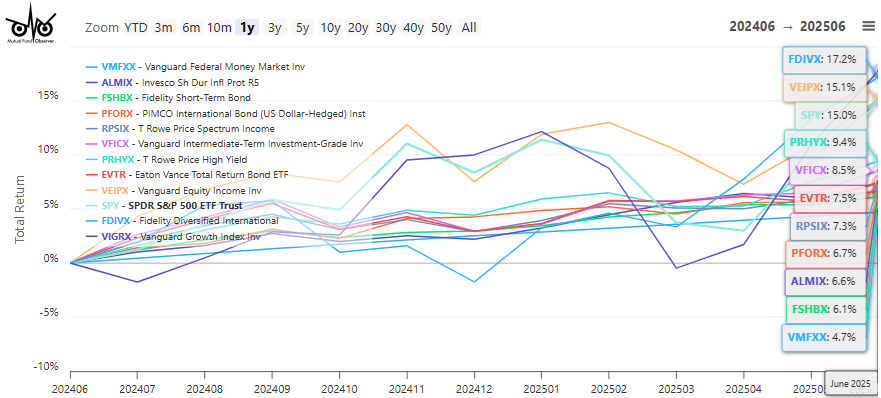
Source: Author Using MFO Premium fund screener and Lipper global.
Risk Assessment of My Portfolio
With a dual-income household, with assets at two asset managers, in multiple types of accounts, we own a lot of funds, but about 40% is concentrated in ten funds.
Below is my portfolio segmented by MFO Risk Rating and MFO Performance Rating for risk-adjusted returns, excluding about 10% that is mostly in bond ladders. The blue shaded area represents funds that have a higher MFO Performance Rating than Risk Rating. Over half of my funds by allocation fall into this sweet spot. The yellow shaded area has an MFO Performance Rating equal to the MFO Risk rating. I expect these to be mostly passively managed index funds. Nearly a third of my portfolio is allocated to the yellow shaded areas. The red shaded area represents allocations to funds that have a lower risk-adjusted performance rating than the MFO Risk. These are mostly international funds that had below-average risk-adjusted performance over the past three years but have done great year-to-date.
Table #2: MFO Risk and Performance Rating of Author’s Portfolio
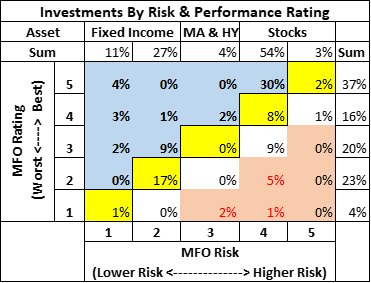
Source: Author Using MFO Premium fund screener and Lipper Global.
In summary, my portfolio is well diversified without much in higher-risk funds (MFO Risk = 5). The funds with below-average MFO ratings are mostly money market funds and short-term bond funds, which don’t concern me.
During secular bull markets, it is difficult for an actively managed fund to outperform a good passively managed index fund. I believe that in a secular bear market or even volatile markets, actively managed funds can outperform a passively managed index fund, particularly on a risk-adjusted basis.
Table #3 below shows the percentage of the allocation from actively managed funds. Most funds that outperformed were actively managed (blue shaded area). The equity funds that underperformed included more passively managed funds. Over half of the equity funds managed by Vanguard in my portfolio are actively managed.
Table #3: Percent Actively Managed Funds in Author’s Portfolio
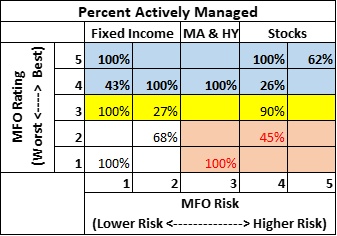
Source: Author Using MFO Premium fund screener and Lipper Global.
Closing
I am currently reading “Our Dollar, Your Problem” by Kenneth Rogoff, which looks at the future of the dollar as the world’s reserve currency and financial stability. Dr. Rogoff was at a lunch in China in 2005 and was asked to say something about the global economy. He described his answer as:
“I pointed to the high level of consumption in the United States, partly financed by consumers borrowing against their homes. Correspondingly, it seemed that the level of consumption in China was extraordinarily low, even by the standards of Asian economies. That was helping to produce a large flow of funds from China to the United States. That inflow, in turn, was contributing to very low interest rates in the United States, not only for the government but also for households, as well as a massive run-up in equity and housing prices. Near term, the risks were greater for the United States.”
Here we are, twenty years later, and low interest rates and massive financial stimulus have again contributed to high equity prices and, more recently, to inflation. I wrote Living Paycheck To Paycheck and the Role of Financial Counselors for the Mutual Fund Observer November 2024 newsletter, in which I described that about a third of Americans are living paycheck to paycheck with no savings, and another third are living paycheck to paycheck without enough savings to cover three months of living expenses. Tariffs are a regressive tax on consumers. Consumers will have to adjust their spending habits as low-cost imports become more expensive.
I skipped to the final three-page chapter of “Our Dollar, Your Problem” to read what Dr. Rogoff views as our potential risks. These include the decline in the dominance of the dollar, “false sense in U.S. political circles (and among many economists) that ultra-low interest rates are almost certainly the future norm”, rapidly rising debt, “sustained period of global financial instability marked by higher average real rates and inflation and more frequent bouts of debt and financial crises”, “another bout of high inflation over the next five to ten is years is not only possible but likely”, and less independence of the Federal Reserve.
I don’t expect an inflationary period like the U.S. experienced from 1966 until 1982. However, in the hundred years prior to 1982, recessions occurred every four years. Since then, recessions have occurred on average every ten years due in part to globalization and rising national debt. My risk assessment warns that my portfolio should be able to withstand more frequent periods of inflation and financial crises. Now is a time for active portfolio management to manage higher risk and to check on our margin of safety.