


For most accounts, my primary investing objective is risk-adjusted return with dividends reinvested. I have set up automated withdrawals to transfer money from a conservative Traditional IRA (Core TIRA) in the Intermediate Investment Bucket to the Short-Term Investment Bucket. Having a steady income just took on a higher priority.
In this article, I look at how historical distributions fluctuate according to either the interest rate cycle or the stock market cycle, along with four funds that have the potential to produce steady yields. The Coming Decade section shows that yields on short and intermediate term Treasuries are falling while long-term rates are rising.
From a 30,000-foot view, Corporate Debt BBB-Rated, Multi-Sector Income, Short High Yield, and Loan Participation Lipper Categories have the potential to produce income in an environment with low yields on short-and intermediate Treasuries. From a 10,000-foot level, I identify funds that have consistent, high-risk-adjusted returns with respectable yields over the past twelve months (TTM), including capital gains. Arriving at the Ground Level, I create an example portfolio that would have achieved an APR of 7.7% for the past 5.9 years with a maximum drawdown of -9.8% and yield (TTM) of 5.2%.
Understanding Yields
As the Federal Reserve lowers the rate that banks charge each other for short-term loans, known as the federal funds rate, the yields on some funds will also fall. The key takeaway from this section is that yields on many funds will fluctuate according to either interest rate or stock market cycles, while a few funds have consistent distribution yields.
Morningstar has concise information for the past five years, including price at distribution and the type of distribution (income, short-term and long-term capital gains, and return of capital). Dividend.com and Seeking Alpha have longer histories of distributions, but without the price at distribution. NASDAQ has historical prices. For this exercise, I calculated the average total distribution as a percent of the average price of the fund for each of the past seven years.
Table #1 shows the distribution yield per year for each of the funds in my Core TIRA, with red shading indicating the lowest yield and blue the highest. All of the funds averaged a yield of at least 3.2% over the past six years, with PAIMX averaging 6.0%. Those whose inception date is after 2019 have the symbol shaded yellow. Three funds (FPFIX, JAAA, PVCMX) have higher yields when interest rates are high, but may have downward pressure as interest rates fall. Those whose yield fluctuates more with the stock market cycle (PCBAX, AVALX, CTFAX) tend to distribute capital gains when opportunities in the stock market appear to be lower. From the standpoint of steady income, PMAIX and PONAX are the clear winners, with PMAIX having the potential for higher total return.
Table #1: Historical Distributions Yields (Dividends, Capital Gains, Special)
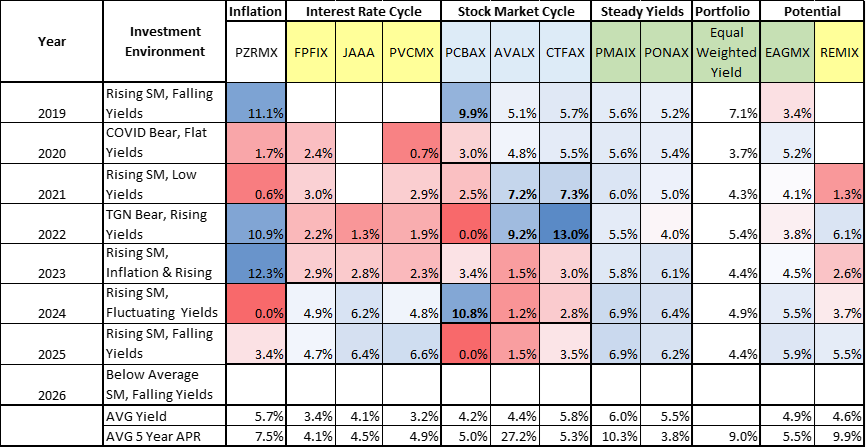
Source: Author Using MFO Premium fund screener and Lipper global dataset.
The Core TIRA, excluding iShares Gold Trust (IAU), would have yielded more than 4% in every year except for 2020 during the COVID bear market with low yields on Treasuries. Of the two funds that I am considering adding in my mid-2026 review, EAGMX has high, steady yields, while REMIX has a low correlation to the S&P 500 and bonds, and higher potential for total return.
The Great Normalization (starting in 2022), with rising rates and a bear market in stocks, influenced me to develop a portion of my portfolio covering basic withdrawal needs that would do well during an extended severe bear market. When rates went over 4%, I began locking in yields by creating a bond ladder to lock in high yields. I plan to keep a rolling ten-year rolling ladder as long as yields are favorable.
The Coming Decade
My view of the next decade is that initially, short and intermediate term Treasury yields will fall because of the weakening labor market. High deficits and national debt will lead to efforts to lower the cost of financing the debt. The Federal Reserve is expected to continue lowering short-term rates, while the Treasury is pressuring longer-term rates lower by issuing short-term Treasury Bills and its buyback program.
Figure #1 shows the current yield curve for Treasuries compared to when tariffs were announced, as well as a somewhat normal yield curve from January 2024. Yields on short and intermediate Treasuries are falling. The risk of rising national debt and inflation is pushing longer-term rates higher. Quantitative Easing pushed long-term rates lower in the decade following the Great Financial Crisis, as shown for 2018.
Figure #1: Treasury Yield Curves
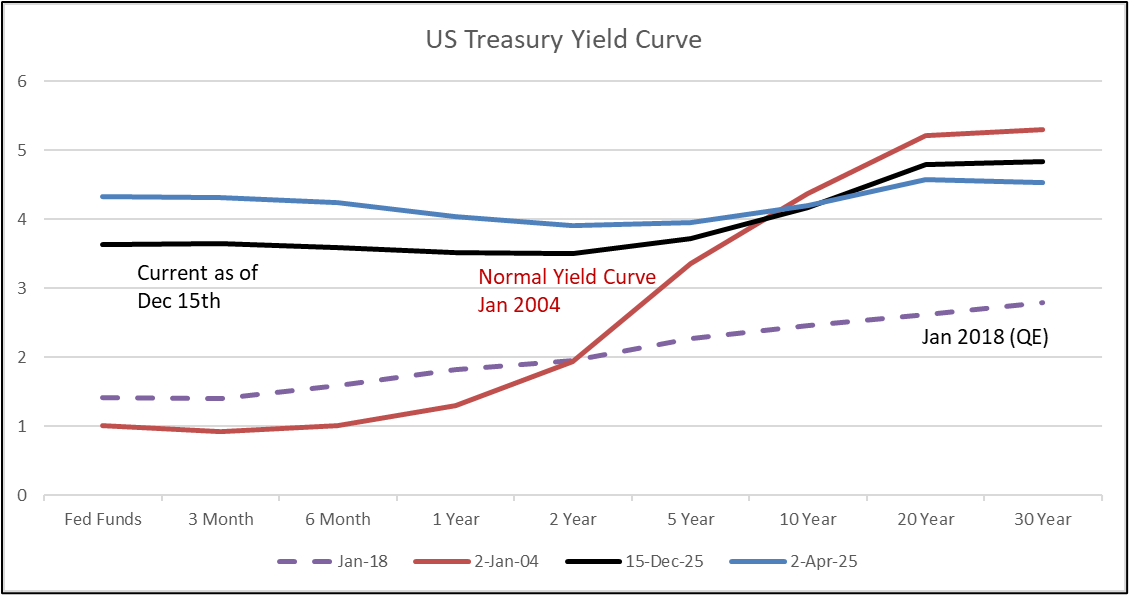
Source: Author Using St. Louis Federal Reserve (FRED) Database.
30,000 Foot View
Table #2 shows how nearly 1,500 funds performed across seven bear markets, sorted by returns. On the left are the Lipper Categories with positive returns. There are no surprises here – gold, government bonds, and short-term investment-grade debt provided positive returns on average. During periods of low yields on government debt, most of these funds have not had high returns, and I am seeking income elsewhere. During the decade from 2010 through 2019, the average yield on a 10-year Treasury was 2.4% compared to 4.4% for the previous decade.
Table #2: Lipper Category Performance During Bear Markets
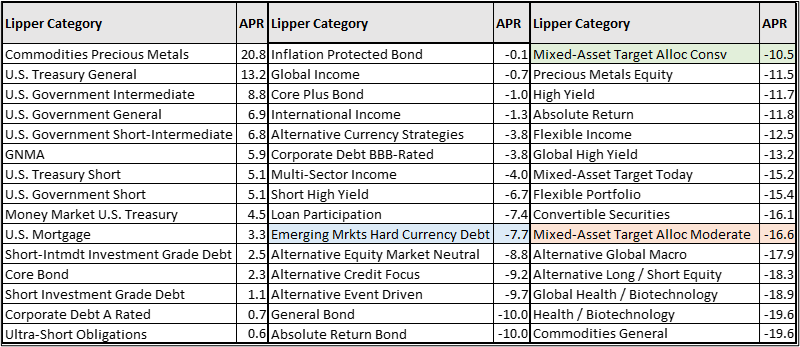
Source: Author Using MFO Premium fund screener and Lipper global dataset.
The categories on the right generally fare better than the S&P 500 during a bear market. Conservative mixed-asset funds had a drawdown of about one-third of the S&P 500 (-34%) while moderate mixed-asset funds lost about half. The middle column is interesting because it has the potential to produce income with relatively low drawdowns. Emerging market debt fell to about a quarter of that of the S&P 500.
Table #3 shows some of the Lipper Categories where an investor had the potential to make at least 4% annualized in the decade beginning in 2010, and with relatively low drawdown. They are sorted from the highest risk-adjusted return (Martin Ratio) to the lowest.
Table #3: Lipper Category Performance During 2010 Through 2019
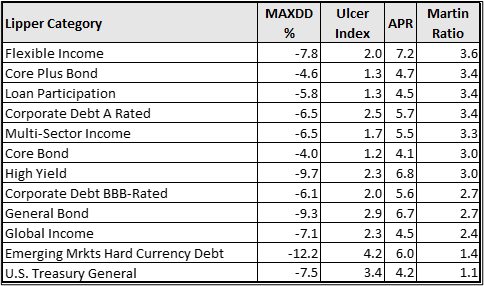
Source: Author Using MFO Premium fund screener and Lipper global dataset.
10,000 Foot View of Risk, Reward, and Income
This past month, I set up twenty “pass or fail” tests for nearly seven hundred funds that I track, and identified around seventy funds that passed at least seventeen of these tests. For example, one test is that in periods of low yields, during which the fund was in existence, it had returns of at least three percent. Other tests were for risk, consistency, returns, yields, and so on. These sixty-seven funds now make up my 2026 Watch List.
Figure #2 shows yield (TTM) versus risk as measured by the Ulcer Index for thirty-five funds in my 2026 watch list. The red squares are Loan Participation funds. Multi-sector funds (black triangle) have more diverse performance. Performance of high-yield funds (gold diamonds) is also very diverse. Those in the lower right-hand corner are mostly in the mixed-asset and flexible portfolio Lipper Categories. As pointed out earlier, funds with a lower risk of drawdown have yields that tend to fluctuate with the interest rate cycle, while higher risk funds have yields that tend to fluctuate with the stock market cycle. Those in between may have the potential to provide a steady income.
Figure #2: Yield (TTM) vs Risk (Since January 2020)
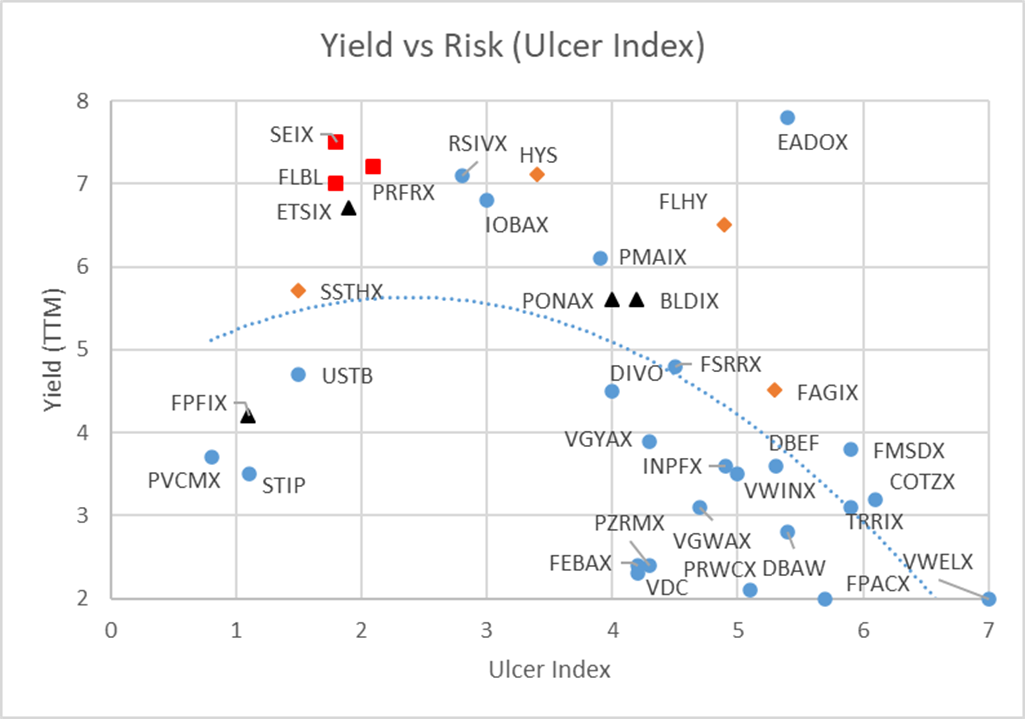
Source: Author Using MFO Premium fund screener and Lipper global dataset.
Figure #3 shows the yield (TTM) versus return of some of the funds in my 2026 Watch List. If yield is a consideration when designing a portfolio, moderately risky funds can be identified that pay a decent dividend. Standpoint Multi-Asset (REMIX), Amplify CWP Enhanced Dividend Income ETF (DIVO), Victory Pioneer Multi-Asset Income (PMAIX), and Eaton Vance Emerging Markets Debt Opportunities (EADOX) stand out for having both high returns and a higher yield (TTM).
Figure #3: Yield vs Return – Since January 2020
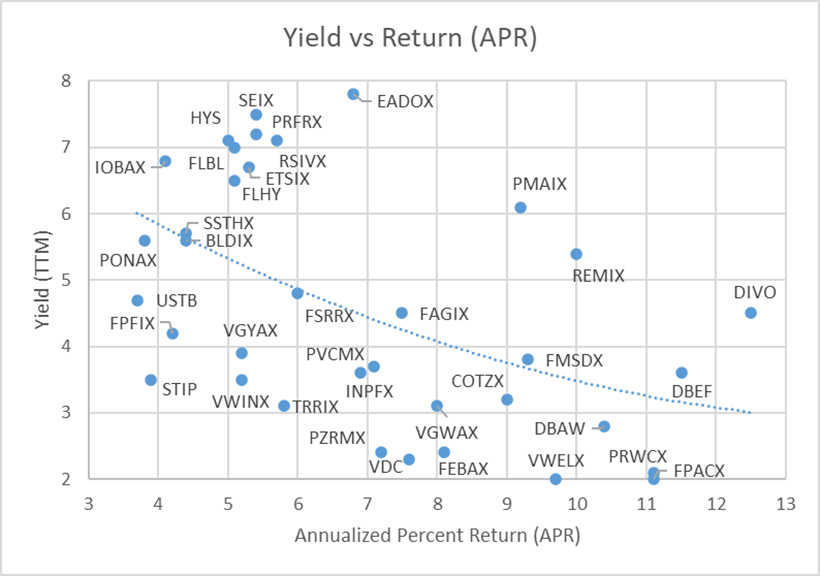
Source: Author Using MFO Premium fund screener and Lipper global dataset.
Ground Level View of Income Funds
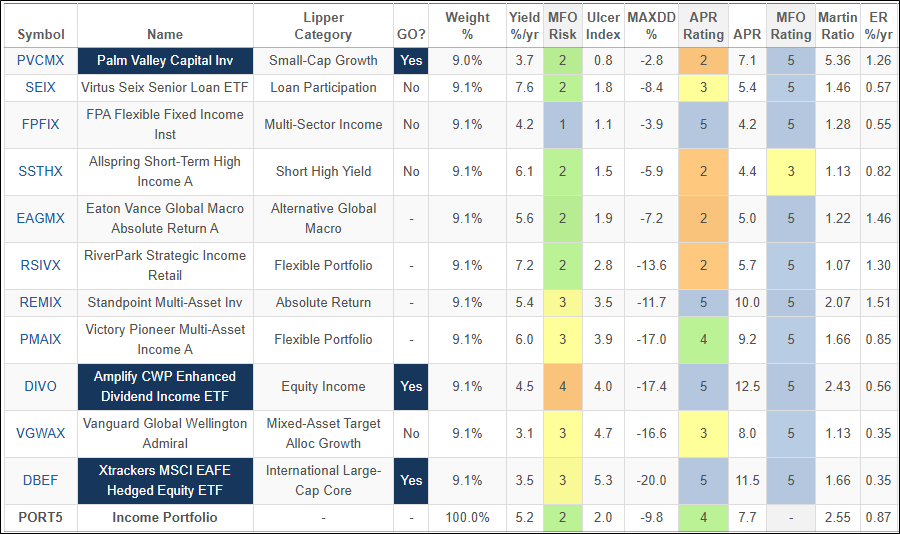
Table #4 is my short-list of income-producing funds. The five funds shaded blue are in my conservative Core TIRA. I own shares in the two green shaded funds in other accounts. I find the four funds that are shaded yellow to be potential buy candidates for the Core TIRA. “Sigma Year APR” is the “typical year-to-year variation in return APR since fund inception”.
Table #4: Funds with High Yields by Risk Level – Since January 2020
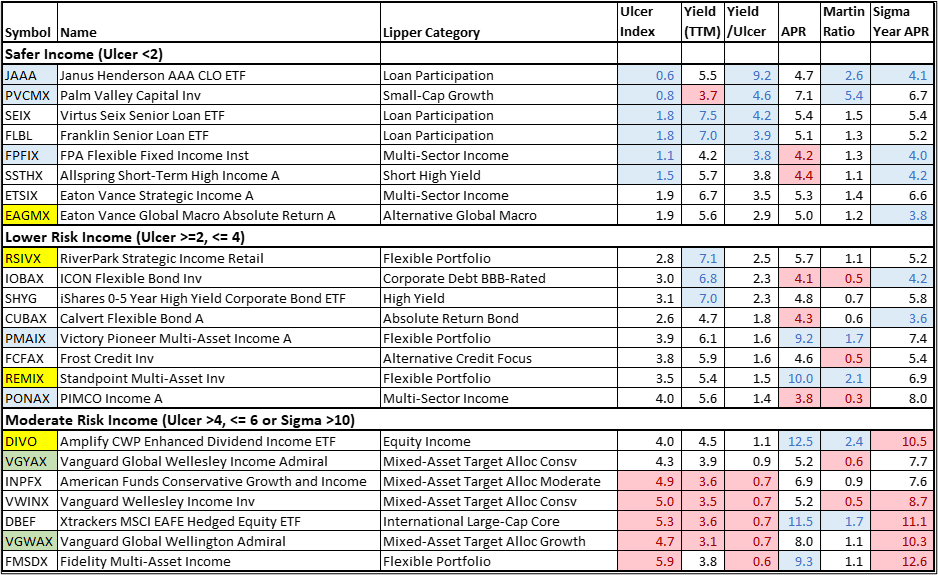
Source: Author Using MFO Premium fund screener and Lipper global dataset.
NOTE: Metrics for JAAA are life of fund, which is less than the others.
In Figure #4, I selected funds with consistent risk-adjusted returns that pay a high yield (TTM). The bubble is proportional to the yield.
Figure #4: APR vs Risk with Yield
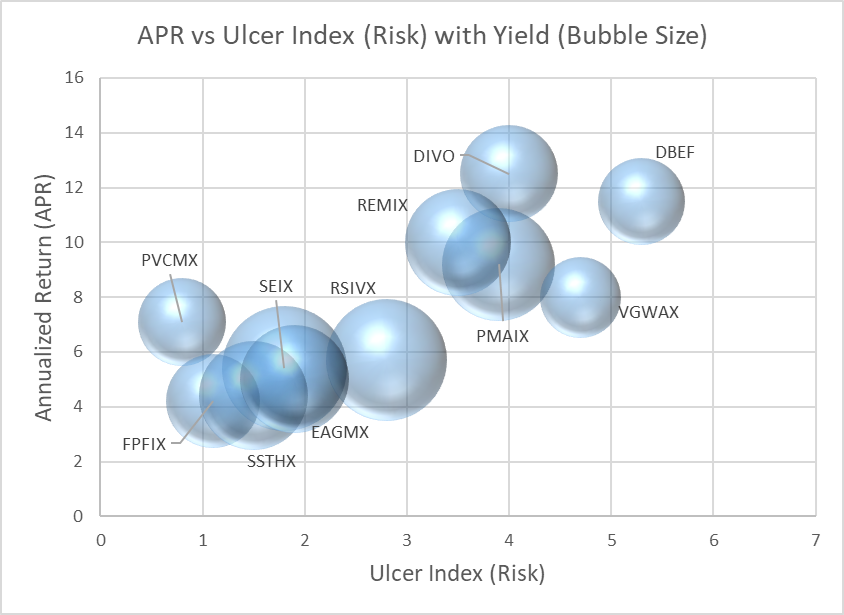
Source: Author Using MFO Premium fund screener and Lipper global dataset.
Table #5 is an equal weighted portfolio of the high-income funds shown in Figure #4 above. The yield is 5.2% with an APR of 7.7% and a maximum drawdown of -9.8% for the past 5.9 years.
Table #5: Portfolio of High TTM Yield Funds – Metrics 5.9 Years
Source: Author Using MFO Premium fund screener and Lipper global dataset.
SHARE CLASSES
As a general practice, I use share classes of funds that are available at Fidelity without a load or transaction fee. Fidelity has been offering more funds with no load and no transaction fee, so I have expanded my universe of funds tracked. Table #6 shows the share classes available at Vanguard and Fidelity, along with a highly rated ETF in the same Lipper Category if it is in my watch list.
Table #6: Share Classes Available at Fidelity and Vanguard

Source: Author
Closing
Over the years, I have dabbled in income-producing funds, including closed-end funds, but was disappointed with the high volatility and drawdowns. I began using the “Yield/Ulcer Index” as part of my rating system, but historical yields tell a more complete picture. Before my 2026-midyear review, I plan to calculate the historical distribution yields for a select group of about forty funds in my watch list to help make informed decisions.