


MFO’s founding mission is to “write for the benefit of intellectually curious, serious investors— managers, advisers, and individuals—who need to go beyond marketing fluff, beyond computer-generated recommendations and beyond Morningstar’s coverage universe.” But one of our core precepts is “80% of all existing funds could disappear today with no loss to anyone, except possibly the managers who have to explain it to their spouses.” The goodriddance group includes two overlapping sorts of idiocy: (1) many are launched at the behest of an advisor’s marketing department or strategic team. Short version: “hey, we need at least one bond fund if we’re going to keep their money in-house. Why don’t you go make one for us?” Or “everything who’s anybody has a target-date retirement series. Why don’t we have a target-date retirement series, hmmmmm???” And (2) many are cynical ploys to play on human weakness. Short version: “look, the guys in my fantasy football league know Tesla better than Musk does, and they want a way to do a quick-pivot from doubling down on Tesla’s morning performance to double-shorting it in the afternoon, so let’s do this crazy thing!”
Through November 1,087 new funds and ETFs were launched in 2025. Of those, over 300 were niche trading toys: ether, hedged bitcoin, crypto index, altcoin, onchain, Litecoin, bitcoin covered call, long bitcoin / short ether, hedera coin, double-short Palantir, leveraged long + income Palantir, selling put options on ETFs that are double-long Robinhood Markets stock … The mix included six new ways to play Tesla, up or down, and one that combines Tesla and Uber, which gives us a total of 13 Tesla-specific ETFs.
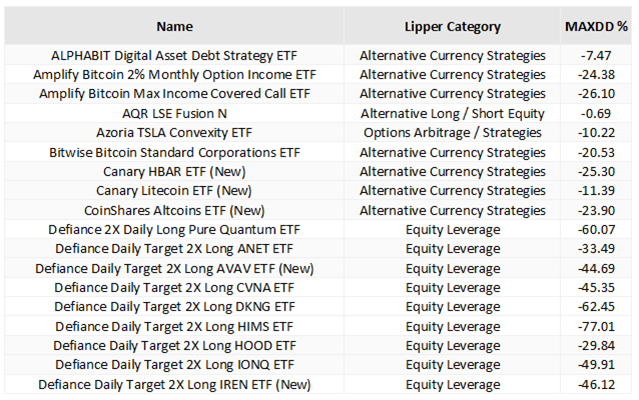
Bad news: these are designed to suck the life out of you, while convincing you that you’re better at this than Warren Buffett ever was. Look at column #3, dear friends: losses of 50-75% before they reach their first birthday. They are invitations to play a trading game where your reaction time is measured in minutes and your opponents’ are measured in milliseconds.
Good news: these are going to perish in droves because they’re a bad idea and they can’t convince enough people long enough that they aren’t. That was the fate of the flood of internet funds (remember Nothing But Net?), blockchain funds, the flood of “green funds,” the flood of alts-for-the-masses funds, the flood of emerging market consumers funds …
And yet, each year also brings several dozen legitimately interesting opportunities: often experienced managers or teams exploring new asset classes or extending proven disciplines in interesting new ways. We want to suggest that you add 10 notable rookies to your year-end research list.
What makes these funds rookies? Our sibling site, MFO Premium, has an amazing fund screener which does calculations inconceivable on any site charging less than $12,000 a year (looks toward Chicago). One function of the site allows you to screen funds by age (from “launched this year” to “rookies” to “over 90 years old”). The rookie screener selects for funds with between one and two years of operation: long enough to take a few hits, short enough to remain fresh and interesting.
What makes these funds notable? We screened each of six broad baskets of rookie funds – US equity, global equity, international equity, mixed asset, alternatives, and bonds – for funds that met two performance criteria. First, they had to have downside deviation ratings that were average-to-excellent.
“Deviation” is a fund’s bounciness. Standard deviation measures the bounces both up and down. Downside deviation recognizes that you don’t object to having your fund bounce higher; you’re only steamed when it bounces down. So downside deviation measures a fund’s return below the risk-free rate of return; that is, if you make less in a period than the 90-day T-bill, you’re generating downside, and we’re measuring it.
Second, they had to have Ulcer Indexes that were average-to-excellent. The Ulcer Index captures two metrics: how far a fund falls and how long it stays down. The logic is simple: if your manager (or index) falls flat on their face and struggles to get up, you’re going to get an ulcer. Big fall, long time down = major ulcer, high Ulcer Index. Little stumble, up and dusted off = barely any ulcer at all.
That gave us a list of funds that, so far, have resisted the impulse to implode. We then sorted by Sharpe ratio – the most common measure of risk-adjusted returns – and began with the fund atop the list. If that fund shows two further criteria – it’s available to the general public, and it does not evidently rely on financial engineering, blackbox strategies, or disciplines so complex that I couldn’t explain them to myself – then we shared them with you. After that, I scanned the top 10 list in each category, asking the question, “What looks interesting here?”
Our answers follow.
US equities
First Trust Bloomberg R&D Leaders ETF
What can I say? The ETF tracks an index of large cap companies that (a) put a lot of money into research and development and (b) have increased that commitment in each of the past three years. It ranks them, invests in the top 50, and rebalances once a year. The target is finding companies that are reinvesting in their own growth. Here are the particulars from First Trust:
- begins with a universe of all the securities comprising the Bloomberg US 1000 Index
- screen for firms in the top 10% of market cap and trading volume, which means “large and liquid.”
- Within that subset, identify firms that have both increased R&D expenditures for three consecutive years and are in the top 10% for in R&D Expenditures to Sales Ratio
- Invest in the 50 largest
- Rebalanced quarterly, reconstituted semi-annually.
The fund’s Investors Guide is pretty thin. The short summary: the world is changing fast, R&D is essential to keeping up, and we find the most R&D intensive large caps for you. Plausible, though not a lot of depth there. The premise that companies investing heavily in R&D will matter more than those coasting on yesterday’s patents isn’t new. What’s new is that ‘R&D’ in 2025 increasingly means AI compute clusters and model training, not better mousetraps. First Trust isn’t picking winners; they’re just betting that the companies willing to light billions on fire today are more likely to own tomorrow than those protecting margin today. Those interested in a more active approach to the same discipline might consider Guinness Atkinson Global Innovators Fund (IWIRX), a five-star actively managed fund that found life in the late 1990s as the Wireless (magazine) Index of innovative companies. Matthew and Ian do exceptional work.
Capital Group Conservative Equity ETF (CGCV)
The $111 billion American Funds American Mutual Fund (AMRMX) annoys me. First, you’ve got this dumb reduplicative name. Second, they push it out in 19 distinct share classes. Third, it’s a whale: $111 billion, with low Active Share (58) and a 0.58% expense ratio on the “A” shares. That having been said, it’s also got $111 billion for a reason: it’s really good at delivering what it promises and has been so for a really long time. American Mutual does not specialize in raw outperformance – over the past 60 years, it has outperformed its peers by an average of just 0.3% per year – it specializes in getting you there with less trauma. MFO Premium tracks dozens of risk metrics, and AMRMX outperforms its peers on virtually every metric for virtually every trailing period.
CGCV is the ETF version of that fund. While it is only 1% of the size of American Mutual, the ETF charges substantially less than the retail “A” shares of the fund for the same strategy and same management team.
What you’re getting: Conservative Equity tries to balance current income, growth of capital, and principal protection. It typically holds about 90 stocks, primarily in well-established, dividend-paying US and Canadian companies with strong balance sheets. We checked 756 rolling three-year periods for American Mutual, dating back to 1960. The typical experience of an investor holding on for three years is a return of 11.0%. Its worst-ever three-year run was -11.0% and its worst-ever five-year span was -4.1% APR.
Mixed asset lead profile
T. Rowe Price Capital Appreciation and Income Fund (PRCFX)
The fund many people wished they were in is T. Rowe Price Capital Appreciation, but you can’t have it. The fund has been kicking butt, under three different managers, since the 1980s: for every trailing period from one to 40 years, it has higher total return, higher Sharpe, smaller maximum drawdown, and lower Ulcer Index than its peers. And it’s closed.
The fact that the success spans manager tenures suggests it’s the process that works, and TRP has been rolling out a suite of funds that incorporate variations of the discipline. This version is a mixed‑asset conservative fund that seeks total return by pairing income‑oriented fixed income with a risk‑aware equity sleeve, typically keeping roughly half to two‑thirds of assets in bonds and other debt instruments and the balance in stocks. With a 12.5% APR that is about 1.9 percentage points ahead of its peer group and a Sharpe ratio of 1.52, it has delivered competitive results with a profile designed to feel more like a cautious “paycheck plus growth” vehicle than an aggressive balanced fund. What really sets PRCFX apart is that it extends the discipline, team, and “capital appreciation with downside defense” DNA of the long‑closed Capital Appreciation Fund into a more income‑tilted format, giving investors access to a seasoned, franchise‑level process that was previously hard to reach.
International equity funds
SEI Select Emerging Markets Equity ETF (SEEM)
SEI is a manager-of-managers (MOM?) advisor. We all know that within any asset class (US equities), there are many sensible investment approaches, but no one strategy (large-cap momentum) works all the time. One alternative is that you could own three or four complementary funds and then shift their weight in your portfolio as market conditions change. Or you could surrender that particular fantasy and adopt a new one: you’ll hire someone who will hire managers representing three or four complementary strategies and will rebalance them for you within the fund. That “someone” is SEI.
For SEEM, SEI hired three fundamental EM managers—one focused on quality, one on momentum with a small-cap tilt, one on value with macro overlay—and then uses their own quant tools to decide how much each should control.
The goal is a broadly diversified, all‑cap portfolio across Asia, Latin America, Africa, and other developing regions. The fund has had an unusually strong first year, with both higher returns (29% APR vs 24% for its peers) and lower volatility (measured by maximum drawdown, standard deviation, and downside deviation) than its peers, leading to substantially higher risk-adjusted returns metrics (Sharpe ratio and Ulcer Index are strikingly higher). The fund has drawn $320 million in assets and charges 0.60% after waivers, a noticeable bargain price.
One caveat is that the MOM approach does not tend to generate star performance. Morningstar tries it with their nine house-branded funds, seven of which are three stars or below. Litman Gregory (which now bears the ugly name iMPG) made it the heart of their business model in the Masters funds, only two of which survive. SEI has done exceptionally well with the model, but the caveat remains. The other is that not a single one of the thirty-eleven managers, including SEI employees, has invested a penny of their own money in the fund.
GMO International Value ETF
GMO International Value ETF (GMOI) is the retail incarnation of GMO International Opportunistic Value (GTMIX), an institutional fund that’s been around since 1998. The strategy there (and here), is to concentrate on what GMO calls “deep value” stocks in developed markets outside the U.S., seeking total return from a heavily contrarian, valuation‑driven discipline.
Its record since inception is exceptional, though perhaps a tiny bit irrelevant. It has outperformed its peers over every trailing measurement period (3-, 5-, 10-, 20-, inception), generally by 100 – 250 bps. Its risk metrics (maximum drawdown, standard deviation, downside deviation) are generally in line with or better than its peers, and its risk-adjusted returns metrics (Sharpe ratio and Ulcer index) are consistently better. The three current managers arrived in May 2023, meaning this 27-year track record is largely someone else’s work, even if the new team has decades of GMO experience elsewhere and responsibility for implementing the strategy that others have piloted. (And two of the three have declined to invest in the ETF.)
The ETF has done well since launch. Its 31.7% APR beats its peers by 620 bps, and its risk metrics have been pretty much in line with its peers. The fund has gathered $215 million in assets in just over a year. This rookie vehicle is part of the rising wave of ETF launches, which give the rest of us access to an institutional‑grade GMO discipline that has historically lived in separate accounts and mutual funds.
Global equity funds
Rockefeller Global Equity ETF (RGEF)
Rockefeller Capital Management launched a Global Equity Strategy in 1991. Marketed primarily for institutional clients, intermediaries, high-net-worth individuals, and family offices, the strategy has accumulated $4.5 billion. There’s no public performance record that we can find. The Rockco.com website is among the world’s most annoying, offering a rich and slow-loading visual experience with virtually no content concerning its investment capabilities beyond the moral equivalent of “we cool. We cool!”
Here’s what we do know. The firm talks a lot about the overemphasis on short-term metrics among most investors (it has its roots in 1882 so the bias is explicable), about its global scope and unconventional sources of insight (mostly unexplained). The firm has three equity and three muni bond ETFs. The two older equity ETFs (Climate Solutions and US Small Cap Core) are … okay. Climate Solutions is in a meaningless peer group (Specialty / Miscellaneous), and Small Cap mostly tracks its peers.
In October 2024, the firm launched Rockefeller Global Equity ETF (RGEF) with approximately $700 million in assets. This actively managed ETF invests primarily in large‑cap stocks across developed and emerging markets, using a bottom‑up fundamental process to build a 45–75 stock portfolio of companies with durable competitive advantages and a long‑term earnings runway.
It has done quite well, on both upside and downside measures, in its short life. It has an APR of 23.2% versus its peers’ 18.9%, with dramatically lower volatility and a dramatically higher Sharpe ratio. Whether the advisor’s opacity reflects confidence born of 33 years managing money for people who know them personally, or simply indifference, is unclear. What is clear: investors considering RGEF are being asked to trust the Rockefeller name more than any articulated investment philosophy.
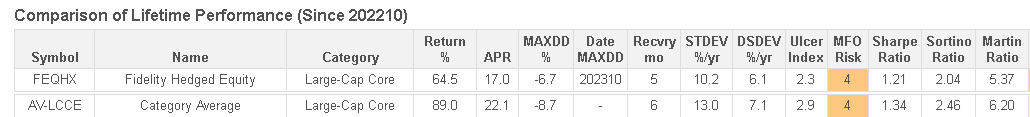
Fidelity Hedged Equity ETF (FHEQ)
This is the ETF version of Fidelity Hedged Equity Fund (FEQHX), a $550 million, four-star fund whose two managers are responsible for about $1 billion in hedged equity products at Fido. At base, the managers construct an equity portfolio that looks like the S&P 500 and then buy puts on their holdings to buffer the effects of market declines. The puts can rise in value when markets fall, so they make a positive contribution at much less than the cost of shorting stocks as a hedge.
We long ago stopped reading Fidelity’s annual reports and manager “interviews” because they are so templated and sanitized that you learn virtually nothing from them, and that’s the case here, too. A chatbot comes across as much human and thoughtful. That said, the fund’s performance numbers are solid.
Relative to an unhedged peer group, the fund posted solid absolute returns with 15-20% less volatility.
FHEQ is an actively managed global large‑cap core strategy that owns a diversified equity portfolio while using put options and related techniques to buffer downside, targeting a smoother ride through equity cycles. Its 19% APR, about 0.2 percentage points ahead of peers, and a 1.81 Sharpe ratio suggest that investors have been reasonably rewarded for accepting the complexity and costs of its options overlay.
The fund charges 0.55%, the ETF charges 0.48%. It’s a fascinating insight into the changing dynamics of the industry: the fund with the exceptional public record has drawn fewer assets in 40 months ($550 million) than the ETF has in 20 months. ($620 million).
Capital Group Global Equity ETF
Capital Group Global Equity ETF (CGGE) is a global large‑cap core ETF that mimics American Funds Global Insight (AGVHX). Same management team, same discipline.
Global Insight is an actively managed global large‑cap equity fund that aims for prudent long‑term growth of capital while seeking to limit downside risk. It invests mainly in established companies across the U.S. and international markets, with meaningful exposure to sectors like industrials, technology, and financials. It has a far larger non-US stake than its peers (44% versus 34%), low turnover, low Active Share, and more industrials (21% versus 13% for peers) than more. So far, that has not triggered a noticeable performance difference with its peers – it trails by 0.9% annually with a little less downside, leading to comparable Sharpe ratios.
The ETF has performed exceptionally well, but that translates to “the ETF has operated for its first 16 months in a market that favored it;” its longer-term performance is likely to be another verse of the Global Insight song, “stodgy, cheap, reliable me!” The argument for the ETF is that it offers a more tax‑ and fee‑efficient wrapper. The ETF charges 0.47% on $1.4 billion in assets, the fund’s retail “A” shares ring in at 0.86% on $19 billion in assets.
Bond funds
Palmer Square Credit Opportunities ETF
Palmer Square Credit Opportunities ETF (PSQO) is an actively managed, flexible multi‑asset credit strategy that allocates across CLOs, corporate bonds, ABS, and bank loans, drawing on Palmer Square’s existing opportunistic multi‑asset credit strategies and funds. Palmer Square frames it in terms of the opportunistic, relative‑value credit approach they’ve been running across separate accounts, funds, and other vehicles … but it does not identify one specific mutual fund or listed fund that PSQO is meant to replicate.
The fund has only been around a year, but has dramatically outperformed its Global Income peer group in that period.
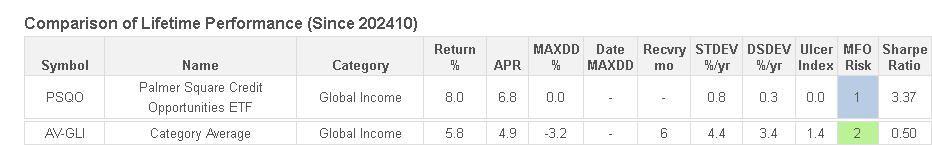
The main “red flag” is that PSQO is a complex, opportunistic credit vehicle whose risk may only show up under real stress; it belongs firmly in the adventurous side of a bond sleeve, not as a core bond replacement. It has attracted about $107 million in assets over its first year of operation and charges 0.52%.
Palmer Square CLO Senior Debt ETF
Palmer Square CLO Senior Debt ETF (PSQA) tracks the Palmer Square CLO Senior Debt Index. Senior debt sits atop the stack of debts to get paid in the case of a default. As a general matter, CLO senior debt has returns like intermediate bonds but responds to a different set of risk factors. It is not high-yield debt, Palmer Square screens for securities with the equivalent of AA or AAA ratings, but like high-yield debt. CLO senior debt is sensitive to default or impairment rates but not sensitive to rising interest rates.
The index has returned 3.46% annually since 2012 and 4.75% annually over the past five years, which sort of looks like this:
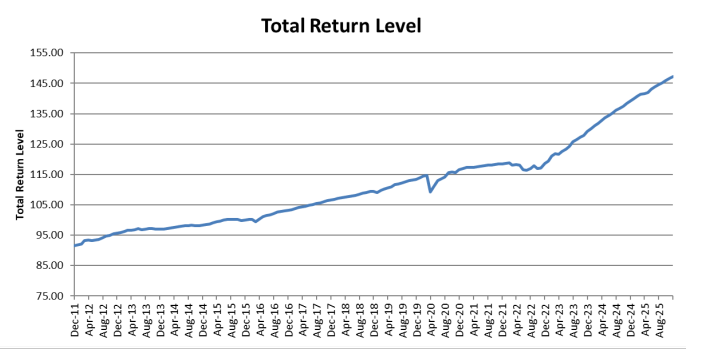
The ETF itself has returned 5.9% in its first year with far better risk metrics than the average “loan participation” fund, so that its Sharpe ratio is twice as large. This strikes us as a “know what you own” story: structurally safer than mezzanine CLO exposure, but far from a simple investment‑grade bond fund, and not something to hold without tolerance for complexity and episodic drawdowns even if backward‑looking Sharpe ratios look excellent.
CrossingBridge Nordic High Income
Let’s start at Square One: I’m a fan of CrossingBridge. I’m amazed by the consistency with which David Sherman and his team have done exactly what they’ve promised: generated substantial upside with extremely well-managed downside in a collection of strategies that you can’t find elsewhere. I’m invested in two of their funds, Chip is invested in one, and MFO’s tiny “endowment” is, too.
We wrote about CrossingBridge Nordic High Income Bond Fund (NRDCX) at its launch, and it has done well since. They seek high income and capital preservation while investing in bonds issued, originated, or underwritten in the Nordic countries. Part of the corporate DNA is a willingness to pursue small issues and event-driven ones that larger managers could not exploit. They see the Nordic markets as embodying a sort of gold standard for corporate governance and transparency, report that Nordic bonds represent better values than US high yield, and believe that the Nordic region has a distinctive market niche.
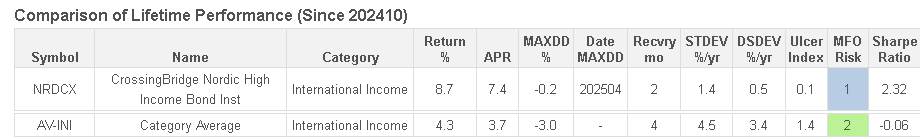
For high-yield investors looking beyond the US, this is the quintessential “get this on your due diligence list” fund.
Alternative funds
Miller Market Neutral Income
Miller Market Neutral Income Fund (MMNIX) is a relative‑value, market‑neutral strategy that seeks positive total return with low correlation by emphasizing convertible and synthetic convertible structures, using long/short and hedging techniques to dampen broad equity and rate risk. To be clear, this isn’t the famous “Miller” and the CIO’s leadership of “Wellesley Asset Management” isn’t the Vanguard Wellesley. This Miller and this Wellesley are convertible bond specialists primarily serving an institutional clientele and managing about $2 billion in assets. At 9.8% APR, about 1.9 percentage points above its market‑neutral peers, and with a 3.80 Sharpe ratio, it fits our “alternatives with real risk‑adjusted payoff” preference, but (1) the 1.69% expense ratio is way high, and (2) it appears that it’s only available to institutional investors. I mention it here for the benefit of our professional readers who might have avenues to access a specialist shop’s flagship.
SGI Enhanced Core ETF
SGI Enhanced Core ETF (USDX) is an “absolute‑return‑ish” bond and options hybrid that holds a diversified portfolio of high‑quality, short‑term money‑market instruments while running an actively traded put‑and‑call overlay on broad equity indices such as the S&P 500 to generate incremental income. Morningstar, by the way, likes no part of it. Or, more narrowly, Morningstar’s machine-learning analyst likes no part of it.
That having been said, it’s posted pretty much top 1% returns since its launch about two years ago.

The combination of very short‑duration fixed income and options‑driven yield is a sort of complexity trade: potentially smoother performance than long‑duration bonds, but with structural and behavioral risks that require some sophistication and tolerance for an expense ratio of 1.05% for a bond ETF. The advisor, Summit Global of Bountiful, Utah, manages about $760 million and advises five funds.
Bridgeway Global Opportunities
Where to start, where to start? Hmmm … I really like the leadership of Bridgeway Capital, and once invited founder John Montgomery to speak to the students at the Institute for Leadership and Service at Augustana. That reflected two things: first, Bridgeway’s unswerving commitment to follow the evidence rather than the crowd, and their deep commitment to serving their community and their investors. John was obsessively cheap long before Vanguard and ETFs made it the vogue. Mr. Montgomery’s analysis of “the small company effect” led him to the conclusion that only the smallest of small companies – those in the so-called tenth decile – actually manifested it, and so their very first fund, Bridgeway Ultra-Small Company, which targeted companies so small that it had to have a hard close at just over $25 million. That having been said, the firm has seen relentless outflows and inconsistent performance over the past decade.
So, here’s the story: Bridgeway Global Opportunities Fund (BRGOX) is trying to offer long-short “hedge fund” capabilities at mutual fund prices. It is an equity market‑neutral strategy that aims for long‑term positive absolute returns by running a roughly dollar‑neutral long/short portfolio in U.S. and foreign stocks. (Market-neutral and dollar-neutral translates to: our returns are independent of the stock market and currency fluctuations.) The key differentiator is Bridgeway’s work on “intangible capital” such as research & development spending. Accounting rules treat R&D as outflows, like the cost of buying coffee for the breakroom, not as investments. As a result, traditional metrics undervalue them. Here’s Bridgeway’s official description of what they do:
Global Opportunities seeks consistent risk–adjusted absolute returns agnostic to market direction, with reduced volatility and granular diversification. Our systematic stock selection approach targets inefficiencies and opportunities in global markets. Innovations in accounting theory and financial analysis are employed to evaluate company fundamentals contextually, opening the opportunity to capitalize on slower price discovery in overlooked market segments. Limited discretion is applied when research assumptions do not hold. Our portfolio construction process is designed to emphasize idiosyncratic over systematic exposures.
Bridgeway has published three peer-reviewed articles on the investment relevance of intangible capital, and the fund has done well so far.
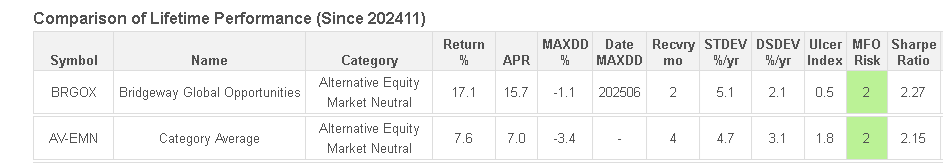
Bridgeway’s well‑documented commitment to donating a large share of profits to charity, its quantitative research ethos, and its history of sometimes brilliant but inconsistent funds make BRGOX feel like a high‑conviction expression of a very distinctive culture—one that investors may admire for its mission and process even if they should be cautious about extrapolating early‑stage performance.
Final note, the fund charges a lot, 1.63% on assets of $34 million, if you think of it as a mutual fund, and not much at all if you think of it as a hedge fund. Your call!
Bottom Line
The flood of crypto derivatives and leveraged trading toys will wash out as it always does, leaving behind a small cohort of genuinely interesting opportunities. The lowest-risk rookies are precisely what MFO has always hunted for: experienced managers with solid, verifiable track records who are now available in new forms, whether that’s Capital Group’s franchise strategies wrapped in lower-cost ETFs, GMO’s institutional disciplines accessible to retail investors, or T. Rowe Price’s closed-to-new-money process extended into a complementary vehicle. These aren’t experiments or marketing plays. They’re proven managers bringing tested disciplines to investors who couldn’t previously access them. The question isn’t whether these strategies work, many have decades of demonstrating they do, but whether the new wrapper fits your portfolio. For serious investors willing to look past the noise, that’s a far more promising starting point than whatever Tesla-leveraged monstrosity launches next month.