Monthly Archives: May 2025

May 1, 2025

By David Snowball

Dear friends,

Welcome to May, traditionally, the month in which to sell in!

These first few weeks of May are an odd time on campus. My seniors are scrambling for jobs (or antidepressants), the juniors are teeing up internships, and the youngsters are … well, mostly wondering what just happened to them?

It’s a time of year that brings out the best, and the worst, and the oddest of them. On May 7, hundreds of our students gather to present their work to a campus and community audience. Not classwork, just work. Stuff they’re passionate about. One of my students, Adele, presents “Minimalism, Meaning, and Machines: Einstein on the Beach and the Art of Processing Technological Innovation,” which looks at the Philip Glass opera (you did know it was a famous opera, right?) using, in part, the issues we discussed in Communication and Emerging Technologies about technological determinism and the fear of new technology. A bunch of presentations will build off the work students did last summer with the University of Texas M.D. Anderson Cancer Center and Baylor College of Medicine, “Commonly Used Measures of Cancer Impact: What are we measuring?” as an example. Quilting in Appalachia, The Gods in Racine (no, not Racine, Wisconsin, Racine the French playwright who is also the focus of Sado-Masochism in the Works of Racine, which is okay because it’s the French department and the French are … very French sometimes). We cancel all our classes for the day to engage in The Celebration of Learning.

And at the same time, I got a lovely note from Zoe that said, “Hey, Snowball, just a heads up. I’m not coming to class today. I have three weeks left in my time at college, and today is too beautiful to spend inside.” Glanced at the record to confirm what I already knew (she could skip the rest of the semester without noticeably reducing her chance for an “A”) and nodded.

Professors once gave lip service to the argument that “learning takes place everywhere, not just in the classroom.” I’ve always been delighted that Augustana often acts like they really believe it.

In this issue of the Observer …

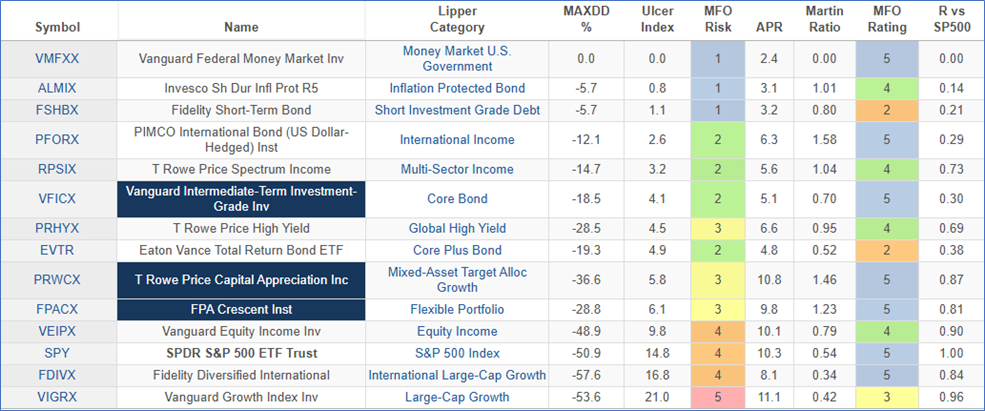
Lynn Bolin has adopted a pretty cautious “risk off” stance amid economic uncertainty. Tariffs and their potential impacts emerge as a central concern, with Lynn drawing parallels to 1970s stagflation. Those concerns tie together both of his essays this month.

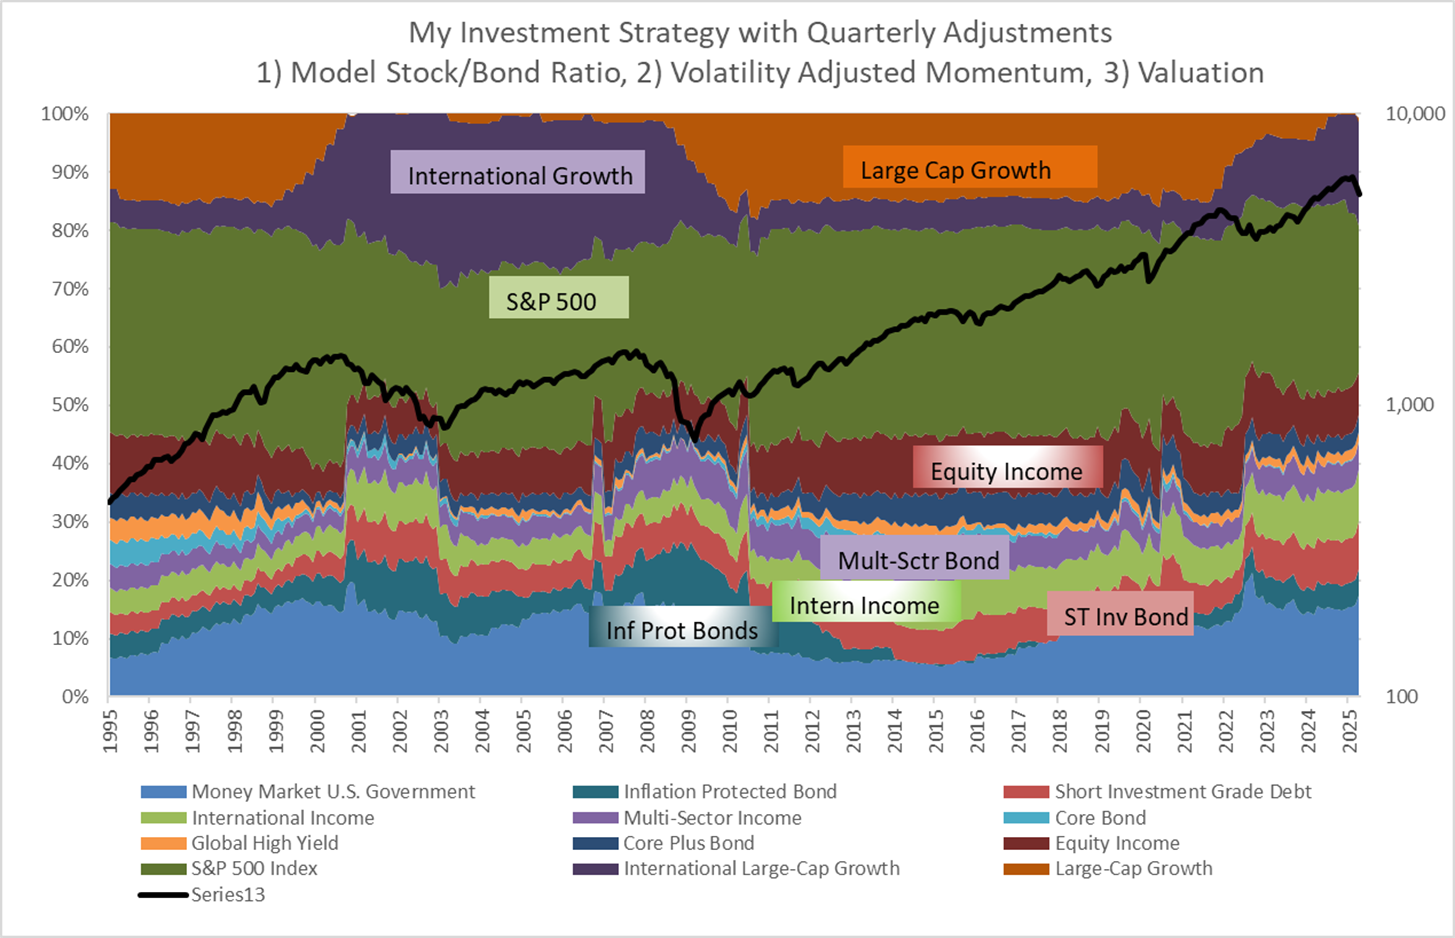
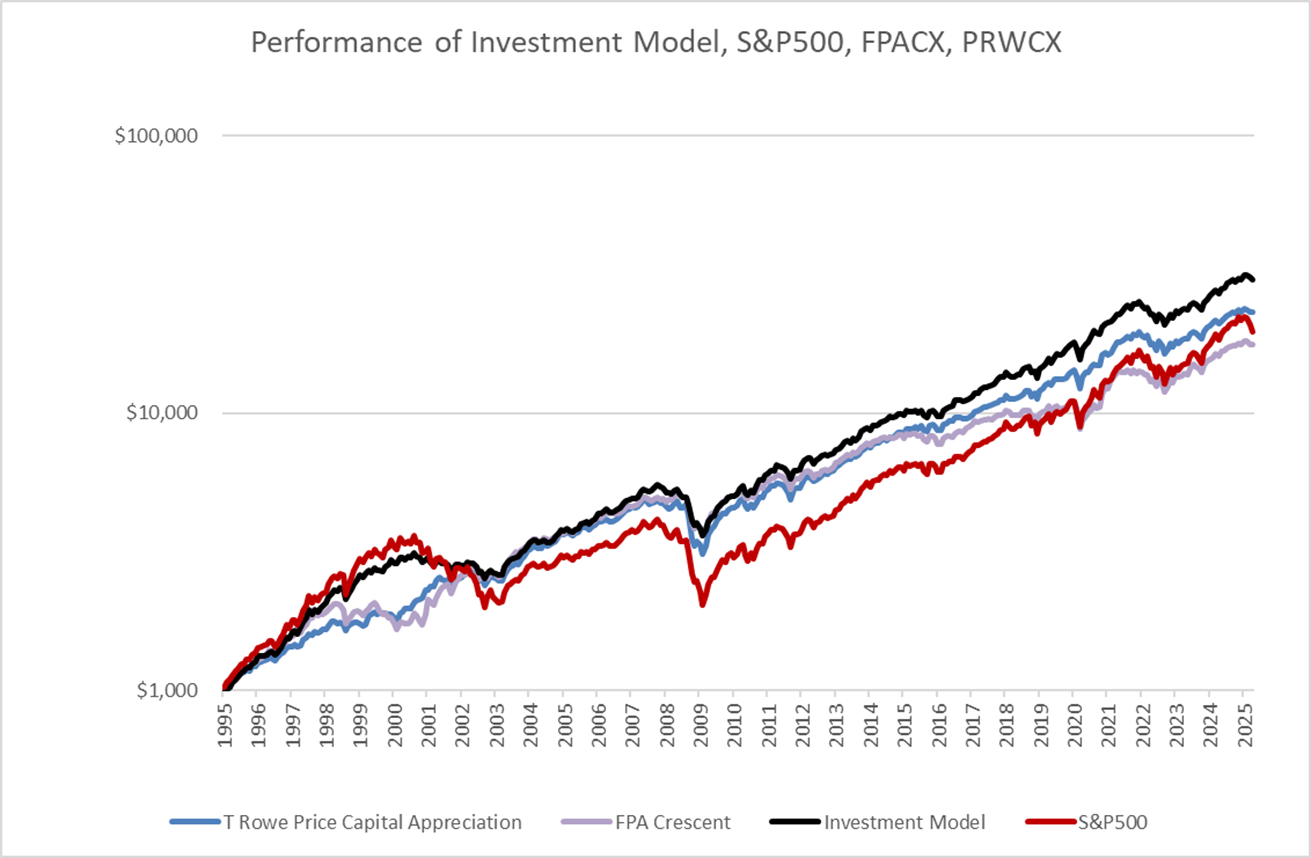
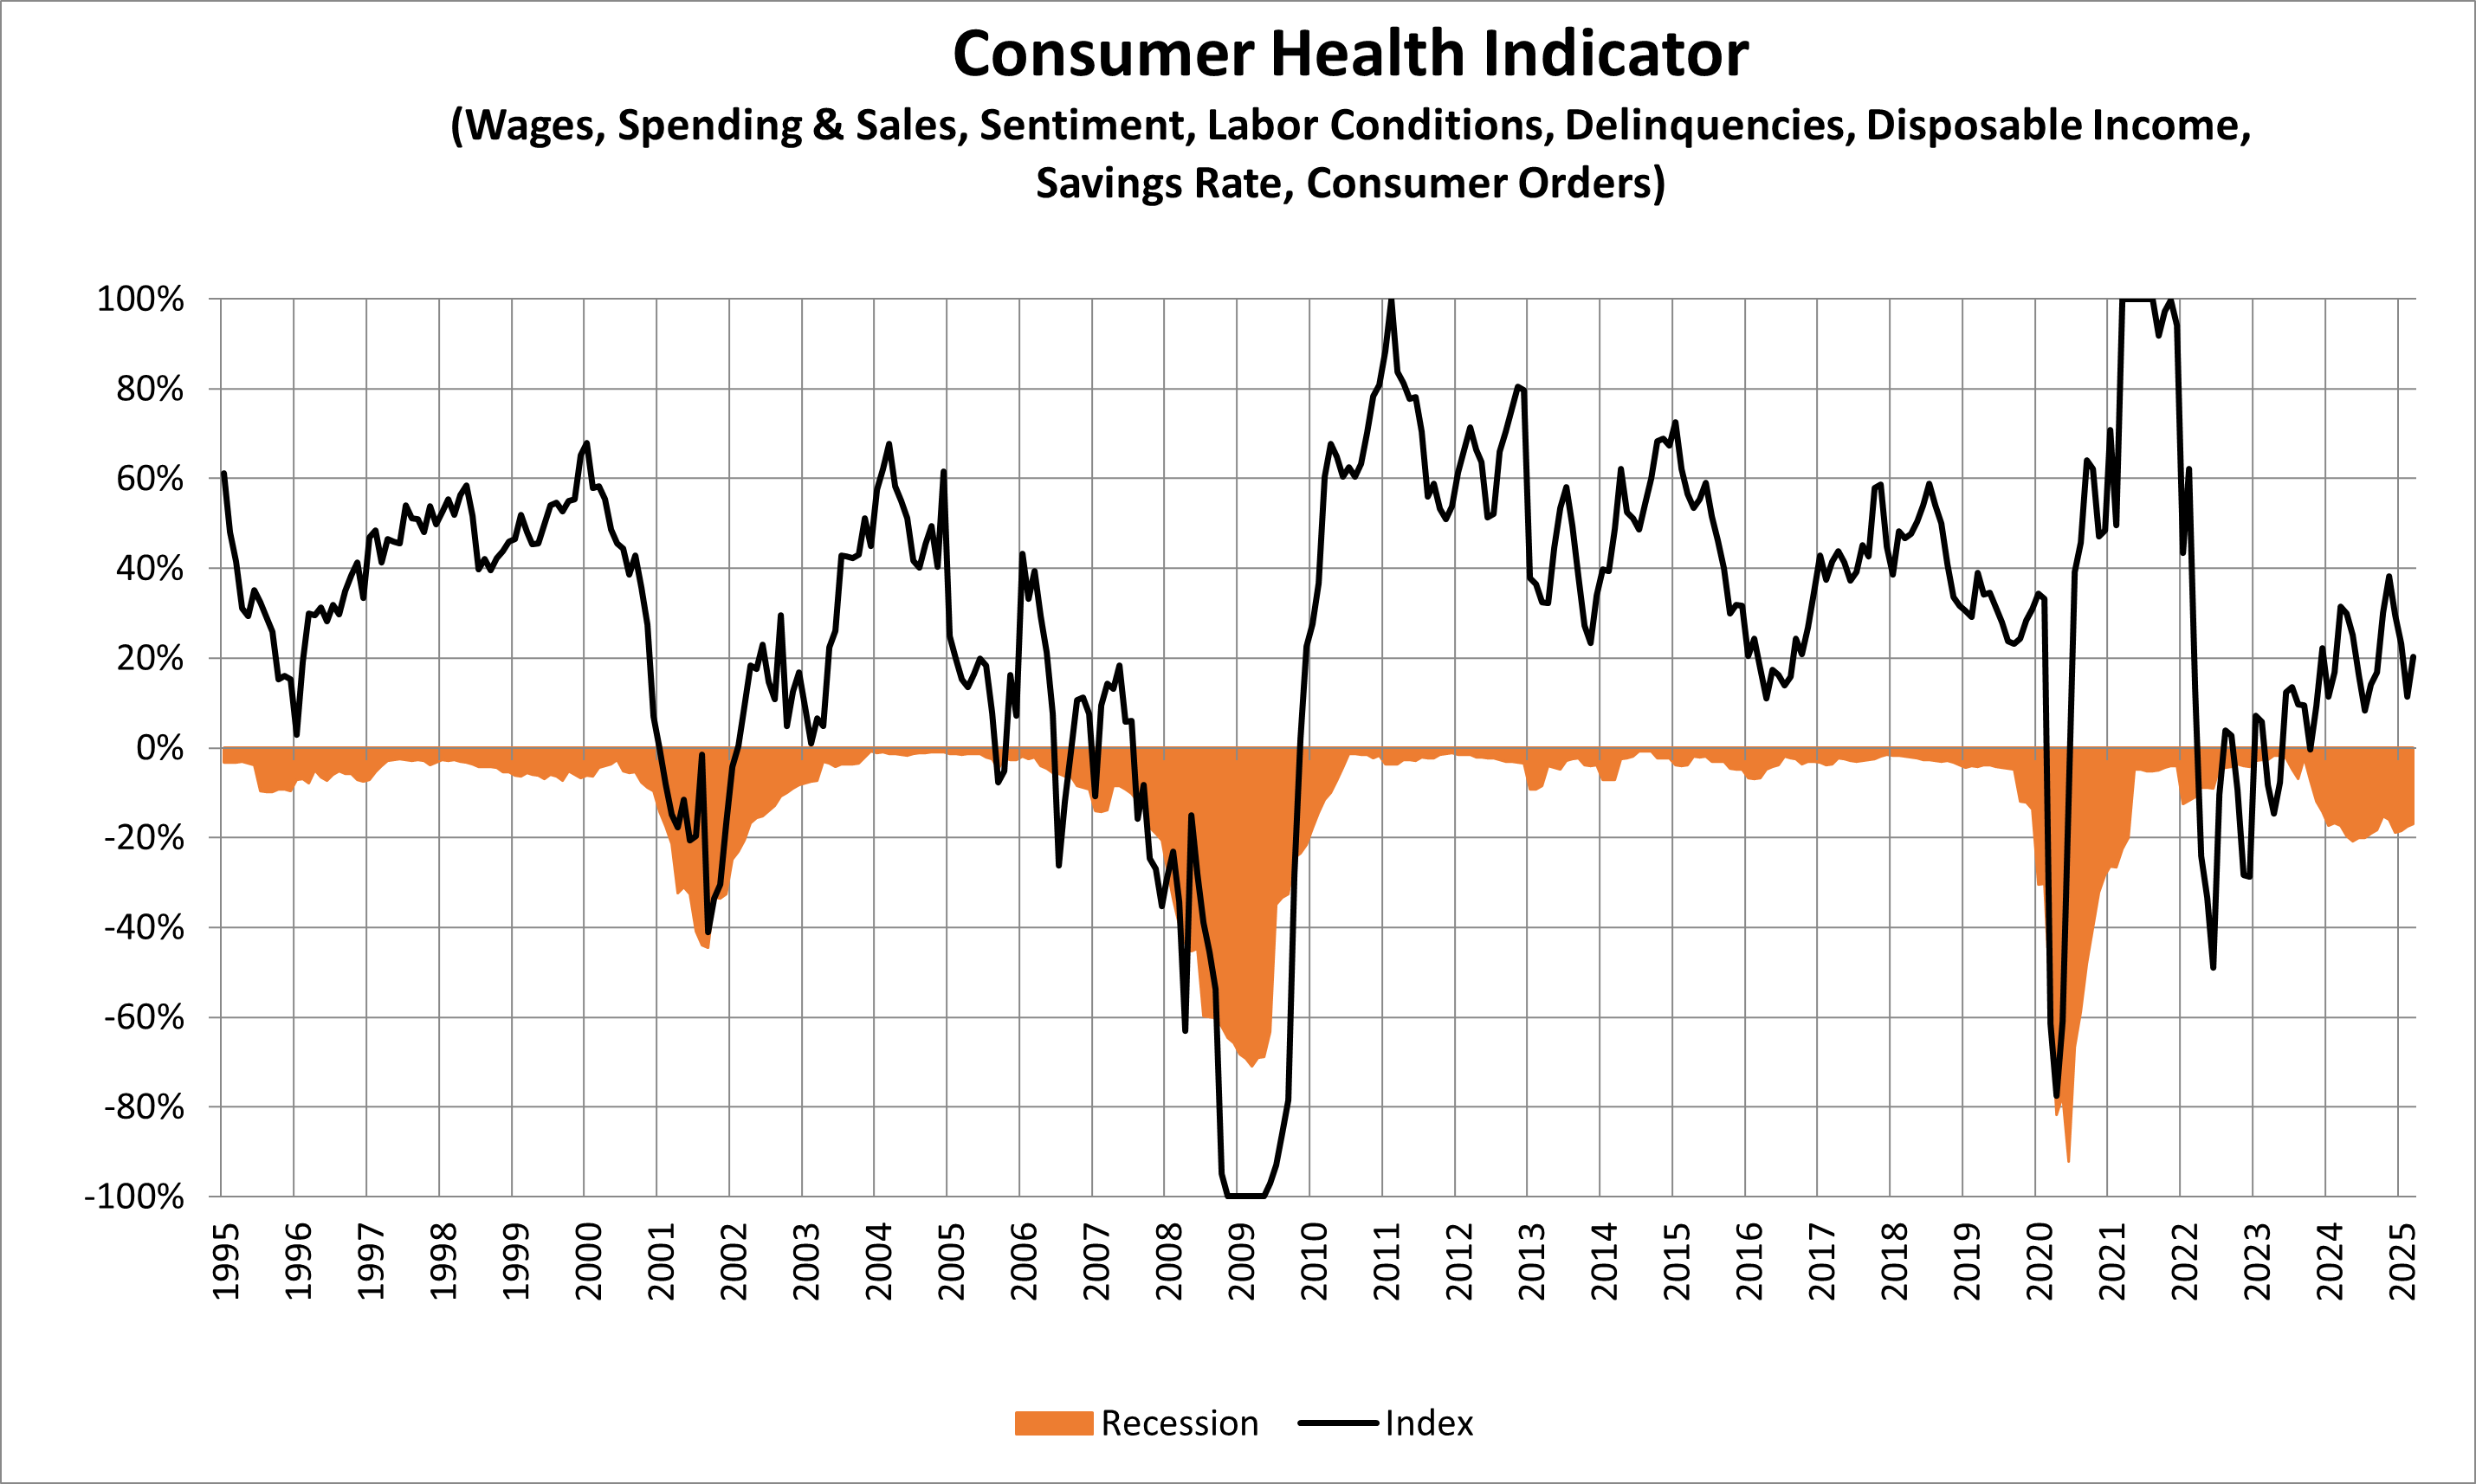
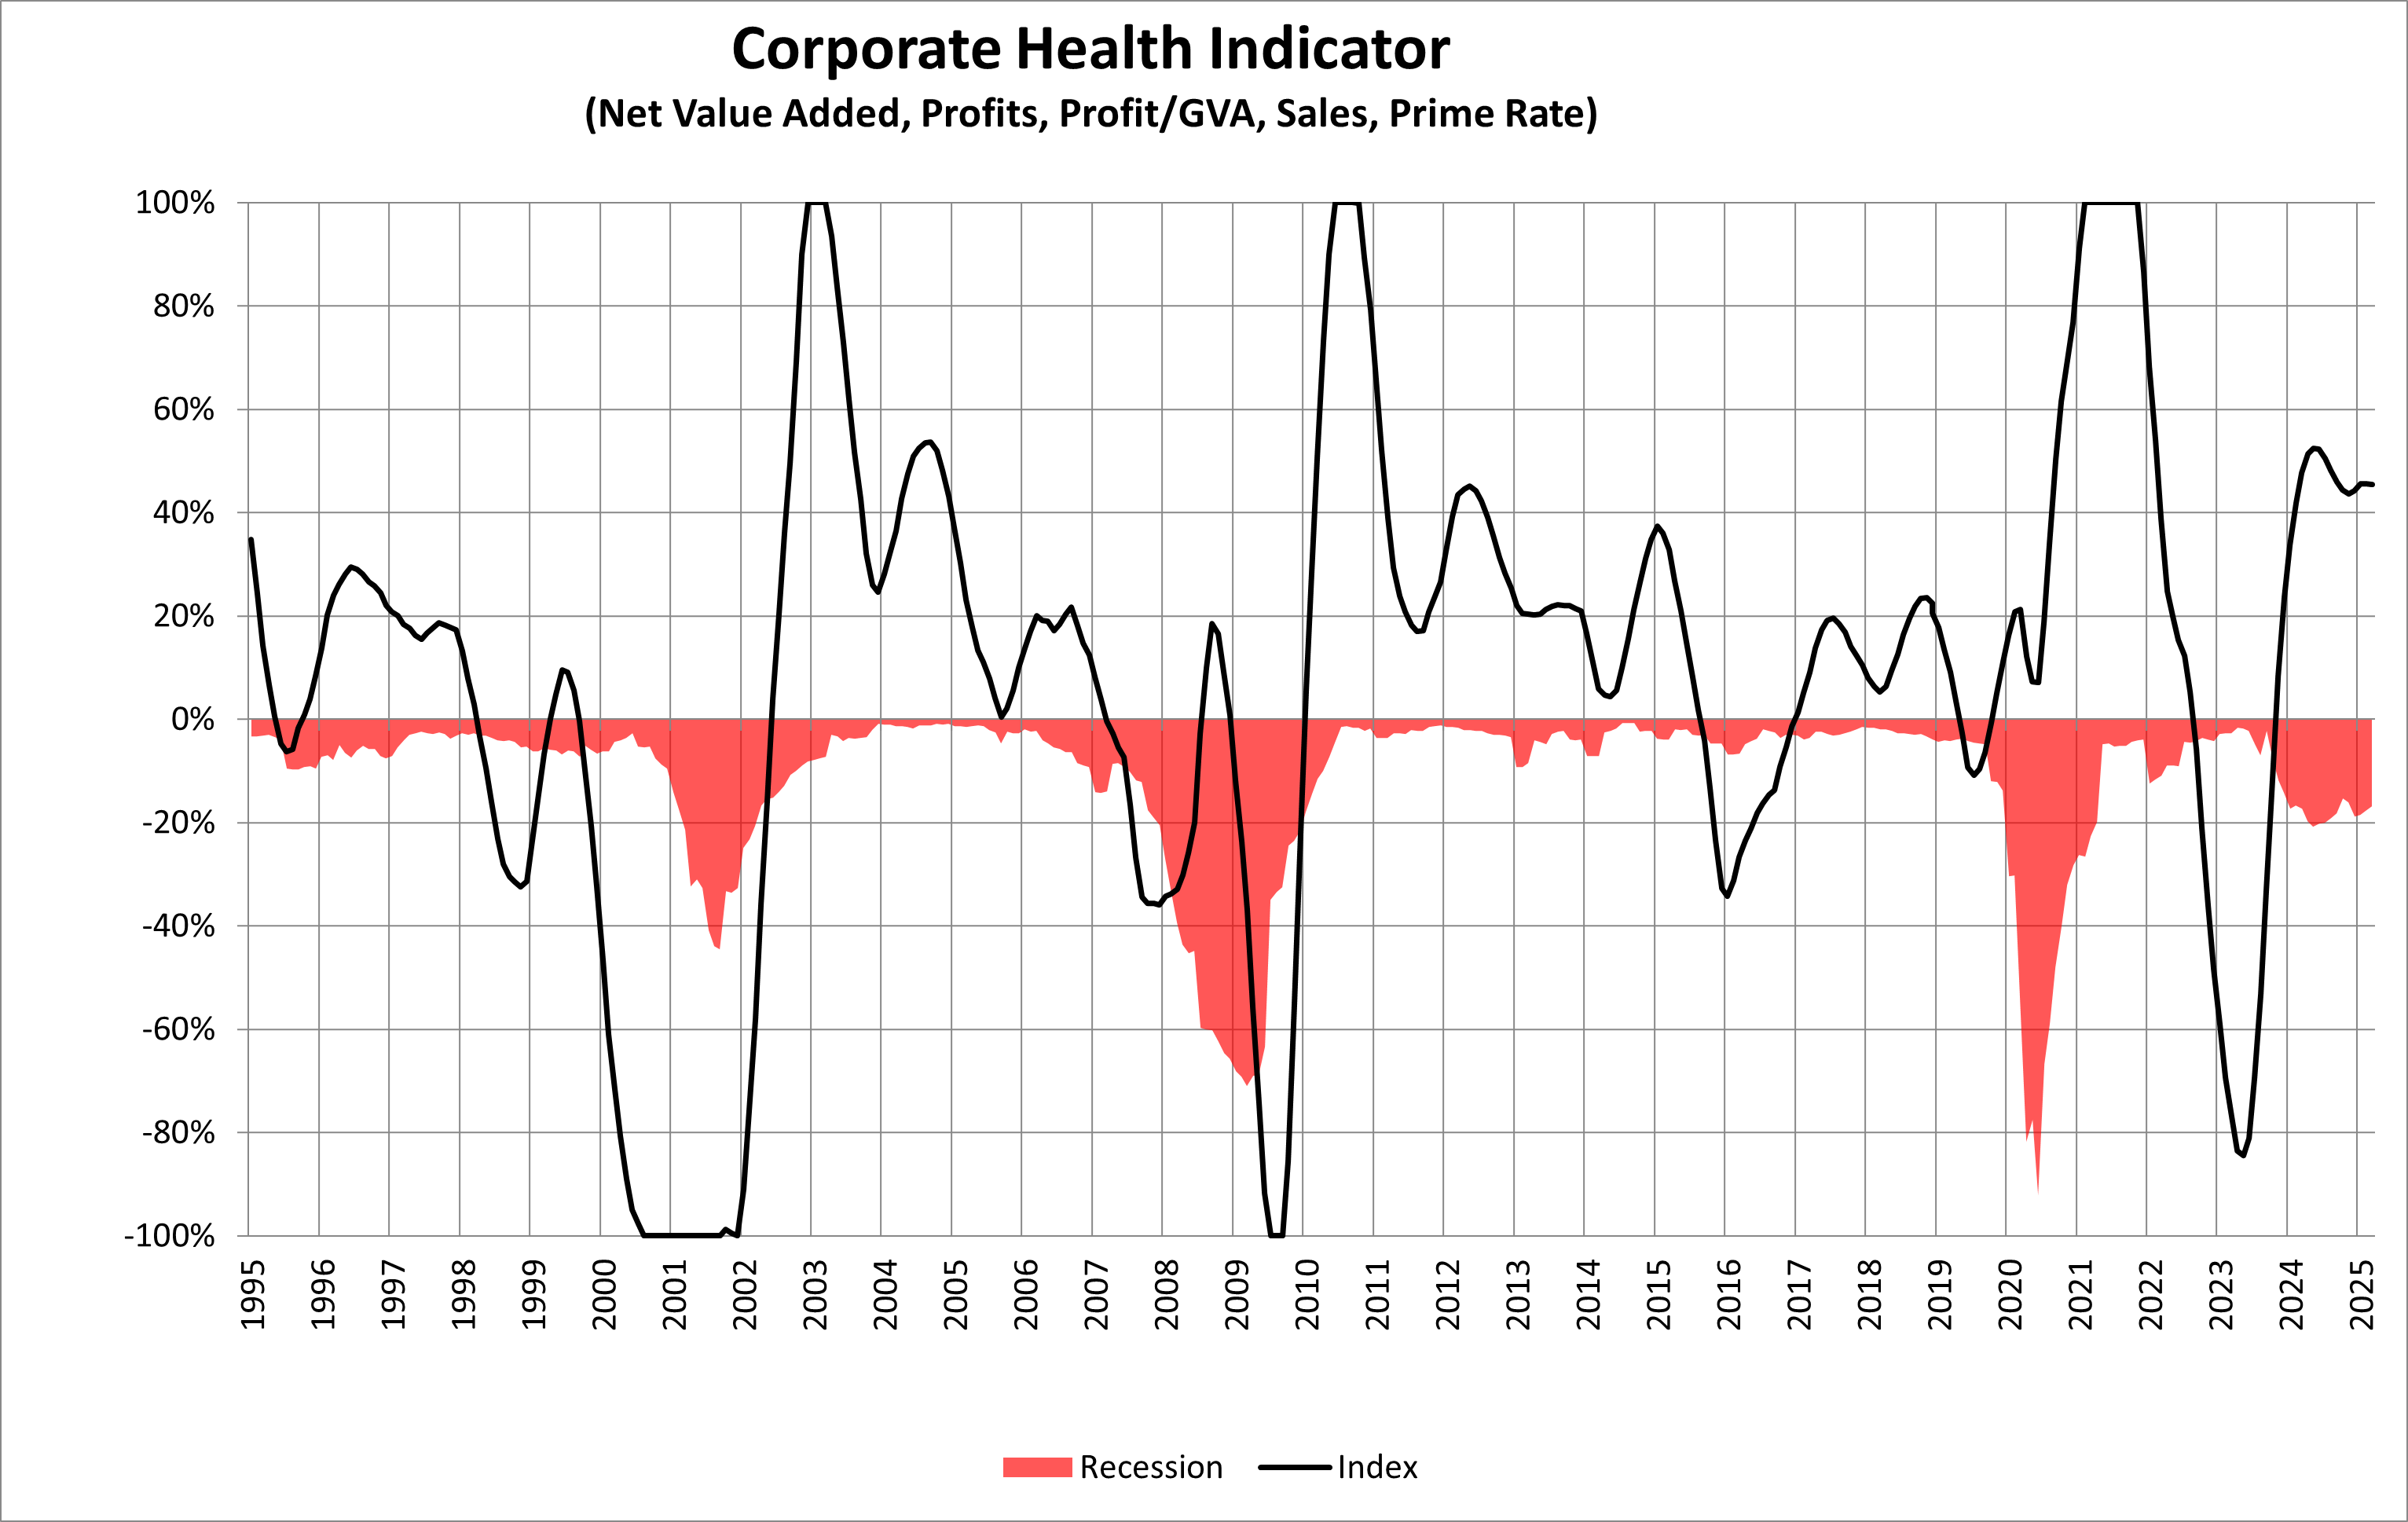
In “My Investment Strategy For 2025,” Lynn outlines his investment approach amid high market volatility and uncertainty. He maintains a traditional 60/40 stock/bond portfolio (ranging from 55-65% in stocks) with small quarterly adjustments based on volatility-adjusted momentum. His investment model, which incorporates 30 years of fund data, recommends a “risk off” stance since mid-2022. Despite the S&P 500’s recent gains, he identifies concerning trends in consumer health, corporate performance, and equity valuations. With parallels to 1970s stagflation, he’s increasing allocations to short-term investment-grade and inflation-protected bond funds while maintaining stability for withdrawals.

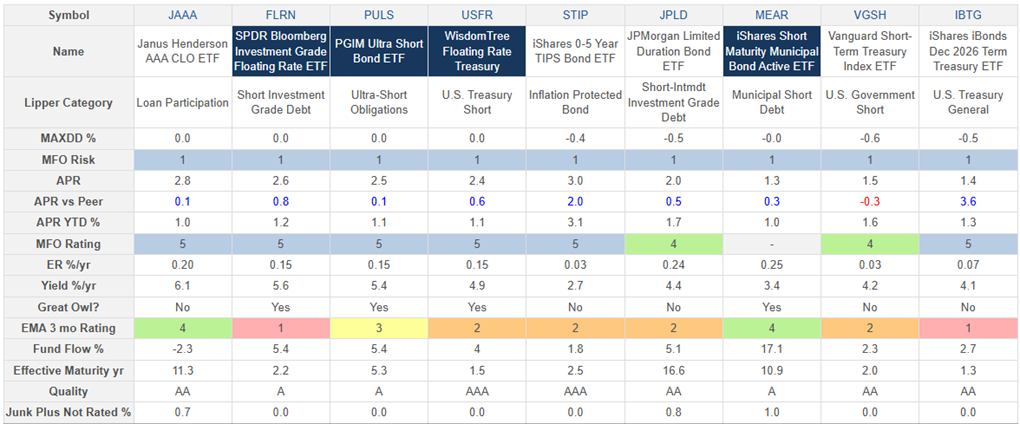
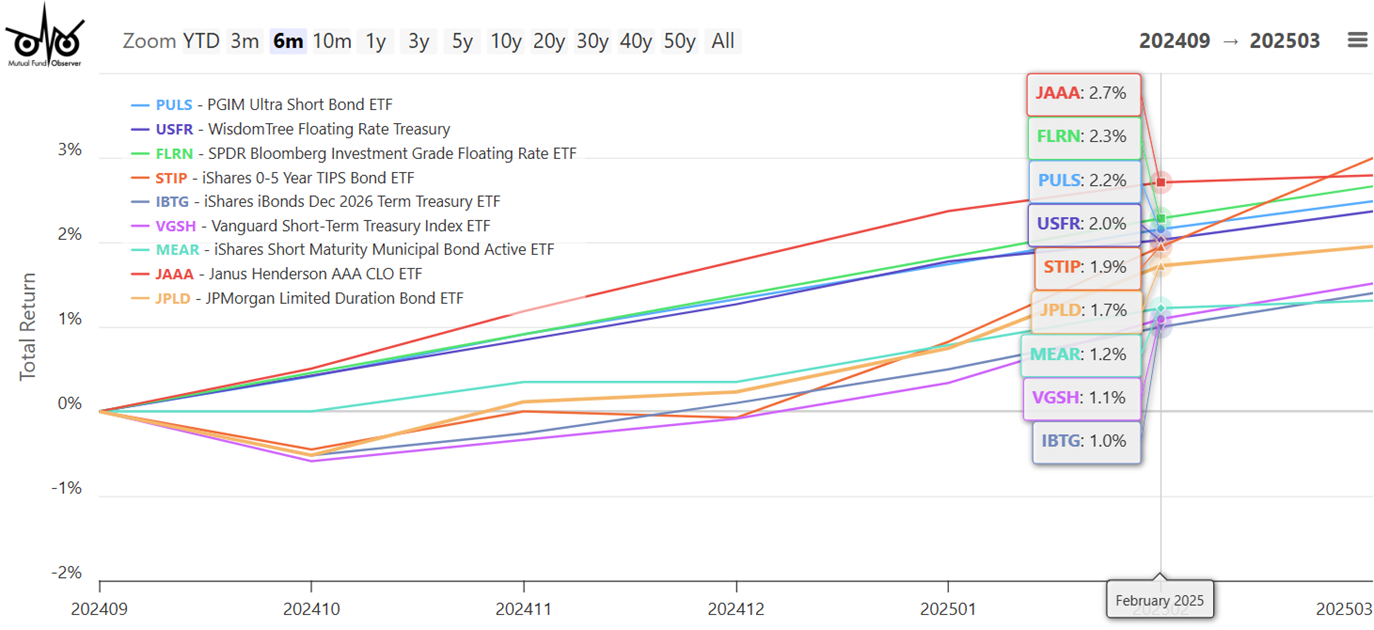
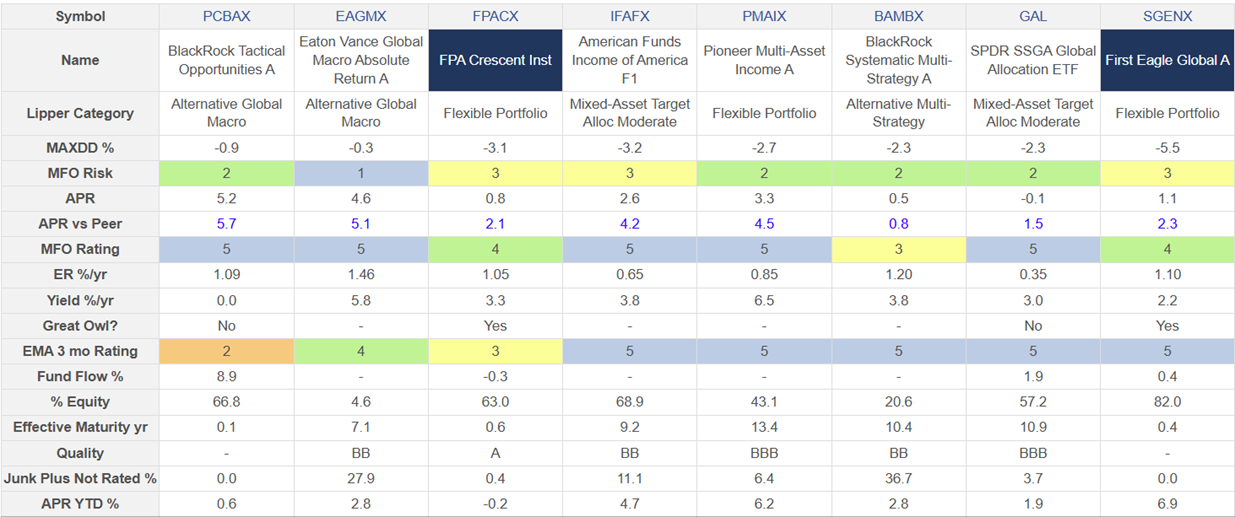
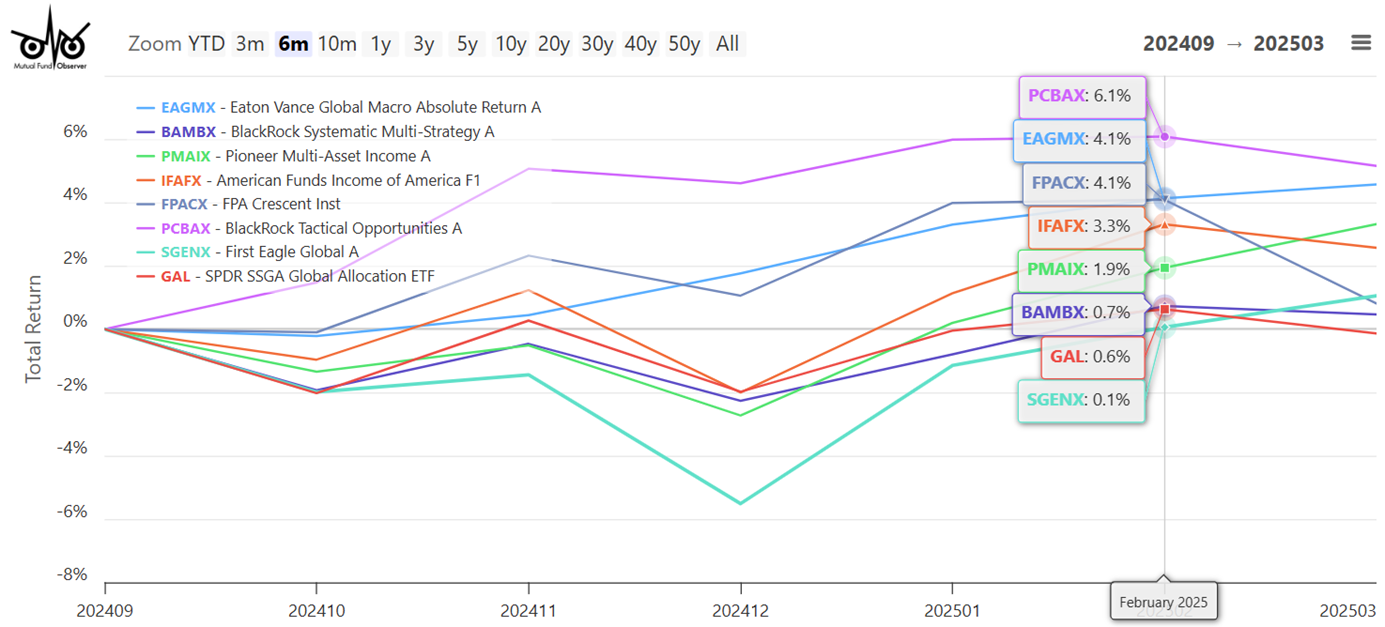
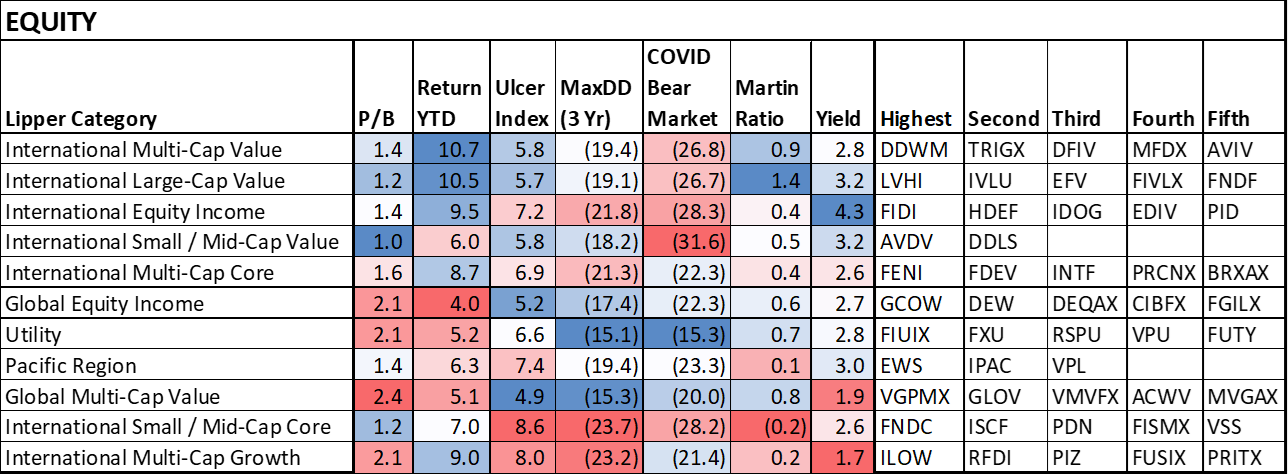
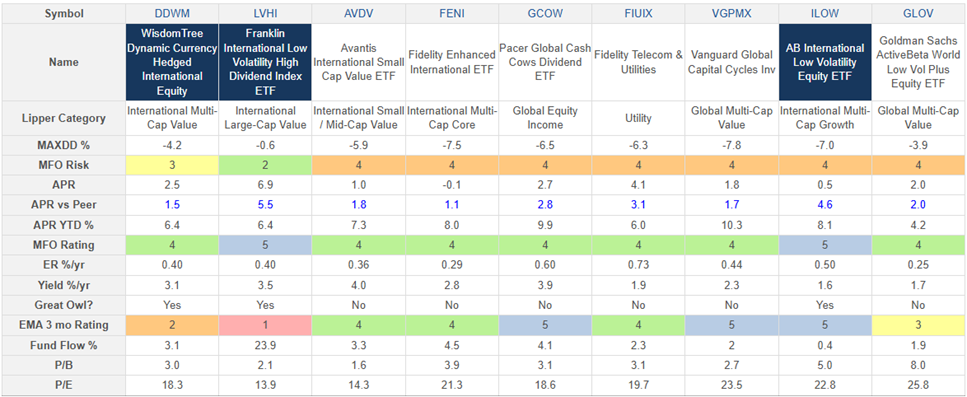
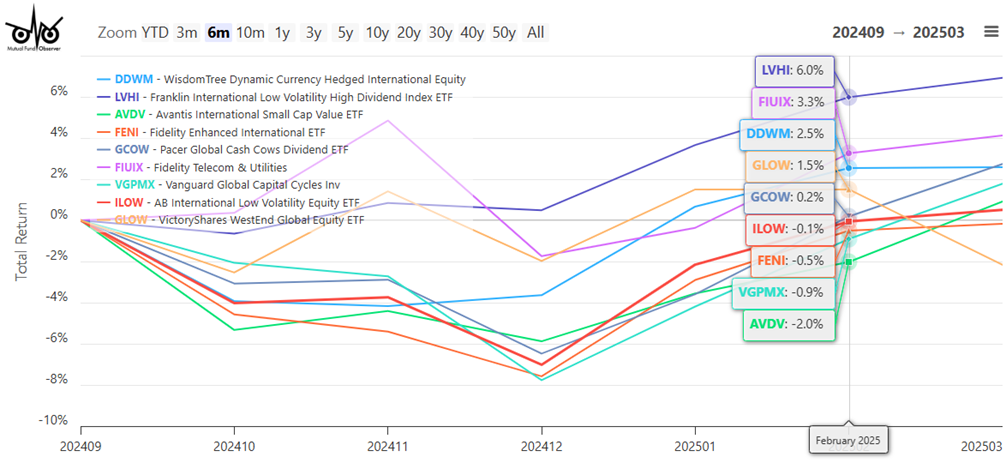
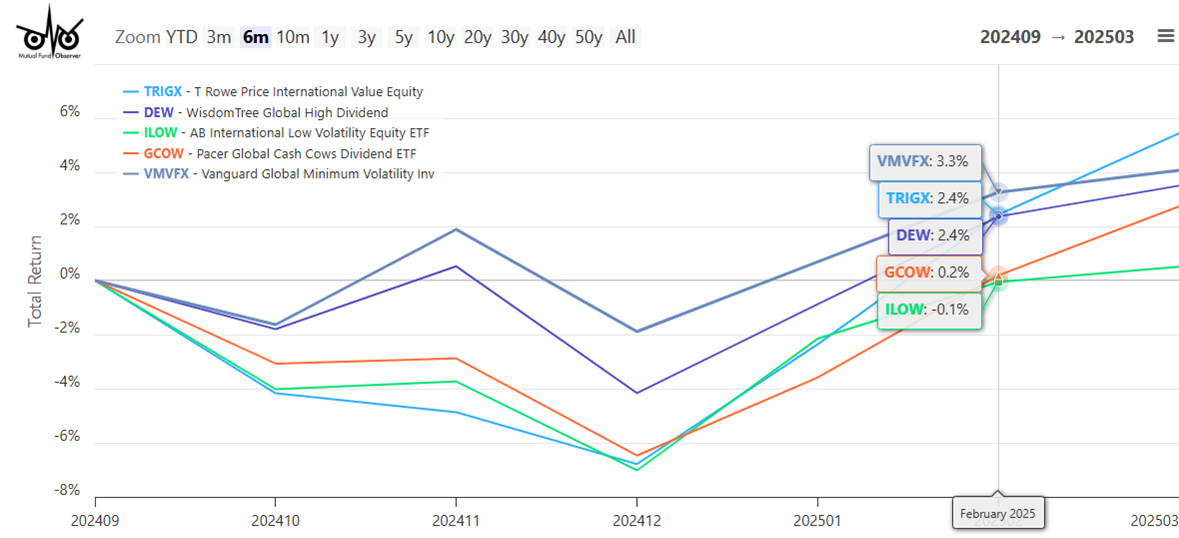
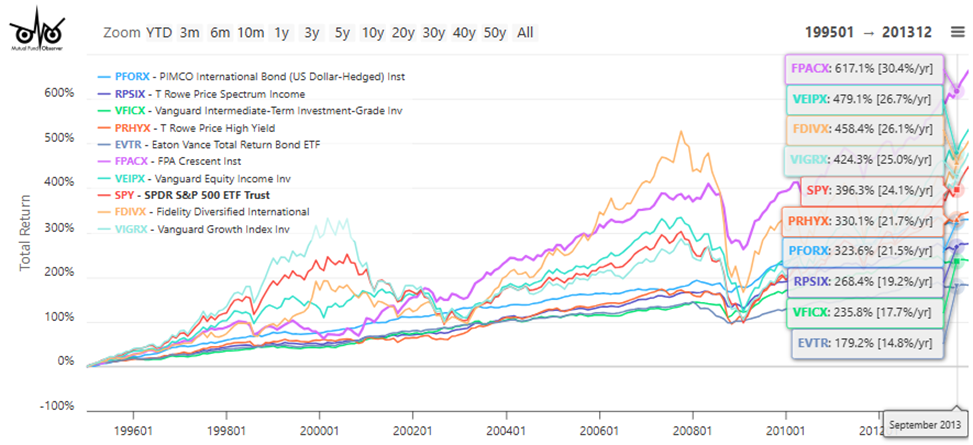
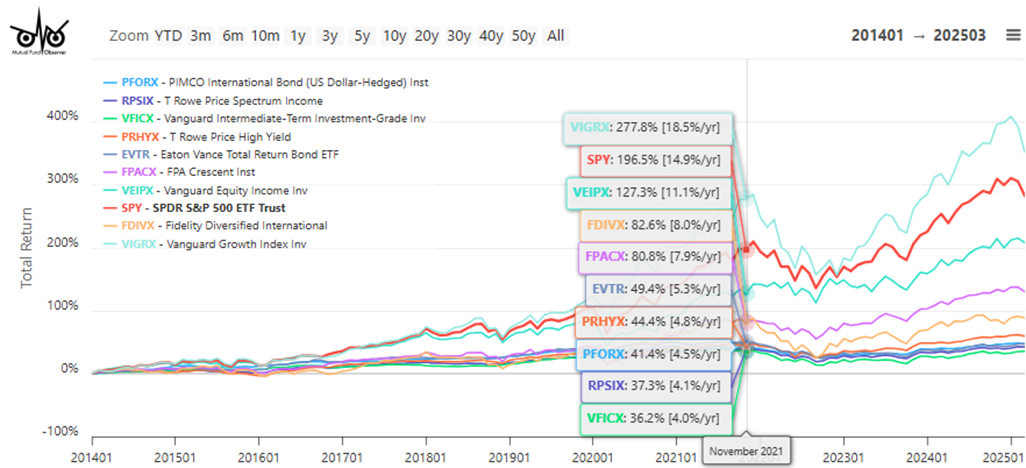
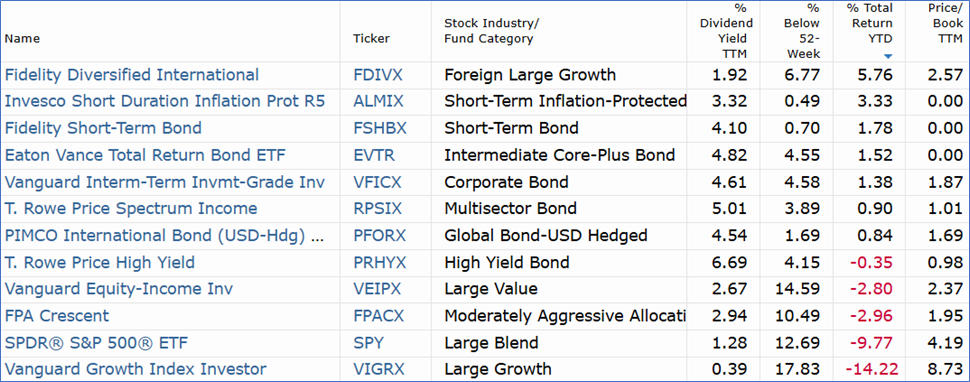
In a market subject to rather sudden reverses, Lynn also addresses “Trending Funds YTD 2025.” He reviews top-performing funds across bonds, mixed assets, and equities using his proprietary ranking system based on MFO Premium data. Bond rankings show strength in short-term investments and inflation-protected securities, and he’s considering replacing high-yield funds showing negative YTD returns. In mixed assets, alternative global macro funds like Eaton Vance Global Macro Absolute Returns stand out as potential “Risk Off” diversifiers. Equity rankings demonstrate international and global funds significantly outperforming domestic options. As tariff impacts become clearer by June, Lynn is focusing on reliable fixed income for the next 5-10 years while considering tax-efficient international equity funds.

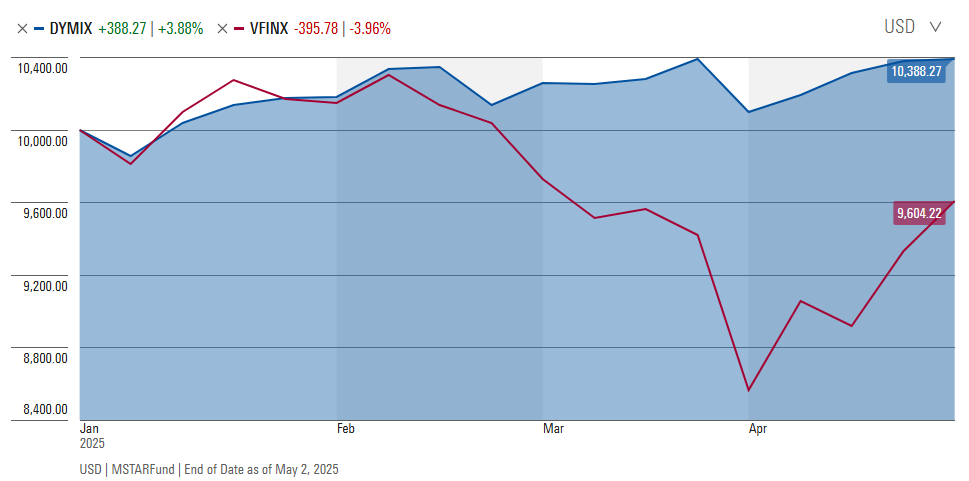
I share Lynn’s anxiety about the consequences of policy chaos on the markets, and so profiled Dynamic Alpha Macro Fund, a younger entrant in the global macro category. The fund matches a 50% equity stake with a 50% macro-driven futures trading strategy. The results have, so far, been exemplary: returns since inception that beat the S&P 500 with a negligible correlation to it. The picture of the trio – Eaton Vance (red), Dynamic Alpha (blue), and the S&P 500 (roller coaster) since Dynamic Alpha’s launch – looks like this.

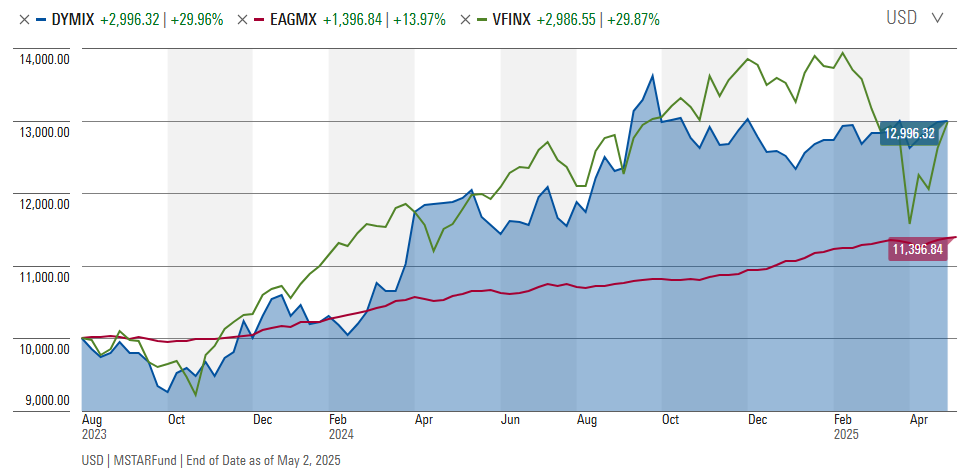
There’s one clear beta story. One clear alpha story. And two funds worth considering if you’re not convinced that it’s all going to be fine and dandy any day now.

Dynamic Alpha is part of a larger discussion that we’ve been pursuing, Building a Chaos-Resistant Portfolio. We debuted the term in December 2024 and have pursued articles, almost monthly, on the challenge of managing through crazy times. This month, we update on how the funds and strategies we’ve discussed have served their investors. (Spoiler alert: pretty well, all things considered.) As a sort of public service, we also offer a sneak peek at Lewis Braham’s Barron’s essay, “The Chaos-Resistant Fund Portfolio.”

We also share a Launch Alert for T. Rowe Price’s newest offering in its Capital Appreciation suite for funds and ETFS: T. Rowe Price Capital Appreciation Premium Income ETF. It offers income, some growth, and exceptional stability.

Our colleague Charles Boccadoro updates folks on new fund flow analysis, which will now offer daily updates through the FLOW tool. (At $120/year, his site really is the most radically underpriced – albeit quirky – fund and ETF data site in existence. Unlike Morningstar’s online tools, Charles has offered side-by-side, metric-by-metric analyses of funds, ETFs, and closed-end funds since Day One. The data and analytics are incredibly rich.)

And The Shadow wraps things up in Briefly Noted, noting briefly, as is his wont, a huge series of fund-to-ETF conversions which seem to be eclipsing the impulse to liquidate funds.

Things that make me pause

“Necessities” don’t mean quite the same thing to all of us. Credit Karma surveyed 2,000 American adults in April 2025, seeking to learn how they might respond to a world with higher expenses and more constrained income. Across the board, 80-90% of all age groups allowed that they would “strongly consider” cutting back on nonessential spending.

The difference, by generation, is what’s “essential.”

Fifty-six percent of Gen Z and 59 percent of Millennials said spending on hobbies and interests is a necessity, not a luxury. And nearly half of young consumers (51 percent of Millennials and 45 percent of Gen Z) said they would rather reduce long-term savings than give up certain lifestyle experiences including going out to eat, travel and fitness memberships. (Alexandre Pastore, “Gen Z and Millennials Are Redefining What Items Are ‘Necessities’ Amidst Economic Uncertainty,” 5/5/2025)

A Lending Tree survey reported in Fortune notes that one-quarter of Americans are now buying their groceries on credit (paid access, sorry, 4/28/2025). One budget move has been to end psychological therapy appointments; the most popular use for AI chatbots in 2025 is now “therapy and companionship.”

The 19 richest American households got richer, $1,000,000,000 richer in 2024. One trillion dollars richer during Mr. Biden’s last year in office, which might raise questions about why so many of them were so upset with him. The 19 households include some familiar names, such as Elon Musk, Mark Zuckerberg, Jeff Bezos, Stephen Schwarzman, and Warren Buffett. The Wall Street Journal framed it this way:

The wealthiest have gotten richer, and control a record share of America’s wealth. New data suggest $1 trillion of wealth was created for the 19 richest American households alone in 2024. That is more than the value of Switzerland’s entire economy. (“$1 Trillion of Wealth Was Created for the 19 Richest U.S. Households Last Year,” WSJ, 4/23/2025)

Rich investors offering forecasts need to be approached cautiously. Their statements reflect professional expertise, personal bias, and the inevitable urge to “talk their book.” That said, rather a number of top-tier investors have shared storm warnings. Paul Tudor Jones said that even if Trump walks back his tariffs, markets are headed “to new lows.” (“A billionaire hedge fund manager has a chilling stock market warning,” Quartz, 5/6/2025). Ray Dalio argues that we face “something worse than a recession” (Shannon Carroll, “Ray Dalio is worried about ‘something worse than a recession’,” Quartz, 4/14/2025)

Deutsche Bank argues that the fragility of the US markets is heightened by “the end of American exceptionalism.” Traditionally, the US has offered the world’s safest investments – the US dollars, Treasuries – because America had an unprecedented reputation for accepting its role as the grown-up in the room. As we look more like post-war Italy, global investors find it easier to imagine a flight, perhaps precipitous, from US investments (“3 market signals that could be setting the stage for another correction,” Business Insider, 4/29/2025, also Pictet Asset Management, “The twin sell-off that signals a break with the past,” 4/2025). Institutional voices such as Moody’s Analytics, JP Morgan, and Apollo Capital place the prospect of a US recession in the year ahead at 50-90%. The special problem is the macro-economy environment: Callie Cox, the chief market strategist at Ritholtz Wealth Management, worries that low growth and rising prices would hamstring the Fed, which investors have counted on for a generation to save their cookies from the fire. (Callie Cox, “America is on the verge of stagflation,” Business Insider, 4/28/2025).

Bloomberg, not a reactionary bunch, published findings from Bespoke Capital that substantiate a “sell in May” strategy. “Investing in a fund that debuted in 1993 and tracks the S&P 500 during the May-October period yielded a cumulative return of 171%, compared to a 731% gain for November-April,” concluding “ the risks are skewed toward the S&P 500 suffering another big decline next month” (Bloomberg Markets Daily, 4/30/2025).

I always take the folks at the Leuthold Group seriously; they’re data-driven, and their data sometimes signals the prudence of caution even while the party rolls. Their early May research releases: the market’s latest bounce is consistent with bear market rallies, valuations have now returned to epic levels, and cracks seem to be deepening.

I am intensely aware of the success of economists in accurately predicting eight of the past three recessions. And still, increasingly, I hear the voice of Sgt. Esterhaus from Hill Street Blues, who finished his roll call every week with the same prescient advice: “Let’s be careful out there.”

Farewell to The Great Men

I know, I know, it’s all over the news and there’s precious little to add.

Pop is gone.

Gregg Charles Popovich has stepped down after 29 years as the head coach of the San Antonio Spurs, which made him the longest-tenured coach in all of professional sports. In that stretch, he won five league championships, over 1400 wins, and had 22 consecutive winning seasons. He is, by all accounts, a remarkable person and a champion for the people in San Antonio. His decision to step aside as a mere stripling of 76 was occasioned by a mild stroke in November 2024 and fainting in a restaurant in April 2025. He will be missed.

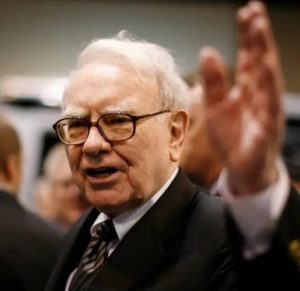
The other retirement news of the month, in case you’d missed it while following the NBA, is Warren Buffett’s retirement announcement, apparently not shared in advance with his own successor. The announcement came during Berkshire Hathaway’s annual meeting on May 3, 2025.

Berkshire’s stock promptly fell 4%, only slightly ironic given Mr. Buffett’s lifelong devotion to investing for the long-term (really, did anyone think Mr. B. would actually carry out his threat to continue running Berkshire from beyond the grave?) and his emphasis on fundamentals rather than personalities.

Berkshire’s original investors, who had held since the start, would pocket a gain of 5,500,000%, about 140 times the gain in the S&P 500. (Not 140% of the gain, 14,000% of the S&P’s rise). Even the latecomers who joined in 1980 would have seen a 296,000% gain. Millennial investors, those staggering in as the Dot.com became the Dot.bust pocketed a 1500% rise, just short of triple the S&P 500’s gain in the same period.

If I had to share advice on how to think about Berkshire’s future based on Mr. Buffett’s career, I might invent the following quotation and attribute it to him (because that’s how the internet works):

The greatest companies outlive even their greatest leaders; true wealth isn’t built by timing departures, but by owning excellence through transitions.

Warren Buffett and Isoroku Yamamoto

One of the habits that distinguishes great leaders from those who grind and trash is a tendency to read widely, incessantly, and with an engaging curiosity. That’s true, most famously, of Bill Gates and of Mr. Buffett’s other half, Charlie Munger.

Mr. Buffett released what might be his final book recommendation list at Berkshire’s May meeting. It contained 27 titles, of which a dozen are books by or about Mr. Buffett and his firm. Here’s what else Mr. Buffett thinks you would profit from reading:

Capital Allocation: The Financials of a New England Textile Mill 1955–1985 by Jacob McDonough

The Great Crash: 1929 by John Kenneth Galbraith

Where Are the Customers’ Yachts? by Fred Schwed Jr.

Business Adventures: Twelve Classic Tales from the World of Wall Street by John Brooks

The Intelligent Investor by Benjamin Graham and The Intelligent Investor (Revised Edition) by Jason Zweig

The Little Book of Common Sense Investing: 10th Anniversary Edition by John C. Bogle

The Ten Commandments for Business Failure (“I like to study failures,” WB) by former Coca-Cola CEO Donald R. Keough

Influence: The Psychology of Persuasion and Pre-Suasion: A Revolutionary Way to Influence and Persuade, both by Robert Cialdini. These might be the bestselling books ever on the science of persuasion, with simple and actionable insights.

Unscripted: The Epic Battle for a Media Empire and the Redstone Family Legacy by James Stewart and Rachel Abrams

Americana: A 400-Year History of American Capitalism by Bhu Srinivasan

Getting There: A Book of Mentors by Gillian Zoe Segal, snippets about working with great people, including Mr. Buffett

Running with Purpose: How Brooks Outpaced Goliath Competitors to Lead the Pack by Jim Weber, a leadership tale from the CEO of Brooks Running Company, which Mr. Buffett bought in 2012

Trillion Dollar Triage: How Jay Powell and the Fed Battled a President and a Pandemic—and Prevented Economic Disaster by Nick Timiraos, the most contemporary book on the roster, published in 2022.

My own reading, in leadership and history, has gone in a different direction lately. The Reluctant Admiral: Yamamoto and the Imperial Navy by Hiroyuki Agawa is widely regarded as one of the most nuanced and insightful biographies of Admiral Isoroku Yamamoto. The book draws heavily on original sources, including Yamamoto’s own letters and interviews with those who knew him, to present a portrait of a complex, deeply conflicted leader

Traditionally, Yamamoto has been the face of Japanese aggression in the Pacific War, and yet the picture is a lot more complex. As commander of the combined fleet, Yamamoto coordinated and executed the attack on Pearl Harbor. As reports of success after success flooded in, “the staff officers could not conceal their jubilation; Yamamoto alone, apparently, remained sunk in apparent depression.”

That might be explained by Yamamoto’s single most quoted prediction:

“If I am forced to wage war with the United States regardless of the consequences, I will run wild for six months, but I have no confidence in the years after that,” a statement apparently made to Prime Minister Prince Fumimaro Konoye, late 1940.

Yamamoto knew America and knew the odds and calculated that his only chance was a six-month spree of terror that might so stun the Americans that they would conclude that resistance was not worth the cost. If Americans stood firm after the six-month assault, Japan, he knew, would fall. That became a self-fulfilling prophecy. By June 1941, when his indecision at the Battle of Midway led to catastrophe, it was clear that Yamamoto had no long-term plan. Destroy as much as possible, as fast as possible, and then … and then? No idea. Improvise.

I wonder if Americans, in May of 1941, had any idea of how brittle their apparently indestructible foe was?

If you’re so smart …

“Why aren’t you rich?”

This familiar challenge reveals three curious truths about American culture. First, it presumes wisdom’s natural expression is wealth—that your intellect should be measurable by your investment portfolio. Second, it exposes our impoverished definition of “richness.” While I nurture thoughts, cultivate relationships, touch thousands of lives, and tend my garden, none register as “wealth” without the validation of a brokerage statement.

Most tellingly, we never pose the reverse question: “If you’re so rich, why aren’t you smart?”

This equation of wealth with wisdom is quintessentially American. Cultures worldwide contemplate both riches and sagacity, yet none so persistently conflates them. Americans uniquely generalize from great fortune to great insight, willingly overlooking moral failings or intellectual shortcomings among the ultra-wealthy.

Earlier this month, I published an essay examining this question at LinkedIn. It has been nibbling at my brain for a long time, highlighted by the utterly, entirely predictable March of the Billionaires to kneel before the throne.

Validity notwithstanding, it seems a bit far afield from MFO’s mission, and so we thought it better to link to it here (it should open in a new tab for you) rather than republish it.

I’ll walk through three arguments with you, followed by a brief coda and suggestions from where you might learn more if you’re so disposed. Here are the arguments:

  1. The ultra-rich really are different from the rest of us.
  2. The factors that allow them to become wealthy create an aversion to the messiness of democracy and an allure to authoritarianism.
  3. That never ends well, for them or for us.
  4. Coda: There are honorable exceptions, principled, thoughtful people who acquired (and often dispensed) great wealth without losing their principles.

There’s a bunch of academic research behind all of this. I’ve tried not to burden you with it, but would be happy to share more sources if you’re curious, masochistic, or curiously masochistic.

Thanks, as ever …

To our faithful subscribers, the good folks at S&F Investment Advisors, Wilson, Greg, William, William, Stephen, Brian, David, Doug, and, most recently, Altaf. If you’d like to join them in their good work, you might click on the “Support Us” page.

Special thanks this month to Anitya, Don G (I humbly and entirely endorse your priorities when it comes to philanthropy: serve those in distress and work to rebuild a sane future), and Thomas from Moscow (Idaho, that is!)

And to Mr. Buffett and Mr. Munger and Mr. Popvich and all of the good folks who stuck it out, eschewing getting rich quick or quick wins for long careers that shaped the lives of investors and young athletes, in powerful ways.

And thanks to all of you for sharing fourteen years with us. MFO launched in May 2011 with the promise of carrying on the mission of its predecessor, FundAlarm: to speak with a human voice, humbly and without commercial pressure, to help investors navigate a world ridden with marketing hype, financial shenanigans, and easy answers.

It’s never been our goal to be the source of all the answers. Our goal is to help empower the better angels of our nature, the impulses to charity and justice, reflection, and deliberation. Our hope, in this issue and in the 168 that preceded it, is that your day is just a bit better for the presence of one voice and one message: “Take a deep breath. We can think this through together.”

david's signature

Trending Funds YTD 2025

By Charles Lynn Bolin

Each month, I update my ranking system for the thousand or so funds that I track using the MFO Premium fund screener and Lipper global dataset. I then compare the funds that I own to the trending funds to see if I want to make any changes. I follow a diversified traditional portfolio approach with over half managed by Fidelity and Vanguard. In this article, I look at the Lipper Categories and highest ranked funds for bonds, mixed assets, and equities.

Bond Funds

Bond funds are ranked based upon 1) three-year risk-adjusted returns (Martin Ratio), 2) short-term returns and momentum, 2) risk (drawdowns and Ulcer Index), 3) bond quality, and 4) yields, among other metrics. The funds in Table #1 are ordered from the highest ranked Lipper Category to the lowest, along with the five highest ranked funds. Over half of the investments in bonds that I manage are in bond ladders. I am satisfied with the performance of my funds; however, high-yield funds that are intended for income have had slightly negative returns year-to-date. Over the course of the next few months, I will evaluate trading Fidelity Capital & Income (FAGIX) for a short-term or inflation-protected bond fund.

Table #1: Top Ranked Lipper Bond Categories and Highest Ranked Funds – Three Year Metrics

Source: Author Using MFO Premium fund screener and Lipper global dataset with YTD Returns from Morningstar as of April 22nd

In Table #2, I display a snapshot of the highest-ranked fund in each of the above nine Lipper Categories. Note that IBTG in the U.S. Treasury General Category is the iShares iBond Dec 2026 Term Treasury ETF, which is a fund designed for bond ladders. I wrote about these funds in “ETF Bond Ladders” last month. Figure #1 shows the total return of these funds since Inauguration Day.

Table #2: Highest-Ranked Bond Funds – Metrics For Six Months

Figure #1: Total Return of Highest-Ranked Bond Funds Since Inauguration Day

Mixed Asset Funds

Mixed-asset funds are ranked based upon 1) three-year risk-adjusted returns (Martin Ratio), 2) short-term returns and momentum, 3) risk (drawdowns and Ulcer Index), 4) valuation, and 5) yields. Mixed-asset funds are great for a buy-and-hold strategy and letting a professional manager make the investment decisions. The drawback in retirement may be that you have less control over withdrawals because you can’t withdraw from certain categories when they are performing well.

Table #3 shows the Lipper Mixed-Asset Categories that I rank the highest, along with the five funds with the highest rank. Alternative global macro and alternative multi-strategy tend to have higher expense ratios. I may consider buying one as a “Risk Off” diversifier. In a “Risk On” environment, I may consider adding a flexible portfolio fund in accounts that I manage.

Table #3: Top-Ranked Lipper Mixed-Asset Categories and Highest Ranked Funds – Three-Year Metrics

Source: Author Using MFO Premium fund screener and Lipper global dataset with YTD Returns from Morningstar as of April 22nd

Table #4 shows a snapshot of the highest ranked fund in each Lipper Category, along with a few other well-known funds.

Table #4: Selected High-Performing Mixed-Asset Funds – Metrics For Six Months

Source: Author Using MFO Premium fund screener and Lipper global dataset

I like the return profile of the Eaton Vance Global Macro Absolute Return (EAGMX) fund as shown in Figure #2.

Figure #2: Total Return of Selected High Performing Mixed-Asset Funds Since Inauguration Day

Source: Author Using MFO Premium fund screener and Lipper global dataset

Equity Funds

I rank equity funds based upon 1) three-year risk-adjusted returns (Martin Ratio), 2) short-term returns and momentum, 3) risk (drawdowns and Ulcer Index), and 4) valuations. Almost all of the highest ranked Lipper Equity Categories are international or global. The returns are strong for the year in light of the uncertainty.

Table #5: Top Ranked Lipper Equity Categories and Highest Ranked Funds – Three Year Metrics

Source: Author Using MFO Premium fund screener and Lipper global dataset with YTD Returns from Morningstar as of April 22nd

Table #6: Selected High-Performing Equity Funds – Metrics for Six Months

Source: Author Using MFO Premium fund screener and Lipper global dataset

Figure #3: Total Return of Selected High-Performing Equity Funds Since Inauguration Day

Source: Author Using MFO Premium fund screener and Lipper global dataset

As the dust from the trade war settles, I will probably be in the market for a tax-efficient international or global equity fund. My short list is shown in Figure #4.

Figure #4: High-Performing Tax-Efficient International Equity Funds

Source: Author Using MFO Premium fund screener and Lipper global dataset

Closing

I believe that the impact of tariffs will begin to show up more clearly in June because imports affected by tariffs will reach the shelves in May. A recession won’t become evident unless the uncertainty spreads to business investments and international trade worsens, along with shocks to supply chains. The longer the uncertainty lasts, the higher the probability of a recession will be.

Tariffs are a regressive tax on lower-income households who spend most of their income on basic needs. Cuts to Federal programs that support the poor will increase the financial stress on these families. I favor fiscal responsibility and slowing the increase of the national debt in a well-thought-out bipartisan manner.

My ranking system is currently oriented to highlight funds that will do well in market downturns. I remain risk off and focus more on having a reliable cash flow from fixed income for the next five to ten years.

Daily FLOW Updates

By Charles Boccadoro

This week we announced daily updates to our MFO Premium fund flow tool; specifically, FLOW, which combines four plots for a single fund: total return, total net assets (TNA, aka AUM), total net flows, and daily or monthly flows (depending on how reported), each versus same time period. On funds that Lipper updates daily, like SPY, TIBIX, and in fact for most funds (approx. 11,500 oldest share classes; 26,000 all share classes), this tool will now enable users to assess performance and flows through the close of the last business day. This enhancement represents our first attempt at daily updates for the MFO Premium site, which, for the most part, focuses on month-ending performance, updated weekly. Interestingly enough, during the last two periods of severe daily volatility, March of 2020 (COVID) and April 2025 (Liberation), month-end returns were muted substantially from the daily gyrations, much to the delight of investors! But for those users who relate to trading based on trends, such as price movement and inflows/outflows, or for those who want to better understand the extent of daily movements, of say return and drawdown, these new daily updates should prove useful. Below is an example of FLOW chart output for Thornburg Investment Income Builder I (TIBIX) through last Friday.

For this example, the chart period is 10 months. The blue line indicates total return percentage since the start of that period, with values indicated on the right axis, as well as on the point tool (17.1%). The purple line indicates absolute TNA ($9.4B). The green line represents total net flows (-$19.7M). The vertical bar chart at the bottom indicates the daily flows across the ten months, with inflow highlighted in green and outflow highlighted in red. Lipper updates the daily flow data twice daily: at about 9 pm Pacific and again at 9 am. Whatever funds do not make the nightly drop, the morning drop should pick up. We will try to post updates after each, providing insight before markets close the following day. Most funds do get updates daily, but not all. About 900 funds are only updated monthly; unfortunately, these are some of the most popular open-ended funds, including many Vanguard, PIMCO, and Dodge & Cox funds. The latter actually delays releasing the flow data until the following month. FLOW remains one of the easiest to use on the premium site. Just click FLOW in the navigation bar at the top of any page. Then, punch in the ticker symbol and hit return.

My Investment Strategy For 2025

By Charles Lynn Bolin

With the high volatility over tariffs, uncertainty, and concerns over the independence of the Federal Reserve, parts of this article may be out of date within hours of completing it. How does one invest in this environment? I have updated my Investment System to reflect my current strategy. In short, it is set up as a traditional 60% stock/40% bond portfolio within a range of 55% to 65% stocks based on my investment model. I set the model up to make small quarterly adjustments based on volatility-adjusted momentum and a shift between international and domestic growth based on valuations and momentum.

In April, I searched for and found that I can download the monthly returns for the life of a fund in the MFO Premium fund screener and the Lipper global dataset. I began creating investment models over a decade ago using data mostly available at the St. Louis Federal Reserve Database (FRED). Using actual fund data from MFO is a huge improvement. The objective of the model is to maximize the returns on investments since 1995, given my constraints. There is a lot of data at FRED that covers this time period, and I want an “all-weather” approach with low turnover. I modified the Investment Model in April to use historical data on four equity funds and seven fixed income funds.

The Funds

The twelve funds that I included in the Investment Model are shown in Table #1 along with two excellent mixed-asset funds for a baseline: T Rowe Price Capital Appreciation Income (PRWCX) and FPA Crescent (FPACX). Notice that the SPDR S&P 500 ETF (SPY) returned 10.3% over the past thirty years while PRWCX and FPACX have competitive returns of 10.8% and 9.8%, respectively. The funds were selected that can neatly fit into a Bucket Approach. The bond selection includes riskier bond funds that have a low correlation to stocks and are less risky than stocks. The funds were selected to maximize the return in the Model while maintaining a low turnover philosophy.

Table #1: Funds In Investment Model – Thirty Year Metrics

Source: Author Using MFO Premium fund screener and Lipper global dataset

During the time period from 1995 to 2013, many mixed-asset funds outperformed the S&P 500 for several reasons. First, bonds outperformed stocks during the two major bear markets, and international stocks outperformed domestic stocks over long periods of time, especially as domestic equities became overvalued during the Housing Bubble.

Figure #1: Funds In Investment Model – Total Return 1995 – 2013

Source: Author Using MFO Premium fund screener and Lipper global dataset

During the time period from 2014 to 2025, Quantitative Easing and easy monetary policy suppressed bond yields, and valuations of domestic equities became overvalued. International equities have underperformed. As a result, mixed-asset funds have performed worse than the S&P 500.

Figure #2: Funds In Investment Model – Total Return 2014 – 2025

Source: Author Using MFO Premium fund screener and Lipper global dataset

At the start of the year, domestic stocks were highly valued. The S&P 500 was down almost ten percent year-to-date (as of April 22nd) compared to foreign large growth, which rose nearly 6% this year. The price-to-book value of the S&P 500 is still high compared to international stocks.

Table #2: Funds In Investment Model – Year-To-Date Performance

Source: Morningstar as of April 22nd, 2025

Portfolio Allocation and Performance

The investment model uses economic and financial indicators for the past thirty years to “nowcast” current market conditions. My investment strategy is to follow a traditional portfolio of funds with 60% allocated to stocks within a range of 55% to 65%, and 1) make adjustments quarterly for 2% of the portfolio based on quarterly returns adjusted for volatility, 2) shifting up to 5% of equity between domestic and international growth funds based on valuations and momentum, and 3) using the Investment Model calculated stock to bond ratio for “risk on – risk off”. The allocations over the past thirty years are shown in Figure #3.

The Investment Model likes cash, which I have capped at 15%. Money markets performed “less badly” than many bond funds during Quantitative Easing, and bond performance worsened starting in 2022. Cash is not trash. Recently, inflation-protected bonds have been performing well, as have short-term investment-grade and international bond funds. On the equity side, I limit the allocation to domestic growth stocks to 15% of the portfolio. The model began shifting allocations to international stocks as valuations increased, even though domestic growth was outperforming, but international stocks have performed exceptionally well in 2025.

Figure #3: Investment Model Allocations

Source: Author

My objective is to learn from how different strategies work and not unrealistically optimize a back-tested strategy. I have the advantage of thirty years of economic data available at the St Louis Federal Reserve (FRED) database, hindsight on valuations, and actual fund performance. The Investment Model returned 11.6% APR over the thirty years compared to 10.3% for SPDR S&P 500 ETF (SPY), 10.8% for T Rowe Price Capital Appreciation Income (PRWCX), and 9.8% for FPA Crescent (FPACX).

Figure #4: Investment Model Total Return vs S&P500, FPACX, PRCWX

Source: Author

There are thirteen mixed asset funds that have returned 9% or more over the past thirty years during the time when the S&P 500 returned 10.3%. All of them have a higher risk-adjusted return as measured by the Martin Ratio than the S&P 500. Most of the mixed asset funds outperformed the S&P 500 during the 1995 to 2013 time period, while the S&P 500 outperformed since 2014.

My Assessment

The Investment Model has recommended a risk-off allocation of 55% since the middle of 2022. I let the winners run, and the allocation rose to 65% by the end of last year. As I described previously, I made withdrawals to refill short-term Investment Buckets and reduced ris,k lowering allocations below 60% prior to inauguration day. What drove this weakness when the market rose by twenty percent over the past two years?

The Investment Model consists of over thirty main indicators that are composed of over a hundred sub-indicators. Let’s take a look at a few of these. Nearly 70% of the gross domestic product is consumer spending. My Consumer Health Indicator, shown in Figure #5, estimates the consumer’s ability to spend in the future. It is based on Wages, Spending, Consumer Sentiment, Labor Conditions, Credit Delinquencies, Disposable Income, Savings Rates, and Consumable Orders. Where appropriate, these are adjusted for inflation. The Consumer is running out of breath. About two-thirds of households are living paycheck to paycheck, and about half of these don’t have enough savings to cover three months of living expenses. Social trends like “Under-Consumption Core” and “Don’t Buy 2025” reflect the desire to cut back on spending and save more.

Figure #5: Consumer Health

Source: Author Using St Louis Federal Reserve FRED database

Figure #6 is my Corporate Health Indicator, which is a composite of Net Value Added (a measure of contribution to the economy after depreciation), Profits, Sales, and the Prime Rate. Where appropriate, these are adjusted for inflation. Increasing tariffs will produce winners and losers, but a slowing economy will negatively impact most businesses.

Figure #6: Corporate Health

Source: Author Using St Louis Federal Reserve FRED database

In Figure #7, I composite a half dozen measures of valuation to conclude that prior to the market correction, equities rivaled the Technology Bubble for high valuations. They are still highly valued despite the current market correction.

Figure #7: Equity Valuation

Source: Author Using St Louis Federal Reserve FRED database

Figure #8 shows my Recession Indicator. I built it to give advance warning of recessions. The probability of a recession (green line) has been falling steadily since 2022. The New York Federal Reserve recession probability based on the yield curve (black line) remains above 50%. Data impacted by tariffs and uncertainty will trickle in over the course of the year, and I expect the recession probability to rise substantially.

Figure #8: Recession Indicator

Source: Author Using St Louis Federal Reserve FRED database

Closing

The Investment Model is a good guideline for how I want to invest; however, there have been a lot of innovations in funds, the internet, and tools. I use Financial Advisors at Fidelity and Vanguard to manage over half of my investment, which is mostly in the moderate to higher risk accounts. I manage mostly the more conservative accounts for income. My overall portfolio has similar allocations to the types of funds in the Investment Model, but not the same funds.

I see similarities to the stagflation of the 1970s because tariffs increase inflation and the uncertainties associated with supply chain disruptions. I believe that less government spending and fewer regulations will return us closer to post-World War II stock market behavior, with more frequent and hopefully less severe recessions. The 1995-2013 investment environment will be more representative of the next decade than the 2014-2025 period.

High valuations are still a headwind for domestic equity returns. International investors have pulled money from US markets, keeping yields high on US 10-year Treasuries. The rising national debt will tend to keep interest rates higher for longer. Credit spreads on high-yield bonds are increasing. Uncertainty is built in until July 8th when the ninety-day pause on tariffs ends, or is extended, or trade deals are reached, or fresh demands are added, or…

Following the Model Portfolio, I intend to increase allocations to short-term investment-grade and inflation-protected bond funds over the course of the year. As for the uncertainty in the markets, my Investment Buckets for the Short- and Intermediate-term are solid with little volatility. I made major adjustments prior to inauguration day and have made a few changes due to tariffs or volatility. I will use volatility-adjusted momentum to adjust allocations for the rest of the year with a focus on ensuring the stability of withdrawals. I remain risk off.

Building a chaos-resistant portfolio, Round 2

By David Snowball

In December 2024, we forecast chaotic markets. Even if you were broadly supportive of Mr. Trump’s policy direction, the fact remains that he has announced, altered, suspended, or cancelled tariffs more than 28 times in 2025, including pausing some tariffs within 24 hours of announcing that the suggestion he might pause tariffs was “fake news.” His desire to reduce federal spending was manifested in the decision to turn Elon Musk loose to ransack the government in search of a promised $1 trillion in savings. Bloomberg’s assessment: “100 days of DOGE: lots of chaos, not so much efficiency.”

At a NewsNation town hall, Mr. Trump was asked what he thought was the biggest mistake of the first 100 days of his administration. His response was, “I’ll tell you that’s the toughest question I can have because I don’t really believe I’ve made any mistakes.” If true, it’s unlikely that Mr. Trump feels an impulse to change his policy-making strategy, which portends rather more of the same.

As of May 1, 2025, the Vanguard Total Stock Market Index Fund was down 5.5% year-to-date. That modest loss masks a bunch of thrashing about. Chip analyzed the daily closing value of the Dow Jones Industrial Average for each day of 2024 and 2025. She notes that there were 28 trading days this year when the index jumped more than 1%, including one five-day period that registered down 4.1%, down 5.8%, down 0.9%, down 0.9%, then up 7.3%. Trading volume was over one billion on seven days in the first four months of the year, compared to two days in all of 2024. And the average trading volume was 650 million, compared to 376 million in 2024.

Short version: enormous thrashing about with panic buying and selling, and more to come.

Our recommendations were two-fold:

  1. Act.
  2. Do not panic.

Our recommendations were (and are):

  1. Consider an actively managed multi-asset fund, that is a fund in which the managers have the option of lightening US equity exposure if US equities aren’t offered compelling opportunities. There are a lot of managers who try that game (sometimes tracked in categories like “tactical allocation” or “world allocation”), but most, not surprisingly, don’t earn their fees. Several do.

    FPA Crescent (FPACX) was, long ago, a hedge fund, and that ethos remains. The managers have an absolute return focus and a mandate to invest across capital structure, geographies, sectors, and market caps. They’re famously independent and consistently successful, though the vogue of ETFs has reduced the fund’s AUM to half of what it once was. In many ways, this operates to the advantage of its current investors, who benefit from a more nimble fund and a larger investible opportunity set.

    Leuthold Core Investment Fund (LCORX) is one of the original quant funds with a strategic allocation of about 60% equities, but the ability to drop that dramatically when the data doesn’t support high equity exposure. Currently, their net exposure to US equities is about 40%.

    Leuthold Core Equity ETF (LCR) is the lower-cost version of the fund, with the tactical allocation executed almost entirely by investing in ETFs.

  2. Consider a fund that “games” the market for you; that is, a fund whose managers can either short equities or generate exposure to other asset classes through low-cost futures contracts.

    Standpoint Multi-Asset (BLNDX/REMIX) is 50% global equities and 50% managed futures, both long and short, from seven sectors: equity indexes, currencies, interest rates, metals, grains, soft commodities, and energy. It has done poorly in 2025, which irks but does not panic the managers. Eric Crittenden’s explanation is thoughtful and a bit provocative, since it suggests that larger changes might be afoot in the market:

    “Recent performance hasn’t been particularly pleasant. But we are closely tracking the blend of trend and equity that we seek.

    Our research, spanning 54 years of data, suggests potential drawdowns of 12% to 20% every 5 to 10 years or so. Generally, these have aligned with market regime shifts: 1975, 1980, 1987, 1992, 2002, 2008, 2018, and now 2025.

    Our long equity program gets hurt in bear markets. Our macro program gets hurt in the transition from an established macro theme to a different theme. Occasionally, these happen at the same time; equities and trend become correlated, and we lose money on both, leading to a larger-than-average drawdown.

    That is our blind spot, and every strategy has one. Curing that blind spot can be attempted with tail-risk hedging strategies, but they have a negative expected return and undesirable tax consequences. We think our current approach is the most durable and productive over the long term.”

    Which might suggest that BLNDX’s lag is confirming other hypothesized shifts: from US to global, growth to value, speculative to quality, and large to smaller.

    Dynamic Alpha Macro (DYMIX) is a 50% US equities and 50% futures trading strategy, which sounds like Standpoint but is fundamentally different. Standpoint’s strategy is quantitative and trend-following, Dynamic Alpha’s is macro-driven. That is, the futures adviser identifies important macro trends (“coordinated central bank rate cutting cycle” would be an example) and positions the futures contracts to profit from them.

  3. Consider a fund whose managers are willing to hold cash, as Mr. Buffett is, when holding stocks is a poor bet. We’ve written about the strategy for years, and have designated the managers who follow it as “the dry powder gang.”

    Kinetics Global targets “classic value investment opportunities worldwide,” which is a reasonably well-diversified portfolio of about 60 names and a single-digit turnover ratio.

    Marshfield Concentrated Opportunity is a concentrated value fund with a huge disparity in its capture ratio: it captures 80% of the market’s gains but suffers only about 25% of its losses. More or less 20 high-quality, undervalued names in the portfolio at any one time.

    Towpath Focus is concentrated, low-turnover, diversified, quality-focused, and risk-conscious. It’s also consistently excellent, with manager Mark Oelschlager at the helm since inception.

  4. Consider increasing your exposure to high-quality stocks, which have traditionally crushed the market in the long term by being decent in good markets and great in terrible ones. It’s a phenomenon we’ve documented in The Quality Anomaly.

    GQG Partners US Select Quality Equity and GQG Partners US Quality Value (formerly GQG Partners US Quality Dividend Income) are both managed by Rajiv Jain, whose record of excellence stretches over decades and whose firm is entirely devoted to investing in high-quality equities. GQG Partners primarily relies on fundamental, rather than quantitative, research to evaluate each business based on financial strength, sustainability of earnings growth, and quality of management.

    GMO US Quality Equity ETF (QLTY) is the retail investor’s path into the discipline embodied in GMO Quality, a fund with a 20-year track record, five-star performance … and a $250 million minimum initial investment.

  5. Consider adding a short-term or short-term high-yield fixed income fund to the mix. These funds typically invest in fixed-income securities whose returns are uncorrelated with the gyrations of the Fed. Short-term high-yield bonds have provided comparable returns to the broader high-yield market but with significantly lower volatility. Over the course of a full market cycle, such funds tend to return about 4% per year.

    Intrepid Income. Intrepid Income Fund is a fixed income fund that primarily invests in U.S. corporate bonds, aiming to generate strong risk-adjusted returns and high current income while protecting and growing capital. With a focus on downside protection and risk control, the fund typically invests in smaller bond issues of less than $500 million, targeting businesses with low leverage ratios and consistent cash flows1. The fund’s strategy has demonstrated resilience while maintaining a relatively concentrated portfolio of 15 to 70 high-yield securities. You might anticipate returns of 4-5%.

    RiverPark Short-Term High Yield invests in, well, short-term, high-yield debt securities. Its strategy focuses on identifying opportunities where the credit ratings may not fully reflect a company’s ability to meet its short-term obligations. The fund targets investments in companies undergoing or expected to undergo corporate events, such as reorganizations or funding changes, which could enhance their capacity to repay debt. About to celebrate its 15th anniversary, the fund, the fund has the highest Sharpe ratio (over 5.0 since inception) in existence. That is, it offers a better risk-return tradeoff than any other fund or ETF. You might anticipate returns of 3-5% with negligible downside.

YTD Performance, through 4/30/2025

  Box YTD returns Peer rank Net equity exposure
Vanguard Total Bond Market Benchmark 2.2% Top 30% 0%
Vanguard Total Stock Market Benchmark -5.5% Bottom third 100%
GMO US Quality Equity Quality -1.7% Top 25% 100%
GQG Partners US Select Quality Equity Quality -3.5% Top 25% 98%
GQG Partners US Quality Value Quality +5.7% Top 2% 99%
Leuthold Core Flexible +0.25% Top 30% 45%
Leuthold Core ETF Flexible -0.2% Top 30% 50%
FPA Crescent Flexible -0.1% Bottom 20% 55%
Standpoint Multi-Asset Non-correlated -9.0% n/a 54%
Dynamic Alpha Macro Non-correlated +5.5% Top 1% 51%
RiverPark Short-Term High Yield Short-term high income 1.4% Top 20% 0%
Intrepid Income Short-term high income 0.4% Bottom 10% 3%
Towpath Focus Cash rich 3.4% Top 5% 85%
Marshfield Concentrated Opportunities Cash rich 2.5% Top 3% 72%
Kinetics Global Cash rich 5.5% Top 1% 47%

My own non-retirement portfolio, which we disclose every February, is structurally cautious: 50% equities / 50% not. In equities, 50% US / 50% not. In non-equities, 50% cash / 50% not. Roughly 25% US equity, 25% international, 25% cash, and 25% other diversifiers such as short-term bonds. Year-to-date, it’s up 2.5% and its five-year average is about 9.5%.

Bottom Line

There is no reason to anticipate greater predictability or stability in the markets than we’ve seen so far in 2025. Formal resumption of a bear market is possible as investors, globally, lose interest in betting on the US. That suggests that betting on what has worked in the past – large, momentum, US, tech, high beta – may turn out to be wildly imprudent. Leavening your portfolio now with assets that have been out of favor – smaller, stable, quality, global – has the prospect of protecting portfolio and sanity both!

Launch Alert: T Rowe Price Capital Appreciation Premium Income ETF

By David Snowball

On March 26, 2025, T Rowe Price launched T Rowe Price Capital Appreciation Premium Income ETF (TCAL), the latest addition to its capital appreciation suite of funds and ETFs. The fund is managed by a six-person team with David Giroux in the lead. It posts an expense ratio of 0.34%.

The fund’s unique niche within the Capital Appreciation suite is its focus on “regular” income payouts. It will normally invest in equities with a covered call options strategy overlay. The equities will be selected using Giroux’s traditional discipline, which favors:

  • experienced and capable management;
  • strong risk-adjusted return potential;
  • leading or improving market position or proprietary advantages;
  • attractive valuation relative to a company’s peers or its own historical norm; and/or
  • low beta and defensive risk-adjusted return potential.

The regular distributions may consist of dividends and cash from the covered call option premiums.

The prime attraction of the fund is David Giroux, a two-time winner of the Morningstar Fund Manager of the Year award, and PRWCX record. The flagship Capital Appreciation Fund has been closed for years with $66 billion in its portfolio, and has beaten its peers for seventeen consecutive years. That is a streak unmatched in the last 100 years. Here is T Rowe Price’s text on the matter:

  • The T Rowe Price Capital Appreciation Fund, led by David Giroux, has outperformed its Morningstar category average for 17 consecutive years, setting a record for U.S. equity or multi-asset funds.
  • No multi-asset or U.S. equity mutual fund or ETF has had a longer streak under the same portfolio manager. The analysis compared the fund to more than 3,000 funds since 1925, the first full calendar year performance of the first mutual fund.
  • Over the 17-year period ending December 31, 2024, the fund ranked in the 1st percentile in its category, with returns nearly double that of its peer group average.

The regular payout piece will generate a tax bill, where you choose to realize the income (that is, they send you a check) or reinvest it. That said, it seems like a fund with very few obvious flaws. If you’re interested in income plus the prospect of some capital gain, you should put it on your due diligence list now.

T Rowe Price Capital Appreciation Premium Income ETF

Funds Goals Asset allocation Target investors
PRWCX
Capital Appreciation Fund
Closed
Pursues equity-like returns with significantly less risk. Stocks: 50%–70%
Bonds: 30%–50%
  • Have an intermediate investment horizon
  • Have a moderate risk tolerance
PRCFX
Capital Appreciation and Income Fund
Pursues attractive income while aiming to grow your initial investment over time. Stocks: 30%–50%
Bonds: 50%–70%
  • Have a shorter investment horizon
  • Have a lower risk tolerance
  • Are approaching or in retirement
TCAF
Capital Appreciation Equity ETF
Seeks to outperform the S&P 500 Index with a lower risk profile and better tax efficiency than an S&P 500 Index ETF. Stocks: 100%
Bonds: 0%
  • Have a longer investment horizon
  • Have a higher risk tolerance
TCAL
Capital Appreciation Premium Income ETF
Seeks to deliver high income through a combination of call option premiums and equity dividends. Stocks: 100%
Bonds: 0%
  • Aim to maximize income while preserving principal
  • Are in retirement

Dynamic Alpha Macro (DYMIX)

By David Snowball

Objective and strategy

The managers aspire to outperform the S&P 500 over meaningful time periods, while managing risk by blending non-correlated assets such as a discretionary global macro strategy with a portfolio of US equities. The portfolio has two components: a US equity component, which is executed by buying low-cost ETFs, and a macro-driven Futures Trading Strategy. Through rebalancing between these approaches, they hope to harness divergent performance drivers to create what they term “Dynamic Alpha.” The equity strategy divides its investments between growth, high-dividend, and broad market stocks. The Future Trading Strategy, executed by a trading adviser, provides exposure to over 40 liquid markets with negligible return correlations to each other and the S&P 500.

Adviser

Dynamic Wealth Group, LLC, of Las Vegas, Nevada. The parent corporation serves as a sort of advisor-to-advisors, offering outsourced chief investment officer services to financial planners. The discipline was then embodied in the Dynamic Alpha Macro fund. As of April 2025, the firm had $150 million under management and more than two billion under advisement.

Managers

Bradley Barrie and David Johnson. Mr. Barrie has earned the CFP and ChFC certifications, is the firm’s CIO, and co-founder of the Dynamic Wealth Group. David Johnson, Managing Director and Chief Operations Officer, started his career at NASA as a systems engineer on the Space Shuttle program. Messrs. Barrie and Johnson have managed the fund since its inception. It is their sole charge. Asim Ghaffar is an advisor for the futures-trading strategy and is the founder and CIO of AG Capital, a global macro hedge fund based in Boston, Massachusetts. That fund was established in 2014 and aims to deliver attractive absolute returns with zero correlation to major asset classes and other macro managers.

Strategy capacity and closure

Their current projection is that their strategy would be constrained at about a billion in AUM, at which point they would likely soft-close the fund. That said, their markets are all ultra-liquid, so they’ll need to judge as the decision point approaches.

Management’s stake in the fund

Lead manager Brad Barrie has invested over $1 million in the fund. David Johnson has invested $100,000 – $500,000.

Opening date

July 31, 2023, though Morningstar lists the managers’ start as 07/02/23.

Minimum investment

$5000

Expense ratio

The reported net expense ratio is 1.98% on assets for $150 million (as of 4/30/2025). That said, the most recent Semi-Annual Shareholder Report reports “1.73% is the Cost paid as a percentage of a $10,000 investment” (12/30/2024), which portends a likely reduction in the reported expense ratio when the prospectus is updated in November.

Comments

The Dynamic Alpha Macro Fund was launched in August 2023. The fund employs a distinctive dual strategy approach, allocating assets approximately equally (50%/50%) between equity securities and futures trading strategies. This combination aims to deliver returns that are minimally correlated to broader market movements by blending non-correlated assets.

The equity securities component invests in exchange-traded funds (ETFs) that provide low-cost broad market exposure, while the futures trading strategy involves long and short positions across various assets, including currencies, debt, equities, energy, metals, and agricultural commodities. More specifically, the equity allocation is divided among growth stocks (approximately 40%), above-average dividend-paying stocks (approximately 40%), and broad market stocks (approximately 20%).

Performance Analysis

The fund has done well in its relatively short history. The fund was ranked as the #1 performing fund for 2024 in the Morningstar Macro Trading category out of 60 funds, with a gain of 18.4% against its peers’ 6.5%. In the Lipper rankings, it finished #3 of 45 in 2024. This achievement is particularly notable given the challenging market environment.

Fit in a Chaos-Resistant Portfolio

The fund’s dual strategy approach is specifically designed to provide smoother returns during market turbulence – a key consideration for a chaos-resistant portfolio. By combining equity securities with futures trading strategies that can provide non-correlated returns, DYMIX aims to deliver a smoother investing experience compared to equity-only strategies.

For context, 2024 was a banner year for U.S. stocks, with the S&P 500 up more than 23%. However, beneath the surface, only 19% of stocks within the S&P 500 actually outperformed the index itself. This disparity highlights the importance of strategies that can navigate selective market environments.

For investors seeking protection against market volatility in the current environment, particularly given the political transitions and economic uncertainties, DYMIX offers several compelling attributes:

  1. Diversification Beyond Traditional Assets: The fund’s dual approach provides exposure to both equities and alternative strategies through futures trading, potentially offering more robust diversification than traditional stock/bond portfolios. Mr. Barrie argues that “True diversification requires multiple drivers and multiple diversifiers, not just one of each.” By MFO’s calculation, the fund’s since-inception (19 months) correlation with the S&P 500 has been 0.27.

    19-month correlations between the highest Sharpe ratio Global Macro funds and the S&P 500

    Source: MFOPremium.com fund screener and Lipper global dataset

  2. Active Management During Volatility: The fund aims to serve as “an alpha creator and potential volatility buffer to traditional asset allocation strategies.” In turbulent markets, this active approach may provide value. That does not involve single-direction bets or trend following. Barrie argues, “Don’t have a crystal ball. Too many investors and advisors rely on hope or predictions; our approach is to be prepared for a range of outcomes since pretty much anything can happen.” That’s illustrated, we think, by the fund’s performance over the first four months of 2025.

  3. Demonstrated Performance: The fund’s strong performance in 2024-25 suggests the strategy can deliver results, though its track record remains relatively short. Its 18.4% APR since inception exceeds the S&P 500 and vastly exceeds its peers. The private fund, whose strategy is reflected in the futures trading strategy, has a strong record stretching over more than a decade.

Considering the hedge

Traditionally, hedge funds were not designed to be an investor’s core holding. They were designed to complement the core, to provide a degree of protection in bad times and a possible boost to performance in good ones. The question is, how large should the hedge be relative to the core? The advice commonly given by financial planners, driven by reasonable research, is to devote perhaps 5 to 10% of a well-diversified portfolio to a hedge.

In Dynamic Alpha Macro, there’s essentially a 50/50 split between core and hedge. You might reasonably ask, is that weight justifiable? Recent academic research endorses the possibility. A hedge has two possible roles in a portfolio: it reduces beta (that is, dampens volatility and likely total return) or it adds alpha (that is, boosts total long-term returns). The research that recommends limiting the hedge to a small sliver is driven by the view that your hedges just reduce beta. Holding cash or short-term bonds in an equity fund, for example, would dampen volatility but would trade off assets that might produce high long-term returns (equities: 10% or so) for ones that would produce lower returns (cash / short-term bonds: 4% or so). That all changes if your hedge also adds alpha; researchers recently concluded that a hedge that adds 2% in alpha might receive a weight as high as 100% of the portfolio (Gregory Brown, et al, “Optimal Hedge Fund Allocation,” SSRN, 31 Mar 2025).

To be clear: that’s not Dynamic Wealth’s intent. But it does corroborate the decision to incorporate a very large, alpha-generating macro-driven component into the portfolio.

The “macro” part is critical to your assessment of the fund. Many fine funds use a futures strategy to execute a momentum or trend-following discipline; that is, they have an algorithm for what’s worked recently and what hasn’t. They buy the former and dodge or short the latter. A macro strategy is distinct. They’re looking to exploit macro-level events (climbing demand for copper, coordinated central bank rate cuts, currency revaluation, or whatever) that operate independently of the whims of the stock market. Executed well, that generates market-independent alpha.

However, several considerations should temper expectations:

  1. Limited Track Record: With less than two years of history, the fund’s long-term performance through various market cycles remains unproven.
  2. Higher Expenses: The above-average expense ratio will create a performance drag that must be overcome by consistently superior management. We’ve talked with the advisor about it, and they’ve emphasized their commitment to reduce expenses as assets grow, which they have done.
  3. Management Expertise: The management team’s relatively short tenure with the fund means investors are placing significant faith in their ability to navigate complex markets.

Bottom Line

The Dynamic Alpha Macro Fund stands out as a promising tool for building a chaos-resistant portfolio. Its dual-strategy approach, strong recent performance, and top industry ranking make it worthy of consideration for investors looking to add diversification and reduce reliance on traditional markets. Caution is warranted due to its short history, but its structure and results to date indicate it could play a valuable role as part of a broader, thoughtfully diversified investment strategy. As the markets become less certain, the need for chaos managers grows.

Fund website

https://dynamicalphafunds.com/

Braham’s Chaos-Resistant Fund Portfolio

By David Snowball

Friend Lewis Braham, writing in Barron’s, offered “The Chaos-Resistant Fund Portfolio” on April 7, 2025. For those who have not seen Lewis’s essay, here’s a recap. He begins with a fairly stark warning that parallels ours:

Voters elected Trump specifically as a populist disrupter. He’s doing what they asked. While Democrats call Trump an autocrat for consolidating power in the executive branch, that’s largely irrelevant to Wall Street, as money managers have happily invested billions in authoritarian or quasi-authoritarian regimes … The problem now is that with limited checks from other government branches, investors are increasingly dependent on Trump’s whims, whether they consider him pro-business or not.

Right now, he seems anti-investor.

Mr. Braham recommends four strategic allocation choices for your consideration:

Cash, “the most obvious form of downside protection,” is accessible through money market funds yielding 4.5%.

Bonds “have proved to be defensive this year,” but short-term high yield, which is mostly insulated from interest rate changes, might bear special attention.

Gold, particularly bullion, “is the oldest hedge. It offers especially useful protection against geopolitical uncertainty.”

Hedged mutual funds “can prove useful if both stocks and bonds fall.”

Large-Cap Value Stocks “reduce risk” in a portfolio heavily tilted toward indexes like the S&P 500. He gives a special nod here to GQG Partners.

Global equities “make good diversifiers, especially now, as they’re rising while the U.S. stumbles.” In my own portfolio, the strongest performers in 2025 are the two Seafarer funds: Overseas Value (11.2% YTD) and Overseas Growth & Income (9.6%).  Lewis mentions First Eagle Global (8.5%, with a portfolio that might hold bonds, cash, or gold as well as stocks) and Causeway International Value (13.5%) as worthy candidates for your due diligence list.

Briefly Noted

By TheShadow

Updates

After 35 years with Ariel Investments, effective May 1, 2025, John P. Miller is retiring from his role as portfolio manager for the Ariel Fund.

RiverNorth/Oaktree High Income Fund (RNHIX) won the 2025 LSEG Lipper Fund Award for Best General Bond Fund for the five-year period ended November 30, 2024. RiverNorth is a closed-end fund specialist that has collaborated with other “A” managers on several funds. The fund embodies three strategies. RiverNorth manages the Tactical Closed-End Fund Strategy, and Oaktree manages the High Yield Bond and Senior Loan Strategies. Oaktree tactically manages the allocation between the High Yield Bond and Senior Loan Strategies based on both market opportunities and the risk-reward trade-offs between the two asset classes. The fund has returned 4.2% APR since inception, while the Bloomberg US Aggregate Bond Index clocked in at 1.6%.

Briefly Noted . . .

Lazard US Equity Concentrated Portfolio will undergo a reverse stock split, 1:3, effective May 16, 2025.

BlackRock has filed for a new active infrastructure ETF, iShares Active Infrastructure ETF, which will likely launch by the end of June. The ETF, which does not yet list a ticker or fees, is to be managed by Balfie Morrison, who leads the BlackRock Global Listed Infrastructure fund, which is currently only offered in Australia. The Australian fund launched in 2007 and has, since inception, trounced its benchmark (11.5% APR vs 8.75% for a Developed Core Infrastructure 50/50 index). Mr. Morrison became co-manager of that fund in September 2023. Reportedly, the new ETF will be substantially similar to that fund. If so, expect a bit over 50% US and a bit over 50% utilities. BlackRock also offers the passive, five-star $2.2 billion iShares US Infrastructure ETF (IFRA).

Small Wins for Investors

JPMorgan Emerging Markets Equity fund reopened to new investors effective April 1. The fund was soft closed since May 2020, when it hit its target capacity. The decision to reopen the fund is due to significant redemptions in recent years, due to the sentiment of emerging markets and underperformance.

Effective May 1, 2025, the expense ratio for Janus Henderson Corporate Bond ETF has dropped to 0.20% for at least 12 months.

Launches and Conversions

BlackRock GA Dynamic Equity fund and the BlackRock GA Disciplined Volatility Equity fund will be converted into the iShares Disciplined Volatility Equity Active ETF and the iShares Dynamic Equity Active ETF, respectively, on Sept. 12. The expense ratios will be 0.4%, and both funds will retain their current objectives and managers and maintain “substantially similar” strategies.

GQG US Equity ETF is an actively managed exchange-traded fund in registration. Under normal circumstances, the ETF will invest in U.S companies. Rajiv Jain, Brian Kersmanc, and Sudarshan Murthy are the portfolio managers; Siddharth Jain is the Deputy Portfolio Manager. Total Annual Fund Operating Expenses After Fee Reductions and/or Expense Reimbursements will be 0.49%.

On or about May 9, 2025, Lazard International Equity Advantage Portfolio will convert to an ETF, the Lazard International Dynamic Equity ETF.

On or about November 7, 2025, Morgan Stanley Global Fixed Income Opportunities Fund will be rechristened as Morgan Stanley Income Opportunities Fund and relaunched as an active ETF.

Pending shareholder approval in June, the Morgan Stanley Mortgage Securities Trust will relaunch as the Eaton Vance Mortgage Opportunities ETF.

On June 20, 2025, the OTG Latin America Fund will become the OTG Latin America ETF.

On April 3, Vanguard Short Duration Bond ETF, an actively managed exchange-traded fund, launched. It offers diversified exposure to primarily short-duration U.S. investment-grade bonds, including structured products exposure, like asset-backed securities, with the flexibility to invest in below investment-grade debt to seek additional yield. The fund has an expense ratio of 15 bps.

Vanguard Total Inflation-Protected Securities ETF, Vanguard Total Treasury ETF, and Vanguard Government Securities Active ETF are in registration. Joshua C. Barrickman, CFA, will be the portfolio manager of the inflation-protected securities and total treasury ETFs. John Madziyire, CFA, Nathan Persons, and Brian W. Quigley, CFA, will be the portfolio managers of the government securities active ETF. The Total Inflation-Protected Securities ETF will have total annual expenses of .05%; the Total Treasury ETF will have total annual expenses of .03%; and the Government Securities Active ETF will have total annual expenses of .10%.

Virtus IG Public & Private Credit ETF is in registration. David Albrycht, CFA; Zachary Szyndlar, CFA; Ryan Jungk, CFA; George Goudelias; and John Wu, CFA will manage the fund. The plan is to provide diversification by allocating the fund’s investments among various sectors of these markets, including, without limitation: investment grade corporate bonds; mortgage-backed securities (“MBS”), including commercial MBS and residential MBS; asset-backed securities (“ABS”); and collateralized loan obligations (“CLOs”), including private credit. Expenses have not been stated.

Old Wine, New Bottles

Effective on or about November 21, 2025, the BlackRock U.S. Carbon Transition Readiness ETF becomes the iShares U.S. Carbon Transition Readiness Aware Active ETF. “Readiness Aware.” Your guess is as good as ours.

Effective May 2, 2025, the Calamos Alternative Nasdaq® & Bond ETF will become the Calamos Nasdaq® Equity & Income ETF.

Carillon Chartwell Small Cap fund will be reorganized into the Chartwell Small Cap Growth fund on or about October 17.

The following name changes will take effect on June 2, 2025:

Current Fund Name New Fund Name
 iShares MSCI USA ESG Select ETF iShares ESG Optimized MSCI USA ETF
 iShares ESG MSCI USA Min Vol Factor ETF iShares ESG Optimized MSCI USA Min Vol Factor ETF
 iShares Paris-Aligned Climate MSCI USA ETF iShares Paris-Aligned Climate Optimized MSCI USA ETF
 iShares Paris-Aligned Climate MSCI World ex USA ETF iShares Paris-Aligned Climate Optimized MSCI World ex USA ETF

My first impulse was: “more babble.” Maybe not. Here’s their explanation.

The iShares ESG Optimized MSCI USA ETF’s Underlying Index is an optimized index designed to maximize exposure to positive ESG characteristics while exhibiting risk and return characteristics similar to the MSCI USA Index. In addition to its name change, effective with the rebalance at the end of May 2025, the Index Provider for iShares ESG Optimized MSCI USA ETF has updated the index methodology to require that the Underlying Index have a minimum ESG score of at least 20% better than that of the MSCI USA Index …

On June 25, 2025, Janus Henderson Responsible International Dividend Fund will be (new word for me) “repositioned” as the ESG-lite Janus Henderson International Dividend Fund. At base, they will loosen ESG strictures on the portfolio while not entirely abandoning “consideration” of ESG factors that are “financially material.”

The advisor to ONEFUND, an S&P 500 index fund? Effective immediately, the adviser’s name has changed from ONEFUND, LLC to CYBER HORNET ETFS. Presumably from Michael Saylor’s feverish, “Bitcoin is a swarm of cyber hornets serving the goddess of wisdom.” And presumably, they’re staking their future on their second fund, the CYBER HORNET S&P500 Bitcoin 75/25 Strategy ETF.

Effective May 1, 2025, Roundhill Small Cap 0DTE Covered Call Strategy ETF will be renamed Roundhill Russell 2000 0DTE Covered Call Strategy ETF.

The Schwab Value Advantage Money Fund has been renamed the Schwab Prime Advantage Money Fund. All other aspects of the fund remain the same. (Thanks, Don G.!)

Effective April 4, 2025, the WisdomTree PutWrite Strategy Fund (PUTW) changed its name (now, the WisdomTree Equity Premium Income Fund), principal investment strategies, and ticker symbol.

On June 26, 2025, (a) Chip and I will be in Sweden, and (b) the WisdomTree Japan Hedged SmallCap Equity Fund will become the WisdomTree Japan Opportunities Fund. But wait! There’s more. It’s going to be an index fund with a very distinctive index. Among the new fund’s other quirks are the following allocation bands:

0-45% of the Index will be allocated to securities of Japanese companies that are strategic holdings of Berkshire Hathaway Inc.

15-33% of the Index will be allocated to securities of Japanese companies that provide a high “total shareholder yield”

15-33% of the Index will be allocated to securities of Japanese companies that have a low valuation ratio but favorable earnings and dividend growth characteristics.

15-33% of the Index will be allocated to securities of companies that have exposures to thematic opportunities from developments in the geopolitical space, technology trends, and macroeconomic conditions. Within this latter category, 25-50% of the stocks will be companies positioned “to benefit from geopolitical considerations,” 5-25% from central bank movements, and 5-25% from cool new tech.

Off to the Dustbin of History

The Defiance Hotel, Airline, and Cruise ETF and Defiance Next Gen H2 ETF were closed and liquidated on April 29, 2025.

On April 25, 2025, Foundry Partners Small Cap Value Fund merged with North Square Small Cap Value Fund.

On May 9, 2025, the Gotham Enhanced 500 Plus Fund and Gotham Hedged Core Fund merged with and into the Gotham Index Plus Fund.

Effective April 11, 2025, the Hartford Schroders Sustainable International Core Fund was liquidated.

On April 17, 2025, the Mast Global Battery Recycling & Production ETF was shut down.

The Neuberger Berman International Small Cap Fund will experience termination and liquidation on or about May 28, 2025. (sigh. That means it will miss my birthday party again this year.)

On April 29, 2025, the Ramirez Government Money Market Fund was liquidated.

On May 16, 2025, the Range Global LNG Ecosystem Index ETF will be liquidated.

Sprucegrove International Equity Fund was liquidated on May 1, 2025.

On or about May 30, 2025, the Tuttle Capital Self Defense Index ETF (not the silliest of the advisor’s offerings, IMHO) will be liquidated, terminated, and otherwise struck defenseless.