Monthly Archives: July 2025

MFO Premium 2025 Mid-Year Review Webinar

By Charles Boccadoro

On Thursday, 3 July, at 11 a.m. Pacific (2 p.m. Eastern), we will be conducting our mid-year webinar to review funds and MFO Premium. If you can make it, please join us by registering here.

We will use MultiSearch ANALYTICS link, Pre-Set Screens, and other custom criteria to review fund performance in 2025. MultiSeach is the site’s main tool, enabling searches with numerous screening criteria. We will also demo some of the many features across the site.

Significant upgrades this year include:

  • Automated evening fund flow downloads from Lipper enabling Daily FLOW Updates.
  • Worked with Allan Jardine, creator of DataTables, which drives our search engine, to improve the speed to manipulate very large tables, like MultiSearch (e.g, over 600 columns and 20 rows). Test case improved from 50 seconds to under 1 second!

MFO Premium includes the following range of search tools, several with free access (linked and emboldened below) for the MFO community:

The site also enables the following analyses:

  • Charts
  • Flows
  • Compare
  • Correlation
  • Rolling Averages
  • Trend
  • Ferguson Metrics
  • Calendar Year and Period Performance

A screenshot of the various tools can be found on the home page.

July 1, 2025

By David Snowball

Dear friends,

Welcome to the “Midsommar in Scandinavia” issue of the Mutual Fund Observer. Chip and I are enjoying a long-planned holiday in Sweden and Norway. We’re equally delighted that you’re here … and we’re there!

In this month’s Observer…

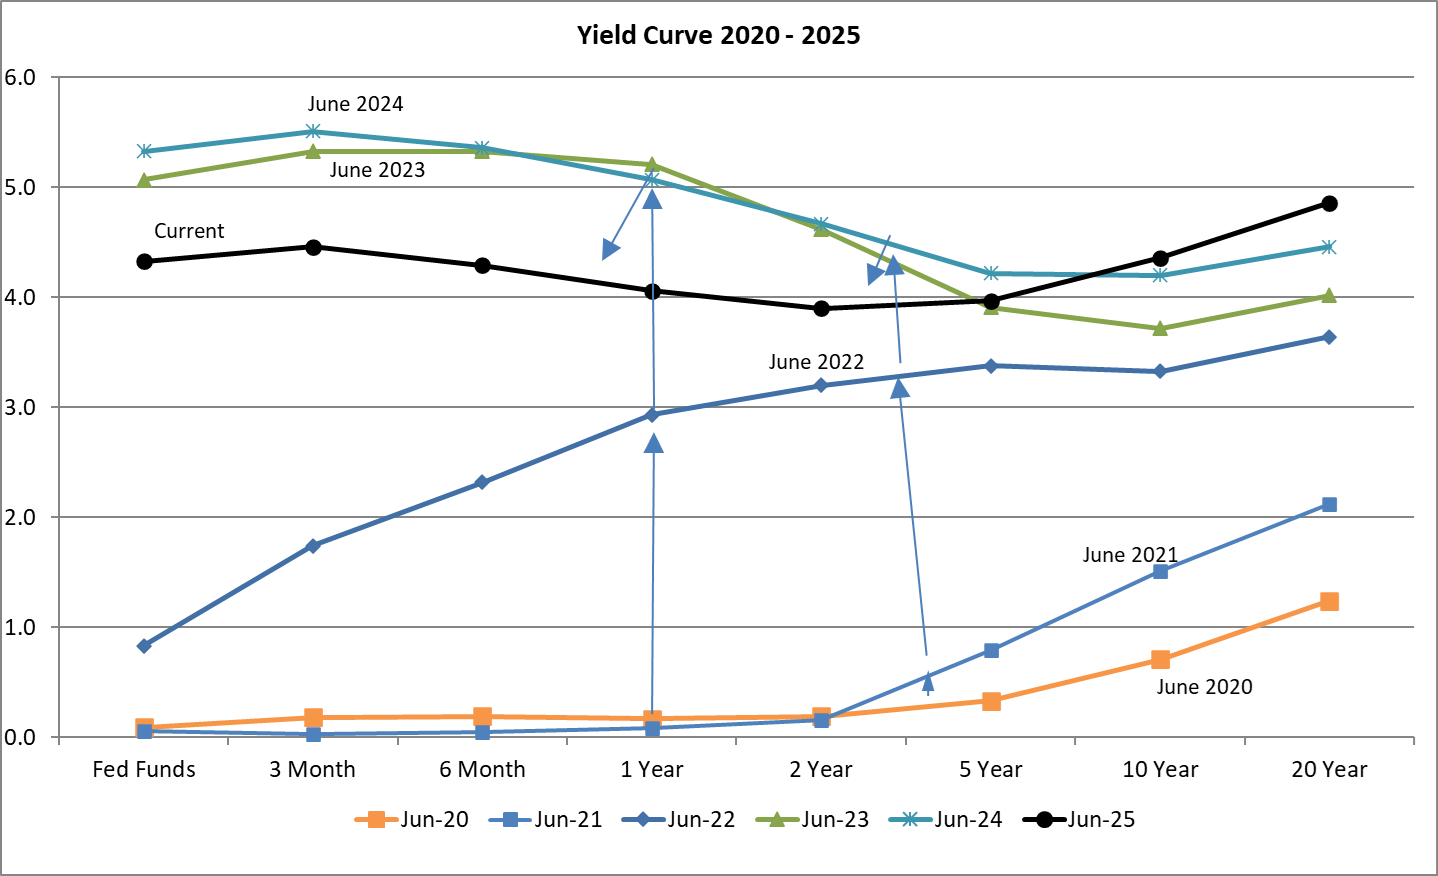
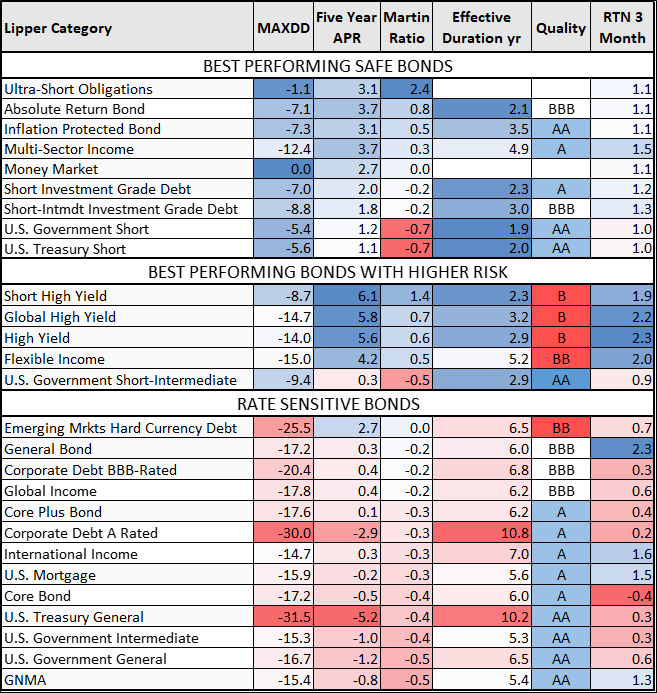
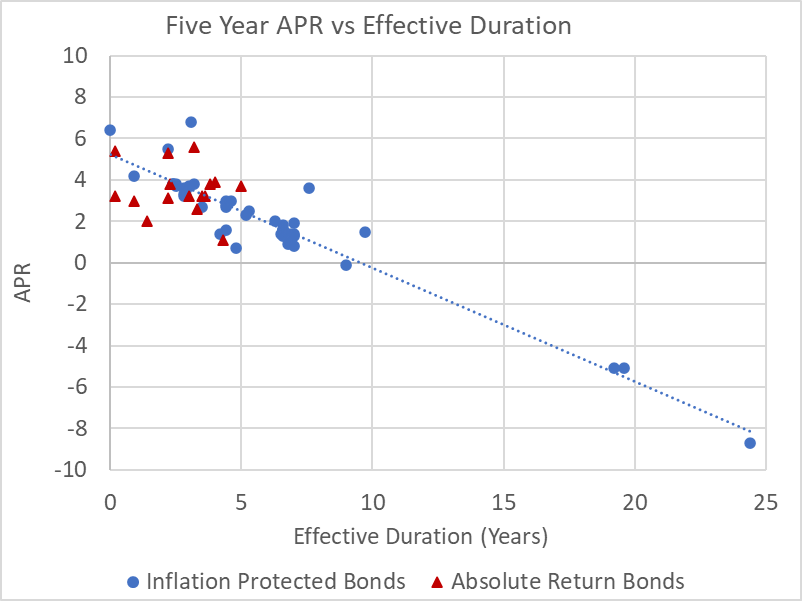
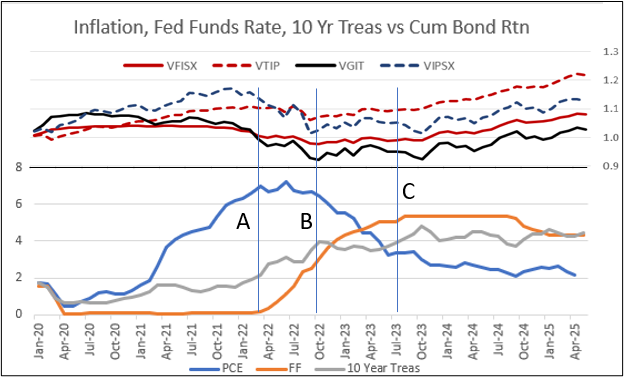
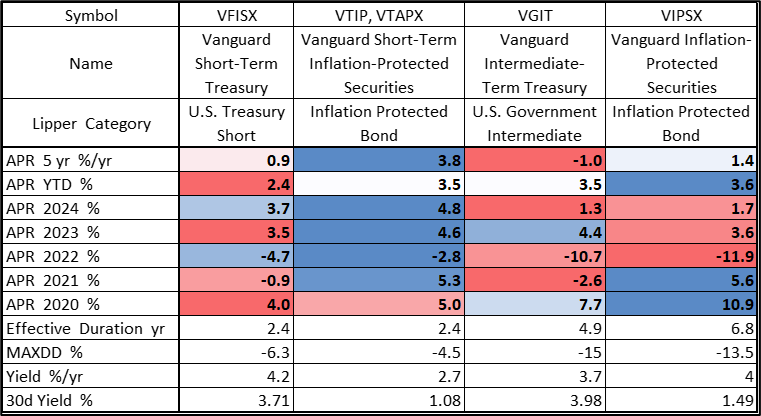
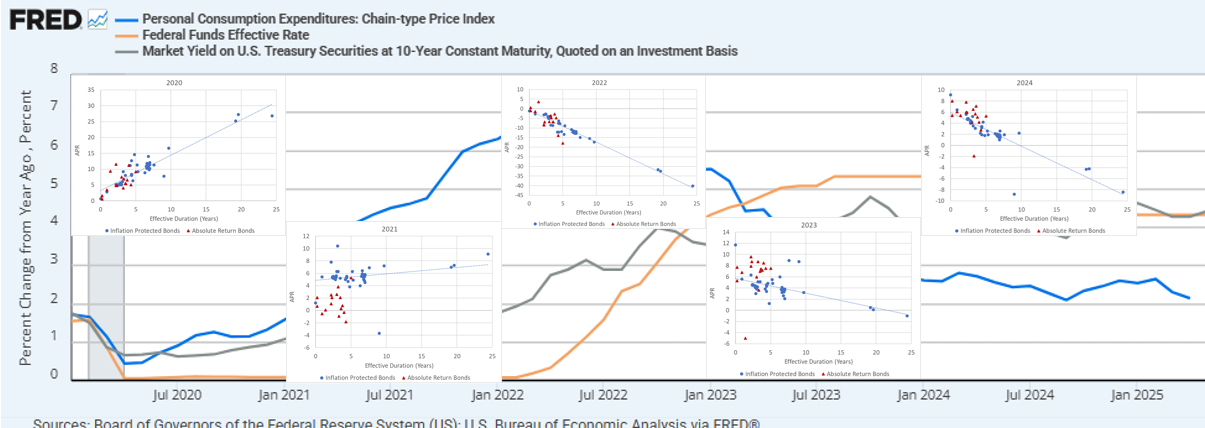
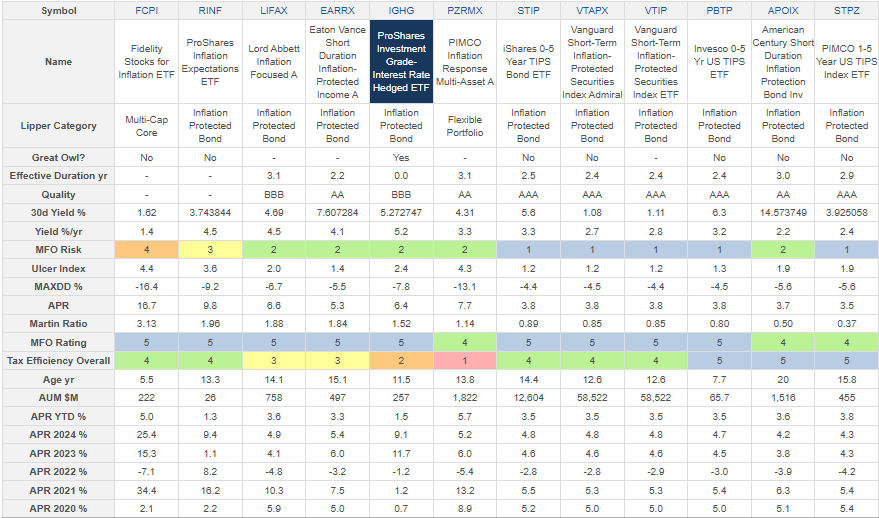
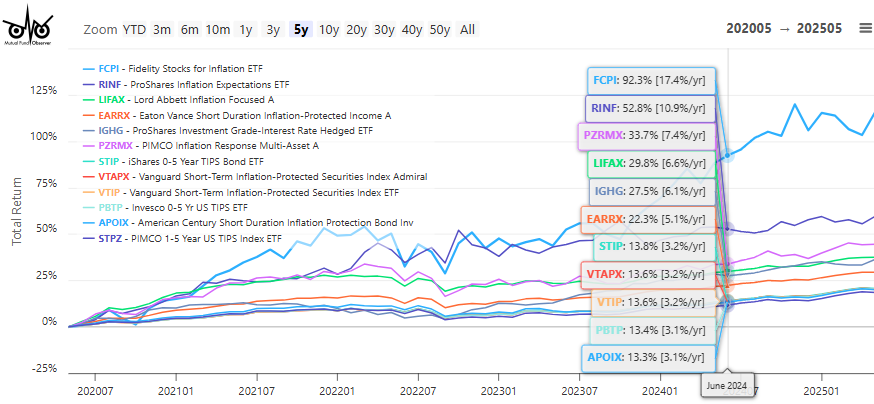
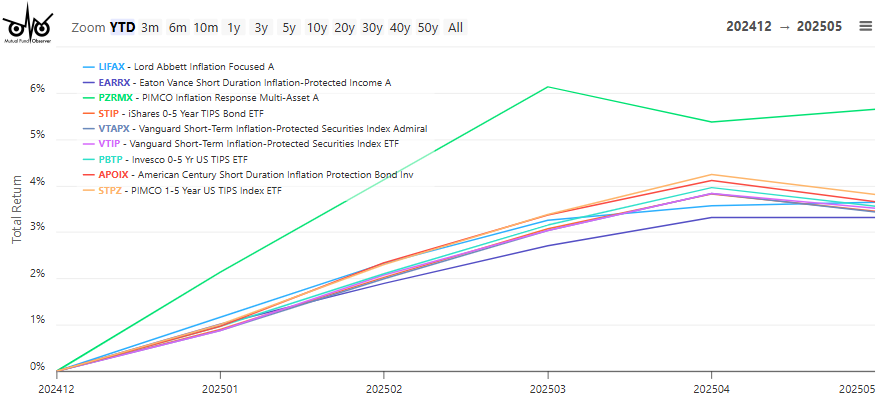
Among other things (how would I know for sure? I’m in Gamla Stan), Lynn Bolin addresses the emerging threat of tariff-induced inflation with “Protecting Against Tariff Induced Inflation,” analyzing how widespread tariffs will likely be passed through to consumers and drive inflation to an estimated 3.4% peak next quarter. Drawing on five years of post-pandemic bond performance data, he demonstrates that shorter-duration and inflation-protected securities have significantly outperformed traditional intermediate-term bonds, leading him to rotate into funds like Vanguard Short-Term Inflation-Protected Securities Index (VTAPX), Fidelity Inflation-Protected Bond Index Fund (FIPDX), and PIMCO Inflation Response Multi-Asset Fund (PZRMX). Bolin has reduced his stock allocation from 65% to 50% and now maintains approximately 7% of his bond allocation in inflation-protected securities, with another 40% in shorter-duration bonds, while also incorporating target-maturity TIPS ETFs like iShares iBonds Oct 2030 Term Tips ETF (IBIG) into his bond ladders.

America’s premier Asian investment boutique, Matthews Asia, has fallen on hard times. Former CEO and portfolio manager Mark Headley has returned from retirement, intent on fixing that. Our hour-long interview is summarized in “Good Bones There.”

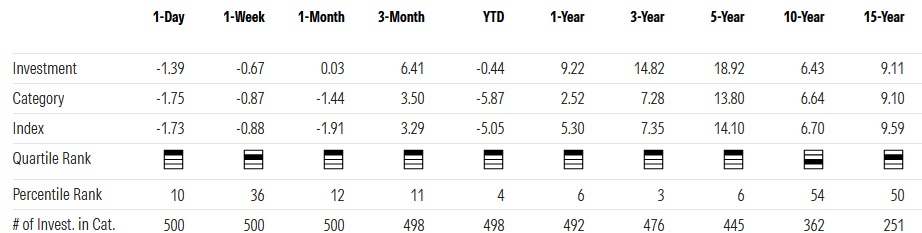
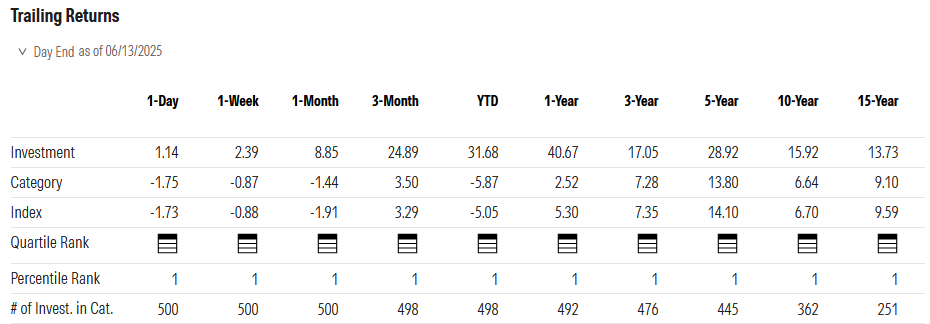
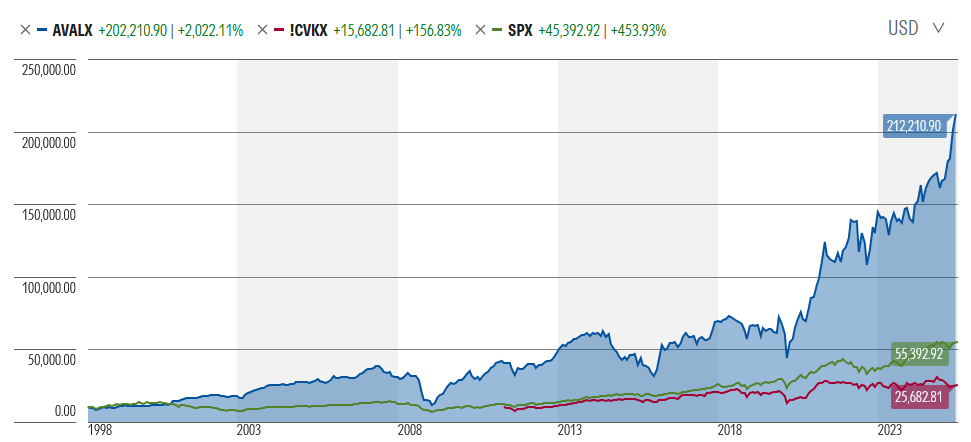
Without any doubt, the most successful small-cap value fund in existence is Scott Barbee’s Aegis Value Fund.  We last shared a full profile of the fund in 2013, but it has appeared in eight data-driven articles since then. We decided it was high time to catch up with Mr. Barbee and correct our oversight in a profile of Aegis Value Fund (AVALX).

Three years ago, in the midst of a market meltdown (do you even recall the ’22 crash now), we offered advice on how to cope with a … ummm “spanked portfolio.” The whimsical accompanying graphic generated a surprising amount of site traffic. This month, we offer a three-year retrospective on our 2022 advice: keep calm and consider small-value funds with high-quality portfolios. The performance numbers seem promising.

We also share a Launch Alert for Stewart Investors Worldwide Leaders Fund, the US launch of a successful non-US strategy focusing on a concentrated portfolio of high-quality, sustainable businesses. The launch was seeded by a US foundation, so the initial share class is institution with retail in the pipeline!

Bubbling just below the surface

Hedge funds are shifting to AsiaGoldman Sachs reports that hedge fund trading in Asian markets have a five-year high in June. “Hedge funds bought equities in Japan, Hong Kong, Taiwan and India last week, but were short selling onshore Chinese stocks,” Goldman said.

Family offices are shifting to infrastructure and private debt. A BlackRock survey of 175 family offices, the investment manager for ultra-wealthy families, reports that one-third were planning to increase exposure to private debt this year and 30% were planning to commit more resources to infrastructure investments.

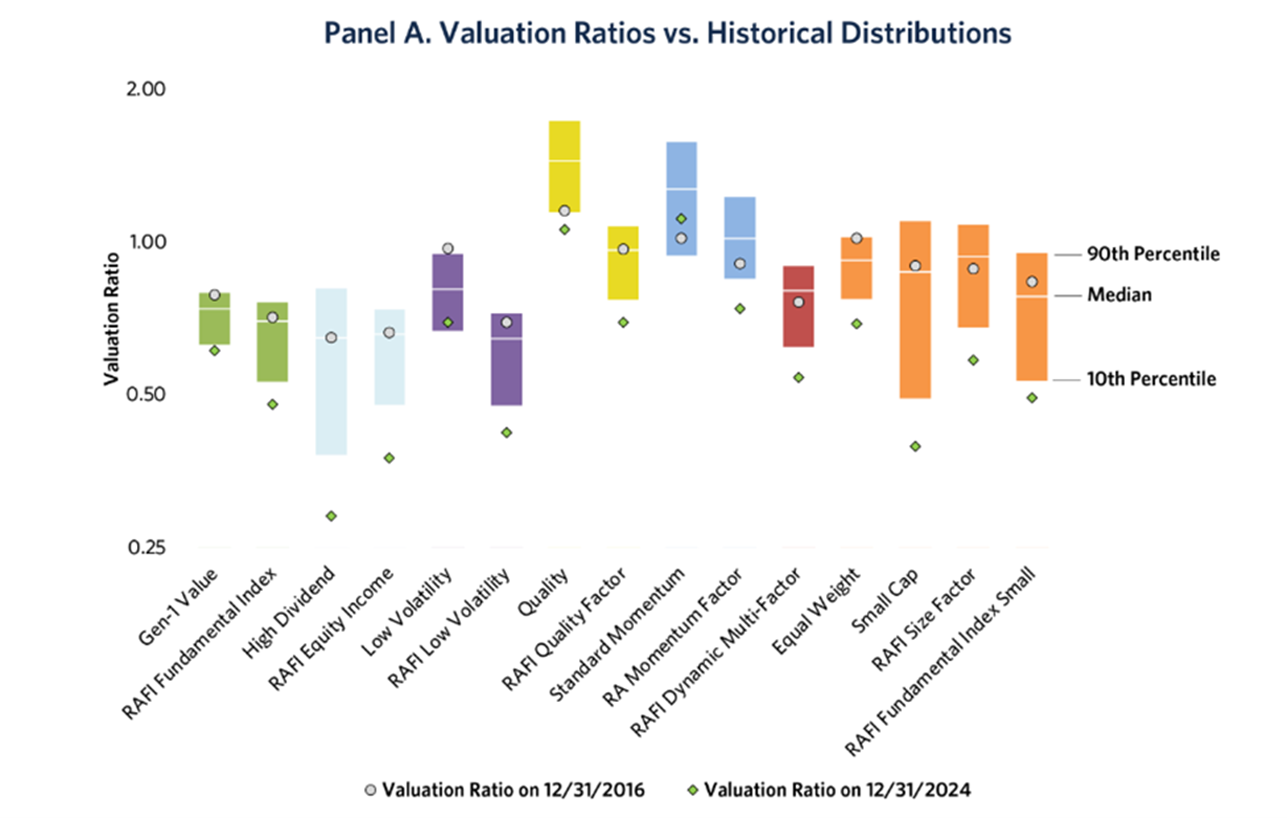
Almost every smart beta (e.g., low volatility or fundamental valuation) strategy has failed to produce, according to new research from Research Affiliates (free registration required). The short version: RA has been tracking the performance of a series of factor-based portfolios since 2018, looking to see whether any provided the promised excess return.

They did not. In every case, just investing in “the market” was a better bet.

The good news: “the market” – defined by its large / growth / momentum subset, is now so egregiously overpriced that almost everything outside of that niche is dramatically underpriced.

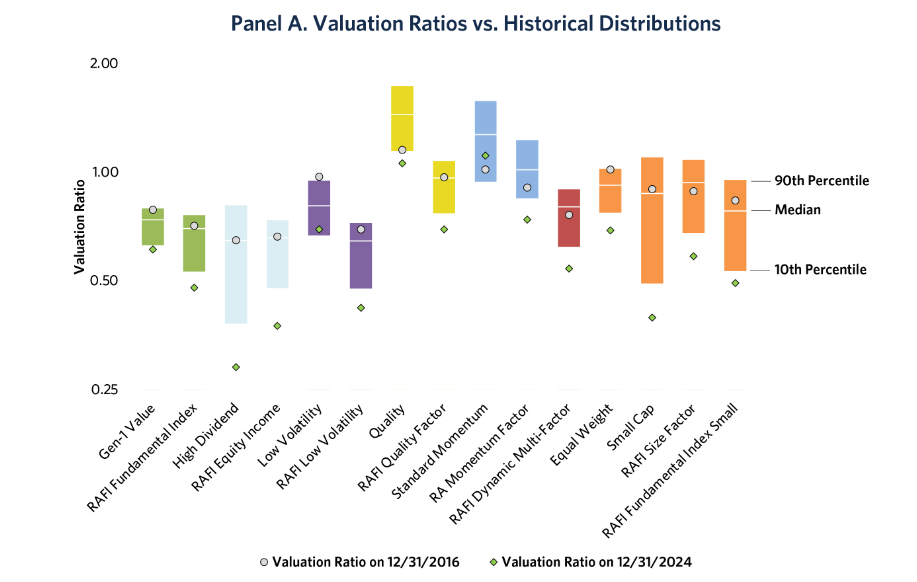
Source: Research Affiliates, 06/2025

The way to read that chart is to start by finding the little green diamonds. Those are the more-or-less current valuations of each strategy relative to its historic valuations. Green diamonds below the colored bar, which illustrates the historic range from 10th percentile to 90th, signals that the strategy is now cheaper than it has been 90% or 95% of the time.

RA concludes that’s good news since valuation matters:

… we believe there may be hope for all smart beta strategies. If markets receive a wake-up call and valuations revert, a multitude of systematic factor-based equity strategies could all have a field day. After eight years of going horribly wrong, smart beta investing may now go horribly right.

AI is a lot dumber than we thought. A series of research reports, most recently from Apple, argue that while AI can execute certain tasks exceptionally well, reasoning is not among them. The researchers found that in simple reasoning tasks, including the Towers of Hanoi challenge, AIs underperform 7-year-olds. Their central argument is that even the most advanced LLMs do not think in any way that resembles us. Their conclusion is that AI “thinking” is not just different, it’s horrible. (Gary Marcus, “A Knockout Blow for LLMs? LLM ‘reasoning’ is so cooked, they turned my name into a verb,” Communications of the ACM, 6/16/2025).

Source: Amazon.com

As the complexity of demands rises, moving AI beyond its comfort zone, so does the frequency of hallucinations. One estimate is that 79% of responses from some of the newer AI contain hallucinated content (“A.I. Is Getting More Powerful, but Its Hallucinations Are Getting Worse,” New York Times, 5/6/2025, subscription required).

A coda to that argument: ChatGPT just lost a chess match to an Atari 2600. If you’re, oh, under 50, you can be forgiven for the question “WTF is an Atari?” because the 2600 is a home video game console released in 1977. ChatGPT actually volunteered to play the old game system. Oops. One report of the match contained this summary:

In fact, the Atari wiped the floor with ChatGPT when it came to chess. I don’t mean the near-half-century-old game console won. I mean that ChatGPT made blunders that would embarrass the greenest of beginners.

On the upside, perhaps it thinks it won? “So I said ‘here, hold ma beer an’ gimme a knight an’ I kicked its little Atari keester all the way to …’”.

AI is dirtier than we thought. Not “smutty dirt” (though that’s nice, too) but “energy- and water-gulping dirty.” MIT researchers found two troubling trends: AI data centers use more power and more power derived from fossil fuels than “normal” data centers:

… more than half of the electricity going to data centers will be used for AI. At that point, AI alone could consume as much electricity annually as 22% of all US households. Meanwhile, data centers are expected to continue trending toward using dirtier, more carbon-intensive forms of energy (like gas) to fill immediate needs, leaving clouds of emissions in their wake. (“We did the math on AI’s energy footprint. Here’s the story you haven’t heard,” MIT Technology Review, 6/2025)

Part of the challenge is that AI companies seem desperately concerned with obscuring the magnitude of their energy and water use, which some suspect sounds like a guilty conscience at work.

AI users are stupider than we thought. Folks have casually and constantly observed the tendency of people to be lazy, turning to AI to do their work and thoughtlessly passing it along as their own. The underlying phenomenon is called “cognitive offloading.” It’s driven by two biological imperatives: humans have a limited supply of energy each day and thinking requires a lot of energy. Our survival response is to think as little as necessary to get through the day. The polite term for us is “cognitive misers.” We rely on tricks, shortcuts, and habits – none of which require much energy – to muddle through. But we also offload tasks – we delegate – whenever possible. As a quick test, how many telephone numbers can you recite off the top of your head? (No, 9-1-1 doesn’t count.) When I was young, the answer was probably “dozens.” Today, it’s probably two or three (my own, Chip’s, and my son’s). I count on my phone to keep track of the rest. That’s cognitive offloading.

A second set of MIT researchers, the Brain on Large Language Models team, has been doing fairly rigorous research on how our brains respond to the availability of AI/LLMs as an offloading option. (Spoiler alert: not well.) Most recently, they gave three groups of students the same task. One group had access to ChatGPT, one had access to Google, and the other had to think for themselves. (Yikes.) The study ran over four months and included both brain activity monitors and direct observation. Their findings:

Brain connectivity systematically scaled down with the amount of external support: the Brain‑only group exhibited the strongest, widest‑ranging networks, Search Engine group showed intermediate engagement, and LLM assistance elicited the weakest overall coupling … The reported ownership of LLM group’s essays in the interviews was low. The Search Engine group had strong ownership, but lesser than the Brain-only group. The LLM group also fell behind in their ability to quote from the essays they wrote just minutes prior. (Your Brain on ChatGPT, 6/2025)

The short version: the brains of Chat-dependent students literally powered down and while the students nominally completed the work themselves, they had little belief in their own written conclusions and couldn’t quite remember what they’d just said.

Rather as we can’t quite remember our sibling’s phone number five minutes after we called them.

Job opening: Best billionaire friend

The White House apparently has an opening for a new Best Billionaire Friend (BBF) after a spectacular fallout between Mr. Trump and the previous holder of the position, Mr. Musk. Mr. Musk, who invested heavily in Mr. Trump’s election campaign, left government service, such as it was, denounced Mr. Trump’s signature legislative package as “a disgusting abomination” and endorsed a call for Mr. Trump’s impeachment. He nonetheless affirmed his “love for the guy.”

Two of Mr. Musk’s associates attribute the fallout to Mr. Trump’s failure to give Musk and Tesla favorable treatment under the bill. “Elon was butthurt,” according to one source. Musk threatened to decommission his fleet of Dragon spacecraft. Trump threatened to “terminate Elon’s Government Subsidies and Contracts” and to investigate his business practices. Musk caved.

We’ve written a fair amount about the history and enduring psychology of these alliances (“If you’re so rich, why aren’t you smart?” LinkedIn, 4/2025).

Two things to remember:

  1. This is not aberrant behavior; it’s a perfectly predictable sequence of events driven by well-documented psychological research (it is exceedingly difficult to amass vast wealth with the presence of high risk tolerance and indifference to negative externalities) and repeated endlessly over the course of the past 125 years. The ultra-rich cozy up to authoritarian rules, hoping to trade support for future wealth. It goes poorly.
  2. This needs to be an important filter for investors, everyday and professional alike. Recent headlines begin with “Bill Ackman says …” or “Five places billionaires are putting their money” should raise your shields, not your hopes. With vast respect for Mr. Ackman’s acumen at making himself very, very rich, neither his political preferences nor his investment activities ought to guide your thinking. They are manifestations of his world and interests, not yours.

Fortunately, the BBF position is likely to be swiftly filled. UBS reports (6/2025) that there are now 31 people with wealth in excess of $50 billion dollars.

Queue forms to the right!

Thanks …

To all of the folks helping to make our Scandinavian sojourn amazing!

We asked, you answered!

Thanks so much to all the folks who shared good wishes and travel advice for our upcoming Scandinavian adventure: Stuart, Leah, Marjorie, DGH, and Roger. Thank you, thank you!

Stuart: the Vasa Museum is one of our must-see sites! Gotland and Stumholmen are saved for our next trip.

Leah: thanks for the sweater advice – we’re setting aside a budget for Bergen. And Chip might be booking a table at Bryggen Tracteursted as I write.

DGH: Pending good weather, the Norse Folkemuseum and time to wander around Bygdøy are on the itinerary. Also, do we like cinnamon rolls? “Like” is such an understatement. WB Samson, got it!

Roger: We are doing the Norway in a Nutshell with an overnight in Flåm. Since you and Leah both made note of the hiking/walking opportunities, we’ll see what we can fit in. We also have Frogner Park on the list!

And, many thanks, always, to the steady contributors who help us keep the lights on and our spirits up: the good folks at S&F Investment Advisors, Wilson, Greg, William, William, Stephen, Brian, David, Doug, and Altaf. We’ll totally Fika with you ASAP!

We’ll see you in August and share the adventure!

david's signature

Protecting Against Tariff Induced Inflation

By Charles Lynn Bolin

The US Treasury first implemented Inflation-Protected Bonds (TIPS) in 1997, and they now make up about 7% of the Treasury market.  Since then, inflation has rarely gone above 3% until 2021. Tariffs (customs duties) began surging in 2018, and President Trump is now implementing widespread tariffs. With retailers having low profit margins, these tariffs will mostly be passed on a tax on consumers. This article represents my research on how to invest the bond portion of a portfolio to reduce volatility and prepare for higher inflation.

Inflation Forecasts

Inflation by various measures has fallen below 2.3%. Tariff increases were announced on April 2nd, and it takes time for products with the additional tariffs to reach the shelves. The Fed – Monetary Policy: Beige Book describes prices increasing at a moderate pace. The report says, “All District reports indicated that higher tariff rates were putting upward pressure on costs and prices.”

The Philadelphia Federal Reserve Second Quarter 2025 Survey of Professional Forecasters shows that economists estimate that inflation will peak at 3.4% next quarter and decline to 2.5% in 2026 and 2.1% in 2027. The Organisation for Economic Co-operation and Development released its OECD Economic Outlook, Volume 2025 Issue 1, with estimates that inflation in the US will average 3.2% in 2025 and 2.8% in 2026. In “2025 Economy Watch”, The Conference Board estimated that inflation would average 2.9% in 2025 and 3.0% in 2026. The International Monetary Fund database estimates that consumer prices in the US will be 3.0% in 2025, 2.5% in 2026, and 2.1% in 2027.

In spite of these noble efforts to estimate inflation, there is too much uncertainty in policy and too many unknowns regarding geopolitical risk and supply chain disruptions to have a reliable forecast. Following the escalation of the Israeli-Iran conflict in June, oil prices rose 22% from a low of $60 to $73 on June 15th.  Geopolitical risks and supply chain disruptions have the potential to exacerbate tariff-induced inflation. I expect moderate rises in inflation in a slowing economy with the Federal Reserve lowering rates toward the end of the year.

Post-Pandemic Five-Year Return

During the past five years, the US has experienced the COVID pandemic, massive stimulus, ensuing inflation, and rapid monetary tightening. As shown in Figure #1, the yield curve has responded with the entire curve normalizing by June 2022. In 2023 and 2024, the short end of the curve rose and portions of the curve inverted as the Federal Reserve raised rates to fight inflation. Today, the short end of the curve is falling as the economy slows and investors anticipate lower rates, and the long end remains high, possibly impacted by the prospects of higher deficits.

Figure #1: Yield Curve June 2020 to June 2025

Source: Author Using St. Louis Federal Reserve FRED database

Now, as tariffs take effect amidst rising geopolitical risk, we can anticipate a resurgence of inflation to some extent. Let’s take a 30,000-foot-high level look at bond performance over the past five years. It should be no surprise that bonds with shorter durations have done the best because those with longer durations have been battered by rising long-term rates.

Table #1 contains most of the Lipper Bond Categories divided into “safer”, “moderate risk”, and “rate sensitive” Lipper Categories. Over the past five years, high yield funds with shorter durations and Flexible Income funds were the best performing, followed by Ultra-Short Bond, Absolute Return Bond, and Inflation Protected Bond, and Multi-Sector Funds. These are the same bond categories that have performed the best over the past three months. The Lipper Category of Inflation Protected Bonds is not segregated by duration which is the focus of the next section.

Table #1: Lipper Bond Category Performance – Five Years

Source: Author Using MFO Premium fund screener and Lipper global dataset.

Figure #2 shows the relationship between annualized percent return for the past five years and duration for inflation-protected bonds and absolute return bond funds.

Figure #2: Bond Performance Versus Effective Duration

Source: Author Using MFO Premium fund screener and Lipper global dataset.

I retired in 2022 and began using Financial Advisors at Fidelity and Vanguard about that time. They tend to rely on core and general bond funds, which over the long term have a low correlation to stocks. I manage the more conservative sub-portfolios of Traditional IRAs. To prepare for tariff-induced inflation, over the past nine months, I have increased allocations to ultra-short and short-term bond funds, absolute return bond funds, inflation-protected bond funds, and multi-sector funds.

The Great 2020 to 2025 Inflation Laboratory

The post-COVID pandemic time period provides an excellent opportunity to understand how inflation-protected bonds perform. The bottom half of the chart shows inflation as measured by the personal consumption expenditure index (year over year), the Federal funds rate, which is the Federal Reserve’s primary tool for slowing the economy to reduce inflation, and the 10-Year Treasury. The top half of the chart shows the cumulative returns of short-term government bonds (solid red line) and short-term Treasury inflation-protected bonds (dashed red line) compared to intermediate government bonds (solid black line) and intermediate-term Treasury inflation-protected bonds (dashed black line) performed.

Figure #3: Cumulative Bond Return vs Inflation and Yields

Source: Author Using St. Louis Federal Reserve FRED database and MFO Premium fund screener and Lipper global dataset.

Point A in the figure above is when the Federal Reserve began raising short-term rates (orange line). Point B is when inflation (blue line) began to fall and the rise in the 10-year Treasury rate (gray line) began to flatten. Point C is when the Federal Reserve stopped raising short-term rates.

The storyline is that intermediate inflation-protected bonds performed best prior to Point A, when inflation was rising, while intermediate government bonds began to perform poorly as intermediate rates began to climb. Up to point B, intermediate inflation-protected bonds began to perform poorly as inflation plateaued and intermediate rates continued to rise. Prior to Point C, both short- and intermediate-term inflation-protected bonds outperformed their nominal counterparts as inflation fell but remained above 2%, and rates stabilized. After Point C, short-term bonds, especially inflation-protected, outperformed as short-term rates fell and intermediate rates remain elevated. Short-term inflation-protected bonds continue to perform well in 2025.

Table #2: Bond Fund Performance By Year

Source: Author Using MFO Premium fund screener and Lipper global dataset.

Figure #4 shows all inflation-protected bonds (blue circle) and real return bonds (red triangle) by year overlain onto a chart of inflation (PCE YOY), Fed Funds rate, and 10-year Treasury rate. I favor the bonds with shorter durations at this time.

Figure #4: Bond Performance vs Effective Duration By Year

Source: Author Using St. Louis Federal Reserve FRED database and MFO Premium fund screener, and Lipper global dataset.

Imaginable Risks

What we saw in the previous section are inflation and interest rate risks. A recession was avoided. There are other risks that can impact performance. Slowing growth can lead to a recession or, worse yet, a recession with higher inflation is known as stagflation which presents problems for the Federal Reserve. Isolationism and trade wars can lead to supply chain disruptions, retaliatory tariffs, and even higher inflation. Economists that I follow agree that the budget proposal will lead to higher deficits and further increases in the national debt, which can lead to higher rates and slower growth. Equity valuations are high, which are tailwinds for domestic stocks.

For these reasons, I have taken precautions to reduce my stock-to-bond allocation from 65% to 50%, maintain bond ladders for around seven years, increase allocations to short-term bonds, and invest in funds to protect against inflation. I maintain a diversified global allocation to stocks and bonds.

Table #3 contains some of the high-performing funds that protect against inflation. They are sorted from the highest risk-adjusted return (Martin Ratio) on the left to the lowest on the right.

Table #3: Selected High-Performing Inflation-Protected Funds – Five Years

Source: Author Using MFO Premium fund screener and Lipper global dataset.

Figure #5: Selected High-Performing Inflation-Protected Funds – Five Years

Source: Author Using MFO Premium fund screener and Lipper global dataset.

Figure #6: Selected High Performing Inflation Protected Funds – YTD

Source: Author Using MFO Premium fund screener and Lipper global dataset.

My Strategy

Over the past several months, I have rotated from my worst-performing bond funds into inflation-protected bond funds and purchased the PIMCO Inflation Response Multi-Asset Fund (PZRMX) mentioned by David Snowball last month. I have bought mostly Vanguard Short-Term Inflation-Protected Securities Index (VTAPX, VTIP). I also bought Fidelity Inflation-Protected Bond Index Fund (FIPDX), which has a somewhat longer duration, and will monitor it for a possible sale if performance falls.

I became interested in adding Treasury Inflation-Protected Bonds to my bond ladders after reading, Retirement Planning Guidebook by Wade Pfau, among other books. He explains that TIPS outperform treasuries when inflation exceeds the implied break-even inflation rate. I created Figure #7 to show various breakeven inflation rates and inflation (PCE). I expect inflation to rise to close to 3.5% over the next year or two, while the breakeven rate is currently 2.3%.

Figure #7: Inflation Breakeven Rates and PCE Price Index (YOY)

Source: Author Using St. Louis Federal Reserve FRED database

As I wrote, in the Mutual Fund Observer March newsletter, ETF Bond Ladders, I am interested in using ETFs designed for bond ladders. Kim Clark describes Blackrock’s inflation-protected bond ETF with target maturities in These New TIPS ETFs Make It Easier To Build A Bond Ladder at Kiplinger. I bought iShares iBonds Oct 2030 Term Tips ETF (IBIG) to add to the 2030 rung on my bond ladder. The effective duration is 4.7 years, which gets shorter over time.

Closing

I now have approximately 7% of my bonds invested in inflation-protected bonds, including PIMCO Inflation Response Multi-Asset Fund (PZRMX). Another 40% is invested in bond funds with shorter durations. Next month, I will reevaluate inflation and geopolitical risk and make small adjustments if appropriate. I also have the 2025 rung in my bond ladder maturing in a few months, and need to determine where to reinvest the funds.

Mark Headley, once and again CEO: “there’s good bones there”

By David Snowball

Matthews Asia is navigating a challenging period. Founded 30 years ago by Paul Matthews, the firm achieved a rare trifecta: consistently outstanding risk-sensitive returns across the entire fund family, outstanding success, such as the once $60 million AUM firm touched the $36 billion mark, and enormous professional respect as the country’s premier Asian investing specialist with a robust internal culture and deep bench.

The Matthews Asia of 2025 feels a long way from that success.

Assets have plummeted from $36 billion to $6 billion. Performance is mixed at best, with only three or four of 12 funds having above-average or higher risk-adjusted returns over the past 5- or 10-year periods. Something like half of the investment team has left the firm, some walking away and some pushed out. One of Morningstar’s most senior analysts, William Samuel Rocco, crystallized the concern:

The firm has suffered from extreme personnel turnover throughout the 2020s, and it has lost 15 members of its investment team during the past two years, including a former CIO/portfolio manager and other key individuals. The firm has hired Sean Taylor as a CIO/portfolio manager and added another portfolio manager in the past two years. There are now 18 individuals…on the investment team…But there were 31 individuals on the investment team in mid-2023 and 38 in 2020. Moreover, Cooper Abbott left the firm in April 2025, less than three years after joining the firm as CEO.

Matthews has replaced Abbott with Mark Headley, who had ample success [in several roles at Matthews before his retirement]. But Headley, Taylor, and their colleagues have daunting challenges to address. Most of the firm’s strategies have posted mixed, or worse, returns in recent years, and investors have pulled assets away.

We spoke with Mark Headley in June 2025. When asked about the suggestion that Matthews had lost its way, his response [I’m paraphrasing here] was: “Yep, pretty much.”

In an hour-long conversation, we pursued two questions with Mr. Headley: (1) what went wrong? and (2) is it fixable? The shortest [still paraphrased] version of his answers: (1) We screwed up our internal culture to the extent that it stopped producing good results and (2) I’m pretty sure we can. “There are still good bones there.” We’ll know within three years.

What happened to Matthews’ culture? There were two changes, complicated by a third factor.

Change one: they got too big and perhaps got a bit full of themselves. In the mid-2010s, everything worked: money was pouring in, performance was perking along, funds grew, the team grew, and salaries grew. But somewhere in there, identity was lost. By Mr. Headley’s estimation, a 40-person investment team is not “a team,” it is at best a bunch of talented, competitive people occupying the same space. They were a collection of teams, not a single team, and that made a huge difference. Collaboration reduced, cooperation fell, silos arose, and teams saw themselves in competition with one another for resources and attention. The whole became weaker than its individual parts.

Change two: leadership stopped leading. Building and sustaining cultures is hard. It takes a very distinctive set of skills to pull it off: a mindset that loves challenge and is willing to challenge others, a mindset that asks “where do we need to be in five years and what do I need to do this week to move us in that direction?” (If you ever wonder about the fundamental flaw in Karl Marx’s thinking, this is it. He never valued the intellectual work of “the capitalist class,” who organized, strategized, and supported “the working class.” He saw anyone collecting a paycheck but not working on the factory floor as dead weight. They are not.) Arguably the leadership became more laissez-faire, hiring talented people but not taking responsibility for their growth, not holding them responsible for their actions (for example, not calling out a triple-digit turnover ratio in a buy-and-hold portfolio) and not considering the entire range of skills required (including communication skills and the ability to get people excited about the strategy) in their personnel decisions. The retreat into silos meant that the teams, and the leadership, no longer took time to assess the macro-level forces shifting the entire world.

The influence of investment professionals waned as portfolio managers retreated into silos, and the influence of sales and marketing grew. That’s rarely a good thing since the understandable impulse of a sales team is to produce more of whatever is currently sellable.

The wild card factor: Xi Jinping upset all of the leadership’s earlier assumptions. The firm always counted on China, however flawed that now seems, to move steadily and relentlessly toward becoming a rational economic actor. Mr. Xi, instead, reasserted greater centralized control. Those developments weakened the case for “Asia” as a distinct asset class. Rather than a distinct global driver, investors began thinking of Asia as just one part of the emerging markets puzzle. Assets then shifted from Asia-centered funds to those with broader mandates.

Can Mr. Headley fix it? He thinks so. His simplest metric: if Matthews can reach around $12 billion AUM within three years, they’ve won.

Mr. Headley starts with a different perspective than most. He does not want to return to the glory days. He does not want 35 or 40 portfolio managers in the building. He does not want a steady stream of new “products”. He does not want $36 billion in assets. He does not believe that any of those are sustainable states for a mission-centered boutique manager.

More sustainable: $10-12 billion in assets, 20 or so investment professionals, a willingness to see Asia in its larger context, and perhaps fewer funds than they manage now. Also important is to bring stability back to its investment team, led by Sean Taylor, who has over 30 years of experience in emerging markets, or, where necessary, bring in some new talent.

His plan, so far as I understand it, is (1) to look at everything with fresh eyes and (2) to rebuild a winning culture. The “look at” part includes an assessment of what works, and what’s been limping along, what’s central and what’s merely a niche, and, most importantly, who they can build around. That is, who on the staff has the entrepreneurial mindset, passion, and communication abilities that will allow them to champion their own strategies and, eventually, to lead the firm.

The “rebuild” part comes down to teaching portfolio managers that failure is inevitable and not shameful; you shouldn’t hide it, you need to learn from it. In part, that requires owning up, talking through, and strategizing. All of which is some combination of alien and scary. Part of Mr. Headley’s job is to make it normal again. Part of the cultural rebuild is re-engaging with macro factors, allowing a top-down vision that complements bottom-up security selection. Without the top-down, a manager risks developing an obsession with picking up pennies in dark alleys. Finally, people need to be held accountable for their decisions.

Bottom line

I agree with Mr. Headley, “there remain good bones in there.” We came away from our interview with several strong impressions. First, Mr. Headley is very smart, very confident, and very competitive. Winning is in his DNA. Second, Mr. Headley did it before, helping guide a $60 million firm to become a $30 billion one. Third, he’s willing to ruffle feathers as the necessary price of improvement. He does not seem headstrong but does seem to have a clear sense of what success demands. He is betting that a vibrant internal culture and deep regional expertise – rather than index-hugging breadth – will win clients looking for long-term exposure to the world’s fastest-growing economies.

I would not bet against him.

More dirty sex and your spanked portfolio: A three-year review

By David Snowball

Many and many a year ago, in the kingdom of ABC, Woody Allen was one of my very first guests. And we consented to take questions from an eager audience of mostly young people. Like ourselves.

The questioner looked like a high school girl and shouted to Woody from the balcony, “Do you think sex is dirty?”

Allen: “It is if you do it right.” (Dick Cavett, “As the comics say, These kids today! I tell ya.” New York Times, 9/13/2013)

I’d rather hoped that the observation originated with someone rather more wholesome, Groucho Marx or Mae West, for example, but we’re stuck with what the historical record gives us.

Three years ago, in the midst of a substantial market correction (equity portfolios were down 20%, 60/40 portfolios down 16% – in just six months), we wrote “Dirty sex, your spanked portfolio and planning for the next market” (07/2022). For reasons unclear to Midwesterners like me, we had a short-lived spike in our Google search ratings that month. Odd, since the point of the article was modest:

  • First, we wanted to remind readers that corrections happen and are not a cause for portfolio upheaval
  • Second, we wanted to commend high-quality small caps as a potential source of gain in the next market.

The question is, how good was the advice? We’ll look at it in turn.

Corrections do not warrant panic.

How might you respond, we asked, to the current bout of painful bruising?

  1. If you have a well-designed strategic investment plan, do nothing.
  2. If your portfolio is an unplanned collage of things best described as “it seemed like a good idea at the time,” build a plan before executing the plan.
  3. If your portfolio is taxable, start identifying the cost basis of your shares.

From that date to this, “calm” was a profitable strategy. Here are the three-year returns from 10 Vanguard index funds representing major asset classes:

Vanguard 500 US large core 18.5%
Total Stock Market US large core 17.8%
Extended Market Index Mid- to small cap 13.6%
Small Cap Index US small core 10.6%
     
Vanguard International Core Stock Int’l large core 14.8%
Vanguard EM Stock Index Diversified EM 8.6%
     
Balanced Index Moderate 60/40 allocation 11.8%
Total International Bond Index Global bond – USD Hedged 3.9%
Total Bond Market Index Intermediate core bond 2.7%
Short-Term Bond Index Short-term bonds (duh) 3.7%

Source: Morningstar.com, 6/14/2025

The short version: an indolent investor with typical equity exposure, 60% seems the default, easily booked double-digit returns despite two crises (2022 and spring 2025) and, as a bonus, had time to read a good book or three (or to organize a pro-democracy protest, but that’s a separate tale).

Small and quality are worthy focuses

We wrote: “Reasonable commentators – from T Rowe Price and Leuthold to GMO and Warren Buffett – have argued that your greatest returns now might come from focusing on undervalued, high-quality companies that are growing dividends and are grounded in real assets. At a time when there are historic discounts for small vs large, value vs growth, and quality vs momentum, we asked the folks at Morningstar to look at which small-cap value funds had the highest quality portfolios.”

Small, quality, and value seemed to align with the recommendations of serious adults. Surprisingly, it also aligns with total returns over the past five years.

5-year performance by style box, as of 6/13/2025

Small-value won? Bet you didn’t see that coming! The past five years saw three major market dislocations (Covid, 2022’s inflation panic, and the spring 2025 tariff panic) and pretty uniformly double-digit returns. (The estimable Bill Bernstein, a self-described asset class junkie, once described small-growth as “a failed asset class” because they’re volatile, structurally overpriced and do not pay a risk premium for it.)

Morningstar ranked 160 portfolios from highest quality to lowest. Morningstar measures “quality” by assessing “the profitability and financial leverage of a company, based on an equally weighted mix of trailing 12-month return on equity and debt/capital ratios.” The table below includes the 11 funds considered small-cap value by Morningstar with the highest quality portfolios. (Why 11 and not 10? There was a tie.) This table is sorted by their 2022 portfolio quality, with Royce Special having the highest quality portfolio of the 160 Morningstar assessed, Auer second, and so on.

 Here’s how they have performed since then, relative to their category averages.

Quality small caps, three-year performance, sort by portfolio quality

    Category APR

APR
vs  Peer

APR  Rating Ulcer  Rating DSDEV  Rating Bear  Market  Rating MFO  Rating Sharpe  Rating
Royce Small-Cap Special Equity RYSEX SCV 2.5 -1.6 2 1 1 2 2 2
Auer Growth AUERX SCC 9.4 4.3 5 1 4 7 5 5
Pacer US Small Cap Cash ETF CALF SCC 1.3 -3.9 1 5 5 8 1 1
Acquirers Small and Micro Deep Value ETF DEEP SCV 1.0 -3.1 1 4 3 7 2 2
Aegis Value AVALX SCV 13.2 9.2 5 1 3 8 5 5
Hartford Multifactor Small Cap ETF ROSC SCC 5.6 0.4 3 2 2 5 3 3
Royce SCV RYVFX SCC 6.1 0.9 4 3 3 6 3 4
James Small Cap JASCX SCC 11.6 6.4 5 1 1 5 5 5
James Micro Cap JMCRX SCC 6.6 1.4 4 3 4 6 4 4
Ancora MicroCap ANCIX SCV 3.0 -1.1 2 1 1 5 3 3
WCM SMID Quality Value WCMFX SCC 7.7 2.5 5 2 1 4 5 5
Small core average     5.2   3 3 3 6 3 3
Small value average     4.0   3 3 3 6 3 3

Here’s how to read that table. The first three columns identify the fund: name, ticker, and Lipper category. The next two focus on total returns: annualized percentage and the amount by which they led or trailed their peers. The remaining columns offer simplified risk-return ratings. For each measure of risk versus return (Ulcer Index, downside deviation, bear market performance, MFO’s overall assessment, Sharpe ratio), MFO divides peer groups into five bands – best, above average, average, below average, worst – and color codes them. For your purposes, check for blue (best) and green (above average). Yellow is respectably average. Avoid red.

Conclusions:

  1. Active worked. 75% of the active funds on the list outpaced their peer group and benchmark.
  2. Passive didn’t, so much. Two of the three passive funds lagged their peers by, on average, 350 basis points, which is a big honkin’ deal when your total return is around 1%. The two funds that most dramatically trailed their peers were passive, smart beta EFTs. Pacer US Small Cap Cash Cows invests in small caps with exceedingly high free-cash flows. That led to vast overweights in tech and energy, and vast underweights in consumer goods and financial services. It’s a high turnover strategy (108%) with 200+ names in the portfolio. Acquirers Small and Micro Deep Value ETF tracks an index of 100 deeply undervalued small and micro-cap stocks. Their strategy is distinctive and not … umm, index-like:

    The initial universe of stocks is then valued holistically—assets, earnings, and cash flows are examined—in accordance with the Index methodology to understand the economic reality of each stock. Each stock is then ranked on the basis of such valuation. Potential components are further evaluated using statistical measures of fraud, earnings manipulation, and financial distress. Each potential component is then examined for a margin of safety in three ways: (a) a wide discount to a conservative valuation, (b) a strong, liquid balance sheet, and (c) a robust business capable of generating free cash flows. Finally, a forensic-accounting due diligence review is performed …

    As advertised, it invests in stocks much smaller and much more undervalued that almost any of its SCV peers. Like CALF, its annual portfolio turnover exceeds 100%. In the long term, the strategy tends to underperform its peers by 100-300 bps.

  3. Aegis Value and James Small Cap worked best. Aegis, a purely outstanding and distinctive fund, beat its peers by 920 basis points, while James Small led by 640.

    Aegis Value Fund (AVALX) pursues long-term capital appreciation by investing in a concentrated portfolio of deeply undervalued, small-cap stocks—often in the lowest quintile of the market by price-to-book value. Managed by Scott Barbee since its 1998 inception, the fund targets overlooked out-of-favor companies, exploiting market inefficiencies and volatility where analyst coverage is sparse and liquidity is low. With a disciplined, research-intensive approach, AVALX has achieved amazing results. How amazing? Here’s Morningstar’s summary of its total returns – the top row – and what percentage it occupies among all small-value funds.

    Source: Morningstar.com, 6/14/2025

    Translation for the data-hesitant: the fund performed in the top 1% of all small cap funds for the past day, week, month, quarter, year and then 3-, 5, 10- and 15-year periods. We’ve profiled Aegis Value Fund in this month’s issue.

    The James Small Cap Fund (JASCX) seeks long-term capital appreciation by investing primarily in undervalued domestic and international small cap stocks. The target are companies with strong profitability and positive momentum, emphasizing quality “core” names with a slight value tilt. The fund typically holds a diversified portfolio (86 stocks as of March 2025), with about 28% of assets in its top 10 holdings, and maintains an amazing low turnover rate of 18%. Most small caps are far higher and Vanguard’s three small cap index funds have turnovers (13 – 21%) in this same range.

    The fund’s long-term performance, depending on the exact time frame, ranges from perfectly respectable to rock star.

    Source: Morningstar.com, 6/14/2025

    The fund’s three current managers have been 10 – 25 years of experience managing the fund. The team was once much larger (as much as nine managers in 2015-2018) but this tighter team seems to be working.

Bottom line

It’s the never-ending tale: planning works, patience works, calm works. Grabbing for bangles and baubles? Not so much.

The key question is: what’s the prospective that small and q1uality will continue to work in the years just ahead? Because of the incessant focus on one niche, the Favored Few within the large growth arena – the FANGs, then the MAG-7 and now All Things AI – and the continued growth of corporate earnings across the board, small and quality are both cheaper now than they were eight years ago. If you think that purchase price matters in future returns, that means they’re more attractive now than they were eight years ago.

The chart below also appears in the July 2025 Publisher’s Letter.

Source: Research Affiliates, 6/2025

The way to read that chart is to start by finding the little green diamonds. Those are the more-or-less current valuations of each strategy relative to its historic valuations. Green diamonds below the colored bar which illustrates the historic range from 10th percentile to 90th, signals that the strategy is now cheaper than it has been 90 or 95% of the time.

Finally, we’ve addressed the value of “calm” in an age of chaos in a series of articles by four different authors on The Chaos-Resistant Portfolio. (All are easy to find. Use the “Search MFO” box and enter just the word “chaos.”) The short version of those articles is that the price of calm in the years ahead is a thoughtful reevaluation of your portfolio allocation today.

Launch Alert: Stewart Investors Worldwide Leaders fund

By David Snowball

On June 18, 2025, Stewart Investors, an active, long-only global equity specialist with $16.5 billion in assets under management, launched the Stewart Investors Worldwide Leaders fund (SWWLX) with an initial investment from a U.S. foundation. SWWLX is the firm’s first fund available to regular US investors.

Stewart is Edinburgh-based and describes themselves this way: “We are a small team of passionate investors managing, on behalf of our clients, investment portfolios with a focus on high-quality companies that are well positioned to contribute to, and benefit from, sustainable development.”

In line with that, the Stewart Investors Worldwide Leaders Fund invests in quality companies that are well-positioned to contribute to, and benefit from, sustainable development. SWWLX is actively managed, benchmark agnostic, and concentrated, and will typically hold 30 to 60 companies with free float market capitalizations of at least $5 billion. The fund invests in equity securities in both developed and emerging markets.

Managers Sashi Reddy joined the firm’s investment team in 2007, while David Gait joined in 1997. Mr. Reddy, whose non-US fund has a beta of 0.79, makes a familiar and sensible argument: “Quality businesses shine when the top-down macro environment becomes more challenging, as is the case today. Companies with strong cultures and sound franchises manage uncertainty, volatility, and complexity better than most, and we continue to find these businesses, buy them at reasonable prices, and remain patient investors.”

The U.S. fund is similar to the Worldwide Leaders strategy available to non-U.S. investors since November 2013. Morningstar UK’s team ranks that strategy as one of the five best options for navigating chaotic times:

Stewart Investors Worldwide Leaders Sustainability has a unique process, with strong credentials in sustainable investing, and a focus on high-quality, lower-risk stocks, making it a dependable option in down markets.

The strategy targets companies that can contribute to sustainable human development, with the lowest ecological impact. Although the team places much emphasis on sustainability and stewardship, this isn’t a pure environmental, social, and governance fund. The team looks for durable franchises with high-quality management that is well aligned with shareholders. The process is genuinely long-term and patient, resulting in relatively low turnover. It leads to a portfolio that looks very different to the benchmark. The strategy has a growth bias with overweightings in the technology and healthcare sectors. (Mathieu Caquineau, “Five Global Equity Funds to Survive Market Volatility,” 10/23/2024)

It is, by their rating, a four-star fund.

Good news: it’s cheap for a concentrated active fund, with expenses capped at 0.60%. Bad news: they are launching an institutional share class ($1 million minimum initially) with “more share classes for retail investors in the short term.”

Aegis Value Fund (AVALX)

By David Snowball

THIS IS AN UPDATE OF THE FUND PROFILES published in 2009 and 2013.

Objective and strategy

The fund seeks long-term capital appreciation by investing in a diversified portfolio of very, very small North American companies. 

Aegis believes excess returns can be generated by:

  • purchasing a well-researched portfolio of fundamentally sound small-cap stocks trading at low valuations during periods of stress or neglect, when liquidity is low and investor sentiment is poor,
  • holding these investments patiently through periods of short-term price volatility while fundamental conditions normalize, and
  • selling after fundamental trends reverse, as recovery becomes visible and investor sentiment improves, driving valuations higher.

They look for stocks that are “significantly undervalued,” given fundamental accounting measures including book value, revenues, or cash flow.  They define themselves as “deep value investors.”  While the fund invests predominantly in microcap stocks, it does have the authority to invest in an all-cap portfolio if that ever seems prudent. 

Adviser

Aegis Financial Corporation of McLean, Virginia, is the Fund’s investment advisor. Aegis has been in operation since 1994 and has advised the fund since its inception in 1998.

Manager

Scott L. Barbee, CFA, is portfolio manager of the fund and a Managing Director of AFC. He was a founding director and officer of the fund and has been its manager since inception. He also manages 66 separate equity account portfolios of other AFC clients managed in an investment strategy similar to the Fund, with a total value of approximately $30 million. Mr. Barbee received an MBA degree from the Wharton School at the University of Pennsylvania. He is supported by four other professionals.

Strategy capacity and closure

Aegis Value closed to new investors in late 2004, when assets in the fund reached $820 million.  The manager estimates that, under current conditions, the strategy could accommodate roughly $1.5 billion. That aligns with the size of its average holding.

Management’s stake in the fund

As of June 2025, Aegis employees owned more than $48 million of Fund shares. The vast majority of that investment is held by Mr. Barbee and his family.  Two of the fund’s three independent directors, though very modestly compensated, have large stakes in the fund.

Opening date

May 15, 1998

Minimum investment

Nominally $10,000 for regular accounts and $5,000 for retirement accounts, but brokerages such as Schwab require a $1 minimum initial investment.

Expense ratio

1.45% on assets of $560 million, as of June 2025. The fund has attracted about $100 million in inflows in the first half of 2025. With a management fee of 1.2%, room for additional expense reductions is modest.

Comments

Small-cap value investing has long been out of favor as investors feverishly judge themselves on how many FAANGs or MAGs they’ve managed to acquire. Aegis Value presents the case for double-checking those easy impulses. My colleague, Devesh Shah, engaged in a long conversation with Mr. Barbee in 2023, which resulted in the essay, “In Conversation with Scott Barbee, Portfolio Manager at Aegis Value Fund” (8/2023). Devesh and Scott talked at length about his investable universe and his (since validated) perception of “a rare and fascinating opportunity” which now dominates his portfolio. Given the depth of those discussions, this profile will limit itself to three arguments: (1) Aegis is phenomenally successful, (2) Aegis is distinctive, and (3)  the Aegis discipline makes sense.

1. Aegis is phenomenally successful

As we composed this profile in mid-June 2025, Morningstar reported the following absolute and relative returns for Aegis Value. We should look at both the row labeled “Investment” and the one labeled “Percentile Rank.” The first row indicates annualized returns over a variety of trailing periods; for instance, the fund has averaged a return of 13.73% annually for the past 15 years. The lower row shows how that ranked within its peer group. The “1” means that Aegis Value was in the top 1% of its peers over the past 15 years.

Source: Morningstar.com, 6/14/2025

The top 1% over the past 15 years is remarkable. The top 1% over the past week, month, quarter, year, three years, five years, ten years, and 15 years is pretty much unprecedented. It’s also not a fluke: Lipper gave Aegis a five-star rating for consistency over the lifetime of the fund, the same rating assigned by MFO Premium’s calculation of the fund’s Ferguson Consistency Index: Lifetime.

The fund has done well even in comparison to its antithesis: the large-cap growth-oriented S&P 500. A $10,000 investment in Aegis at inception has grown to $202,000 today; the same investment in the S&P 500 has risen by one-fourth as much.

Source: Morningstar.com, 6/14/2025

2. Aegis is distinctive.

It is now, as it has frequently been, a portfolio incomparable to peers or benchmarks. Active Share measures the independence of a portfolio from its benchmark; the higher the active share, the greater the difference and the greater the prospect that the returns represent a manager’s skill rather than his asset class’s successor. Aegis has an Active Share of 99.3%, the highest of any fund we track. In 2022, we constructed a basket of small-cap value funds with the highest quality portfolios (updated this month in “More dirty sex and your spanked portfolio: A three-year review,” 7/2025). Of the 11 funds – active and passive – in that basket, Aegis had the lowest correlation to its peer group, to its benchmark, and to the S&P 500.

Concrete markers of that difference come from a glance at the portfolio:

  • 92% of the portfolio is in just two sectors: materials and energy. The peer weight is 11%.
  • 15% of the portfolio is in the US, compared to 97% for peers
  • 59% of the portfolio is invested in Canada accounting as opposed to 1% for peers.
  • 42% is invested in microcap stocks, compared to 9% for its peers
  • By Morningstar’s metrics, the fund’s average market cap is $655 million, the average holding in its peers is 800% larger
  • The fund currently holds 9% cash, compared to 1.7% for peers (and 4% two years ago, when Devesh spoke with Mr. Barbee).

That gives some weight to a comment that Mr. Barbee made to Devesh in 2023: “We are an odd duck in that we do detailed work on stocks as if we were a hedge fund without charging the performance fees.”

3.  The Aegis discipline makes sense.

Many managers claim to ignore macroeconomic factors. “We’re not into political economics. We just buy the best stocks available” is their mantra. Mr. Barbee seems to have rather more sympathy for understanding Big Picture issues than trying to position Aegis Value for success within them. There seem to be two big picture issues on his mind. First, the major US stock indices are highly concentrated and wildly overvalued:

Today, speculative fervor continues to dominate the markets.  The ratio of assets in levered long ETFs to assets in short ETFs hit 11.1 times, the most on record according to Bloomberg.  Fund Manager Survey cash allocations are at the lowest since 2001 according to Bank of America.  Retail sentiment is also unusually robust with Households all-in on equities. Ned Davis Research recently reported that stocks as a percentage of total household financial assets hit 36.1 percent, the highest household allocation to equities since 1952.    NYSE margin debt is also on the rise, climbing nearly 50 percent in the last two years to levels near $900 billion today. US equities today are top-heavy, fully-valued, and vulnerable to decline.  The market capitalization of the top-10 stocks in the S&P 500 Index at year-end constituted nearly 40 percent of the overall index, with the largest market-cap stock at a record valuation 750 times as large as the 75th percentile stock in the Index, a concentration level not seen since the 1930s, according to Goldman Sachs.  (Shareholder Letter, 1/27/2025)

Second, the federal government’s inability to align its income with its expenses risks leading to a debasement of the dollar. The federal government’s status as the world’s safest investment and strongest haven is being called into question by a debt that’s so large that interest payments on it exceed $1 trillion a year.

Source: St. Louis Fed, 5/29/2025

Debt payments are the third-largest, and the fastest-growing, category of federal outlay. The combination of huge deficits and diffidence from international investors creates the prospect for real and sustained inflation. As DoubleLine founder and hedge fund manager Jeff Gundlach warned in June: “a reckoning is coming.”

Mr. Barbee believes that he has positioned the portfolio intelligently in light of both of those factors.

We believe our angular portfolio, with a strong focus on materials and energy, is well positioned given today’s environment We are currently maintaining a portfolio that is unusually angular, with high concentration among a number of deeply undervalued small-cap energy and materials stocks from the value universe, including a substantial number of Canadian stocks and a few other foreign equities.  Many of these Fund positions have been performing well despite the significant headwinds of a rapidly strengthening dollar.  However, with the dollar hitting new highs, sentiment towards securities trading outside the United States has deteriorated markedly.  Resultingly, significantly lower valuations remain available on foreign securities.  With the strong dollar now looking quite extended, and with US technology equities today in the spotlight, we believe it is a great time to be opportunistically positioned in international, commodity-producing stocks, particularly given that commodities are typically priced in dollars.  Should the dollar roll-over, whether driven by a new Washington political consensus or otherwise, the recent dollar headwinds faced by international stocks and commodity producers could rapidly shift to tailwinds.   As the S&P 500 has soared in the last few years, US small caps have also been underperforming, with many managers appearing to be throwing in the towel.  Fund manager positioning toward small-cap stocks was recently reported by Bank of America to be at the lowest level in records going back to 2015. (Shareholder Letter, 1/27/2025)

The portfolio is positioned to benefit from declines in the US dollar, and many of its holdings are considered traditional inflation hedges.

Bottom Line

Aegis Value is a deep-value fund that has traditionally found some of the most compelling values in the small- to microcap space. Mr. Barbee is one of the field’s longest tenured managers, and Aegis sports one of its longest records. Both testify to the fact that steadfast investors here have had their patience more than adequately rewarded. You should consider it.

Fund website

Aegis Value fund.  We’d mostly commend the wealth of shareholder letters to you.

Briefly Noted . . .

By TheShadow

Launches and Reorganizations

The Angel Oak Total Return ETF is in registration. The managers will have the freedom to invest in just about every conceivable sort of income-generating security, from investment-grade, corporate bonds to asset-backed securities that include student loan portfolios. Ward Bortz, Namit Sinha, and Clayton Triick will be the portfolio managers of the ETF. Expenses have not been stated at this time.

Goldman Sachs‘ Enhanced U.S. Equity, Strategic Growth Fund, Focused Value, and Technology Opportunities funds will be reorganized into ETFs. The Enhanced U.S. Equity, Strategic Growth, and Focused Value funds will be reorganized on or about November 14th. The Technology Opportunities fund will be reorganized on or about December 5th.

Morgan Stanley Income Opportunities Fund will be converted into an ETF on or about November 7th.

Sprott Active Metals & Miners and Sprott Metal Royalty & Streaming ETFs are in registration.

Sprott Active Metals & Miners ETF will invest primarily in companies that are involved in the mining, exploration, production, development, distribution, or recycling of metals and raw materials required to support growing global energy demand and royalty and streaming companies engaged in financing such metals and raw materials. The fund will be managed by Justin Tolman, Maria Smirnova, and Shree Kargutkar. Expenses have not been stated.

The Sprott Metal Royalty & Streaming ETF will primarily invest in companies with at least 50% of their revenue from metal royalties or streaming or metal royalty trusts and closed-end trusts that invest 50% or more of their assets in physical gold, silver, platinum, palladium, copper, or uranium. The fund will be managed by Ryan Mischker, Andrew Hicks and Charles Perkins are responsible for the day-to-day management of the ETF. Expenses have not been stated.

VanEck Emerging Markets Bond Fund will be reorganized into an ETF during October 2025.

Vanguard launched its Vanguard Multi-Sector Income Bond ETF (VGMS), an actively managed fixed income ETF. This new ETF is strategically designed to add total return potential while generating higher income, offering advisors and investors access to professional management across a range of fixed income sectors including investment-grade credit, high-yield corporates, emerging market bonds, and structured products The ETF has estimated expense ratio of 0.30% for the current fiscal year; which is identical to the Admiral share class of the mutual fund and 0.15% cheaper than the Investor shares (VMSIX). That makes this ETF a more cost-effective choice for investors who don’t meet the $50,000 minimum investment for the Admiral share class. It will be managed by Michael Chang, Arvind Narayanan, and Daniel Shaykevich.

Wasatch Global Small Cap and International Small Cap Value funds are in registration. Both funds will have an investor share class ratio of 1.5% and will be managed by portfolio manager Mark Madsen and associate portfolio manager Karson Schrader. Both managers were formerly managers of Grandeur Peak funds.

Small Wins for Investors

None noted.

Closings (and related inconveniences)

Kopernik Global All-Cap Fund will close to new investors as of the close of business on July 31st. The fund had just reopened to new investors on March 3, 2025, having been closed since June 1, 2023.

Old Wines in New Bottles

Torray Fund is changing its name to Torray Equity Income Fund effective August 31st.

Off to the Dustbin

BNY Mellon Short-Term U.S. Government Securities Fund will be liquidated on or about August 11th.

BNY Mellon Income Stock Fund will be reorganized into the BNY Mellon Enhanced Dividend and Income ETF. The reorganization will be consummated on or about the close of business on December 5, 2025.

John Hancock Capital Appreciation Fund will be reorganized into the John Hancock U.S. Growth Fund. Shareholders will vote on the reorganization on July 9th.

Nationwide Janus Henderson Overseas fund will be liquidated on or about August 15th.

Neuberger Berman Next Generation Connected Consumer ETF will be liquidated on or about August 21st.

RBC funds are liquidating RBC Enterprise, RBC Small Cap Core, RBC Microcap Value, and RBC Small Cap Value funds on or about September 29th. These funds were previously known under the Babson and Tamarack fund monikers.

 RBC funds is also liquidating its RBC Global Equity Leaders fund on or about July 25th.

Virtus KAR Global Quality Dividend Fund will be reorganized into the Virtus KAR Equity Income Fund on or about September 12th.