


I skimmed through a couple of books for this article about income, searching for ideas. They tend to be very general, tell the reader how to get rich, or focus on risky investments like stocks and real estate investment trusts (REITs). Exchange-traded funds that invest in REITs averaged drawdowns of 38% during the past six years, while the S&P 500 had a drawdown of 24%. Ouch! I have a different perspective on income. Funds should have a high reward for the risk taken. The book that I related to the most was Income Factory – How You Can Live Off Your Dividends in the Future: Grow Your Income with Dividend Growth and Income Strategies (2025) by Sebastian Johnen, because he covered topics such as variability of distributions and sequence of return risk.
If you have your savings in a savings deposit guaranteed by the FDIC (Federal Deposit Insurance Corporation), you have very little risk of losing your savings except to the silent thief known as inflation. These savings won’t cover 4% withdrawals over the long term. This article focuses on funds that produce high-risk-adjusted yields that lie between safe savings deposits and riskier stocks.
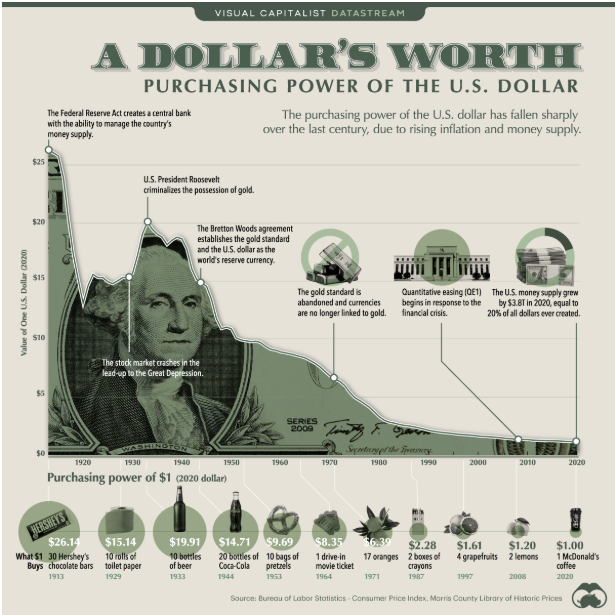
There are two parts to the Perpetual Motion Income Machine: 1) safe income to cover distributions, and 2) capital appreciation to beat inflation. The average inflation rate since the 1980’s has been about 2.3%. I am seeking minimum annualized returns of 7% to cover 4% withdrawals and capital appreciation of 3%. There have been three major secular bear markets (1929 – 1943, 1968 – 1978, 2000 – 2013) during the past one hundred years, when returns were low, so that most portfolios lost purchasing power and experienced a decline in portfolio value. The period from the COVID recession to the Great Normalization with inflation followed by rising rates offers a recent opportunity to study the sequence of return, although on a small scale.
Scope of This Article
For this article, I used Morningstar and Seeking Alpha to estimate historical prices, capital appreciation, and distribution yields over the past six to ten years for about a hundred funds from 41 Lipper Categories. The funds were selected because of their risk-adjusted returns (Martin Ratio), risk (Ulcer Index), and consistency (SIGMA %APR), among other criteria, through periods of low interest rates, rising or falling rates, inflation, and recession-induced bear market. Other than a few baseline funds, each had average annual returns of 4% or more for the past ten years or the life of the fund, whichever was shorter.
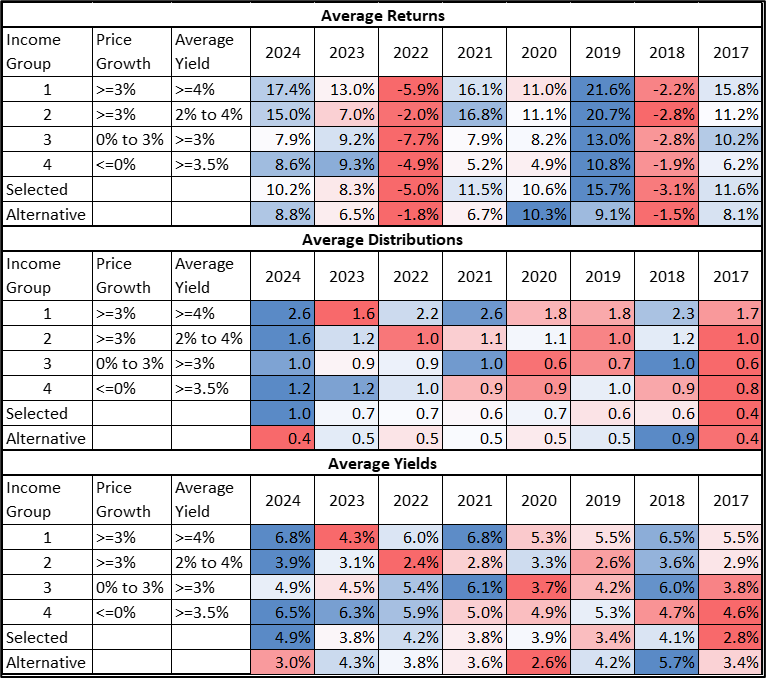
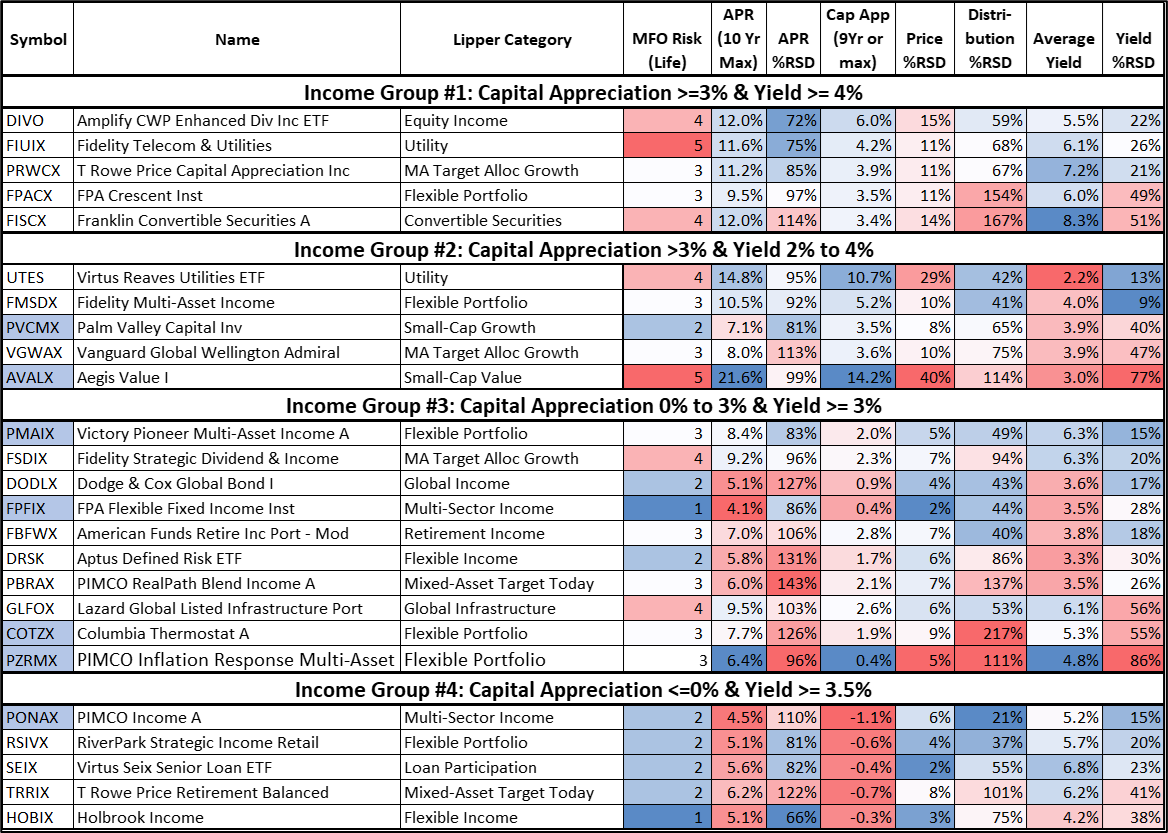
I divided the funds into four income groups based upon capital appreciation and average yields. Group #1 meets both of my objectives for capital appreciation greater than 3% and yields over 4%. Funds tend to be more aggressive, such as equity income, utilities, and mixed-asset growth. Group #2 meets the capital appreciation objective and produces yields between 2% and 4%. These funds tend to be a little less risky than Group #1 and include many of the same categories, along with consumer goods and more alternatives. Funds in Groups #2 and #3 tend to be less risky. Group #3 has positive capital appreciation and yields over 3%. Group #4 produces high yields, but capital appreciation is negative. The results are shown in Table #1.
Relative Standard Deviation (%RSD) measures the standard deviation (variability) relative to the mean in order to make more meaningful comparisons. Lower %RSD means the values fluctuate less. Distributions and yields may fluctuate with either the interest rate cycle or the stock market cycle. I used %RSD for distributions and yields, among other criteria, to select a short list of twenty-six funds to study further and fourteen income-producing alternative funds.
Table #1: Income Funds by Capital Appreciation and Yield

Source: Author Using MFO Premium fund screener and Lipper global dataset, Morningstar, Yahoo Finance
Lipper Categories
The term “high yield bonds” often draws a negative reaction from risk-averse investors. Riskier bond funds are not a replacement for quality bond funds. We are going to see in the following sections that many types of riskier debt are less risky than stocks and many mixed asset funds. I mostly focus on funds that have an MFO Risk rating of “Conservative” and “Moderate” with low Ulcer Index values, which measure the depth and duration of drawdowns. Here are some of the Lipper Categories and definitions for many of the funds presented in this article, sorted loosely for the funds that I track from lowest risk to highest:
Loan Participation: Funds that invest primarily in participation interests in collateralized senior corporate loans that have floating or variable rates.
Alternative Credit Focus: Funds that, by prospectus language, invest in a wide range of credit-structured vehicles by using either fundamental credit research analysis or quantitative credit portfolio modelling, trying to benefit from any changes in credit quality, credit spreads, and market liquidity.
Absolute Return Bond: Funds that aim for positive returns in all market conditions and invest primarily in debt securities. The funds are not benchmarked against a traditional long-only market index but rather have the aim of outperforming a cash or risk-free benchmark.
Multi-Sector Income: Funds that seek current income by allocating assets among several different fixed income securities sectors (with no more than 65% in any one sector except for defensive purposes), including U.S. government and foreign governments, with a significant portion of assets in securities rated below investment-grade.
Flexible Income: Funds that emphasize income generation by investing at least 85% of their assets in debt issues and preferred and convertible securities. Common stocks and warrants cannot exceed 15%.
Alternative Global Macro: Funds that, by prospectus language, invest around the world using economic theory to justify the decision-making process. The strategy is typically based on forecasts and analysis about interest rate trends, the general flow of funds, political changes, government policies, intergovernmental relations, and other broad systemic factors. These funds generally trade a wide range of markets and geographic regions, employing a broad range of trading ideas and instruments.
Income Fund Risk and Reward
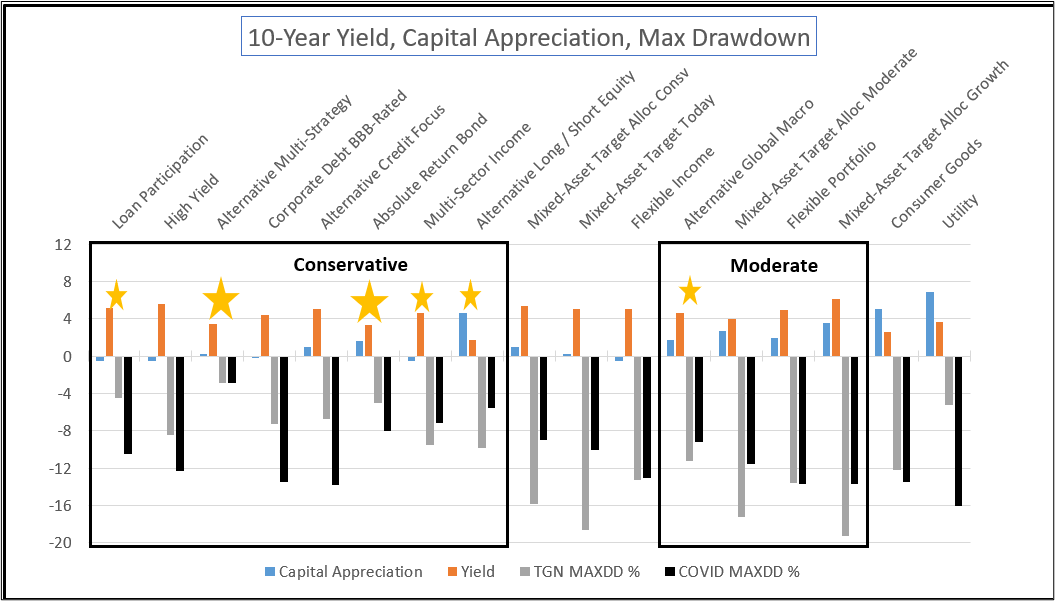
The most common Lipper Categories for funds that I researched with ten years of history are shown in Figure #1, sorted from lowest risk (combined composite MFO Risk and Ulcer Index) on the left to the highest on the right. Drawdowns during the COVID bear market are the black bars, and drawdowns during the Great Normalization with rising rates are the grey bars. Large gold stars indicate the Lipper Categories that had low drawdowns during both bear markets, and the smaller gold stars indicate categories that did moderately well.
Figure #1: Historical Distribution Yield, APR, and Drawdowns
Source: Author Using MFO Premium fund screener and Lipper global dataset, Morningstar, Yahoo Finance
Examples of funds in the categories with the large gold stars are BlackRock Systematic Multi-Strategy (BAMBX) with an average yield of 4.0% over the past ten years, and AQR Diversified Arbitrage (ADANX) with a yield of 2.8%. The key takeaway from the previous chart is that the sequence of return risk can be reduced by balancing allocations to funds that fluctuate according to the interest rate cycle and stock market cycle. Some alternative funds may reduce risk while also producing income.
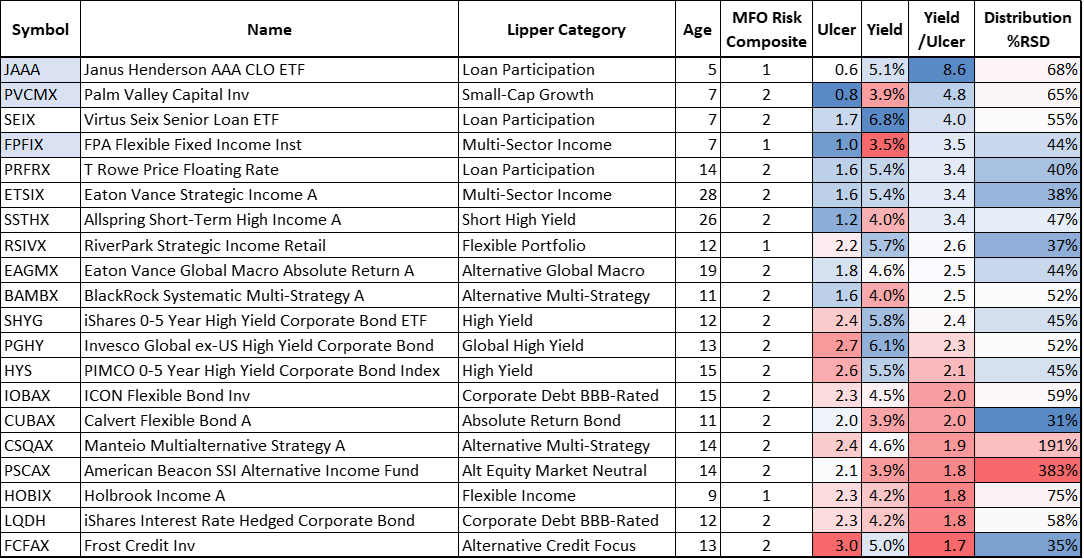
Funds With High Risk Adjusted Yield
Table #2 contains a representative fund from Lipper Categories with the highest Yield/Ulcer Ratio, which happen to have MFO Risk Ratings of “Very Conservative (1)” and “Conservative (2)”. In addition, the distributions are fairly consistent as measured by “Distribution %RSD”. The investor share class for FPA Flexible Fixed Income Fund (FFIRX) is available at Fidelity. Palm Valley Capital Fund (PVCMX) is an interesting fund. It is about 22% invested in 23 small-cap stocks, with the rest invested mostly in cash and Treasury bills. I own shares in both of these funds. I own shares in the three funds shaded blue.
Table #2: Funds With High Risk Adjusted Yield
Source: Author Using MFO Premium fund screener and Lipper global dataset, Morningstar, Yahoo Finance
Income Groups by Capital Appreciation and Yield
High average yields are great, but if an investor wants to depend upon steady distributions, they may need to mix funds with different income characteristics. Table #3 contains average annual returns, distributions, and yields for nearly one hundred. Returns are noticeably lower during 2018 and 2022 and higher in 2019. Distributions for Group #1 tend to fluctuate the most, while they are more stable in the other three groups. Yields tend to fluctuate a lot because they are estimated from both distributions and prices. It is important for investors who need to rely on distributions to use a safe investment, such as money market funds, to act as a buffer for when distributions are low. Bond ladders can also act as buffers.
Table #3: Income Groups by Capital Appreciation and Yield
Source: Author Using MFO Premium fund screener and Lipper global dataset, Morningstar, Yahoo Finance
Minimum Expected Returns
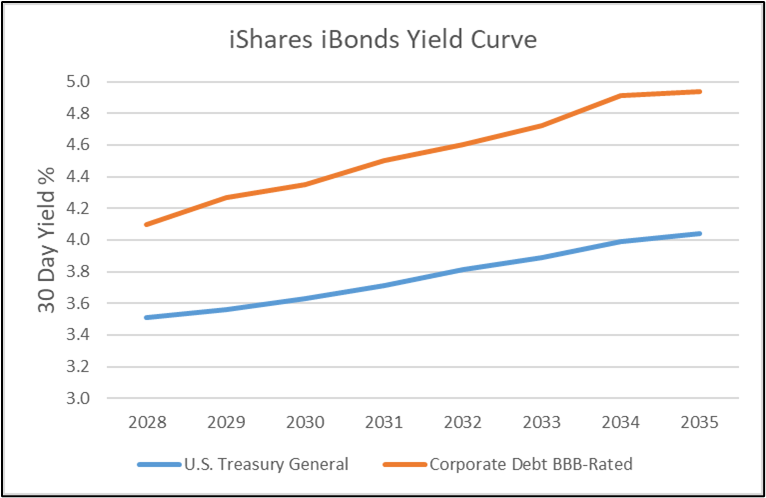
Figure #2 shows the yield curve for iShares iBonds with target date maturities. iShares iBonds corporate bond ETFs that mature in 2034 and 2035 are yielding nearly 5% and about 1% more than Treasuries. They get more conservative as their maturity dates get closer. At this point in time, I can lock in yields of 4% or higher for the next ten years with bond ladders. I used this as a threshold that every fund evaluated had to have returns of 4% or higher over the past ten years, otherwise adding to the bond ladder is a good alternative.
Figure #2: iShares iBonds Corporate and Treasury Yield Curves
Source: Author Using MFO Premium fund screener and Lipper global dataset
Author’s Selected Funds
Table #4 contains the funds in my short list. The fund symbols shaded blue are in the Core TIRA portfolio. Metrics shaded blue are more favorable, while the red ones are less favorable. Metrics are based on the past ten years or the life of the fund, whichever is shorter. Capital appreciation is calculated from 2016 to 2025.
Table #4: Author’s Shortlist of Income Funds
Source: Author Using MFO Premium fund screener and Lipper global dataset, Morningstar, Yahoo Finance
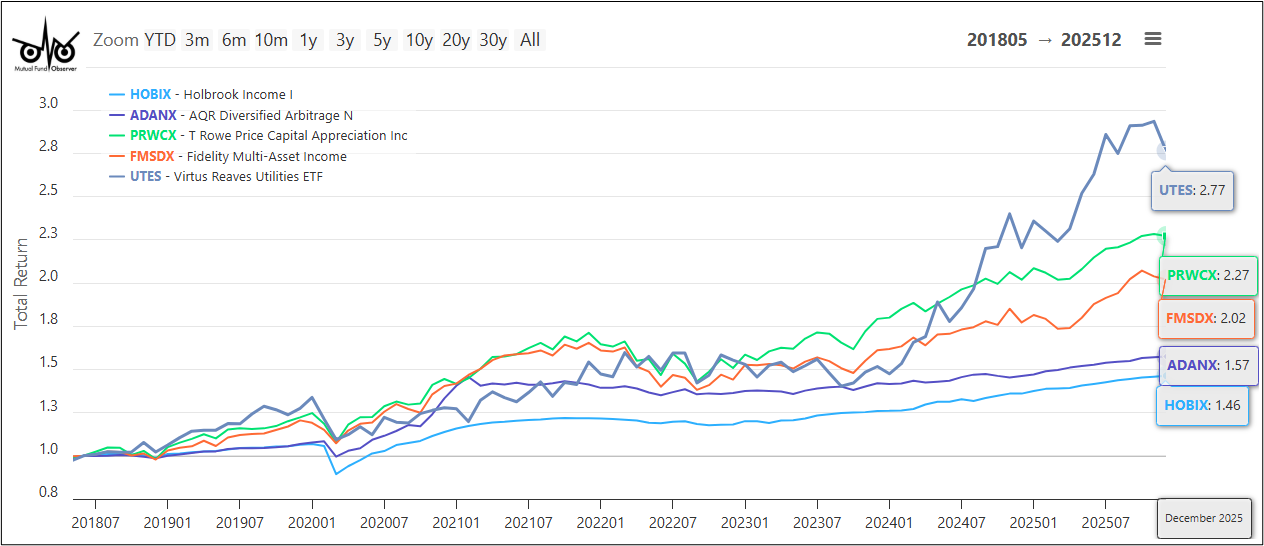
The funds are shown in Figure #3. The six larger, bold funds are in the Core TIRA. While I like Virtus Reaves Utilities ETF (UTES) for its total return, Fidelity Telecom & Utilities (FIUIX) makes more sense from an income perspective. I am considering Fidelity Multi-Asset Income (FMSDX) and T Rowe Price Capital Appreciation Income (PRWCX) for my mid-year review.
Figure #3: Author’s Shortlist of Income Funds – Capital Appreciation vs Yield
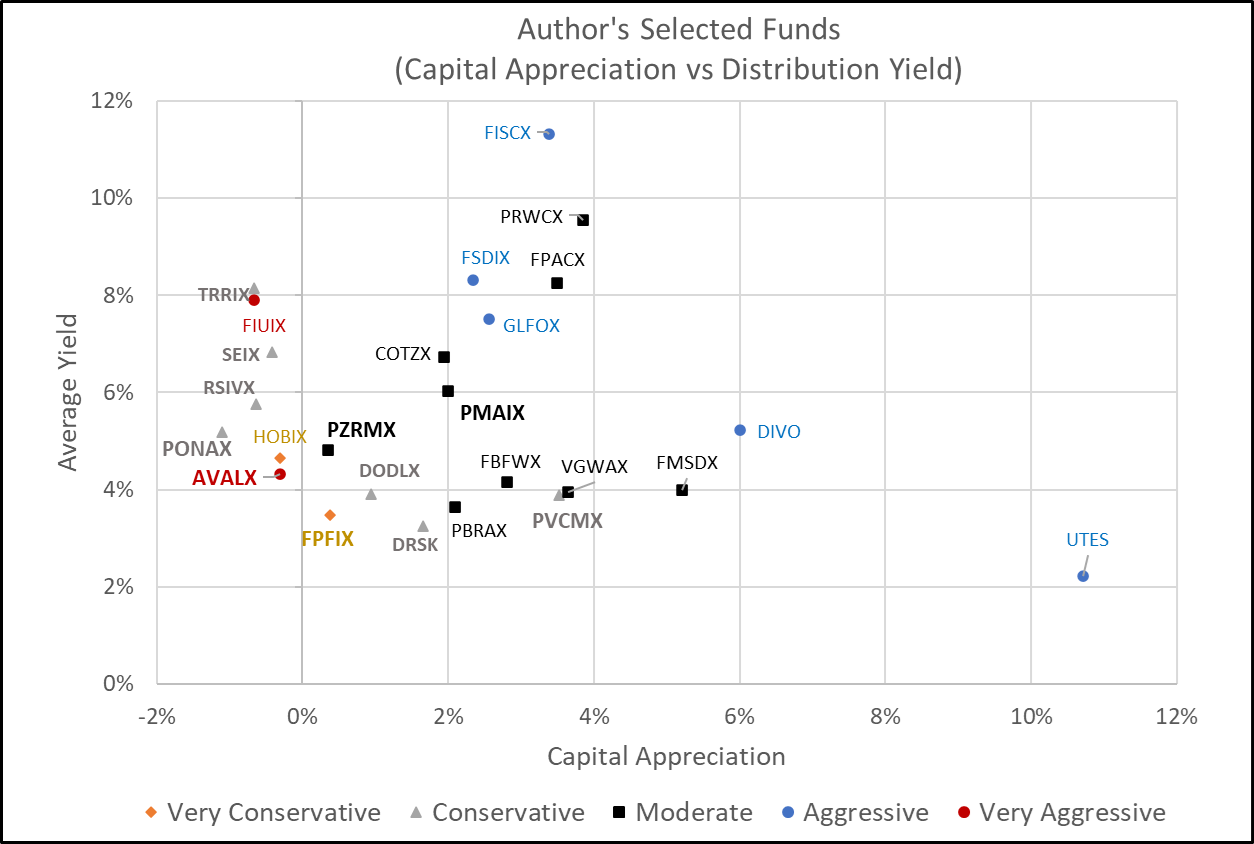
Source: Author Using MFO Premium fund screener and Lipper global dataset, Morningstar, Yahoo Finance
Perpetual Motion Income Machine
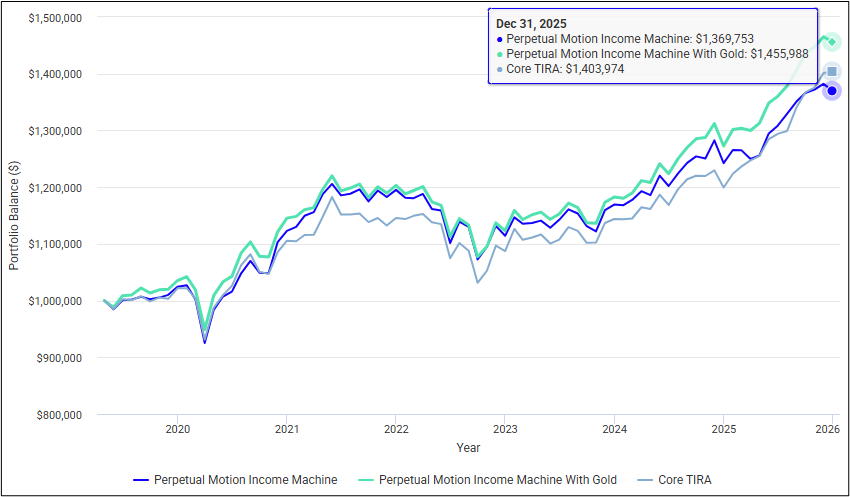
Table #5 contains the Perpetual Motion Income Machine Portfolio with and without iShares Gold Trust (IAU) compared to the Core TIRA and Fidelity Asset Manager 40% (FFANX). The assumptions include 4% annual withdrawals. The Core TIRA holds up well. There are advantages to each of the three depending upon whether you prefer total return or income. With perfect hindsight, all three outperform the Fidelity Asset Manager 40% (FFANX). The link to Portfolio Visualizer is provided here.
Table #5: Perpetual Motion Income Machine Portfolio (May 2019 – Dec 2025)
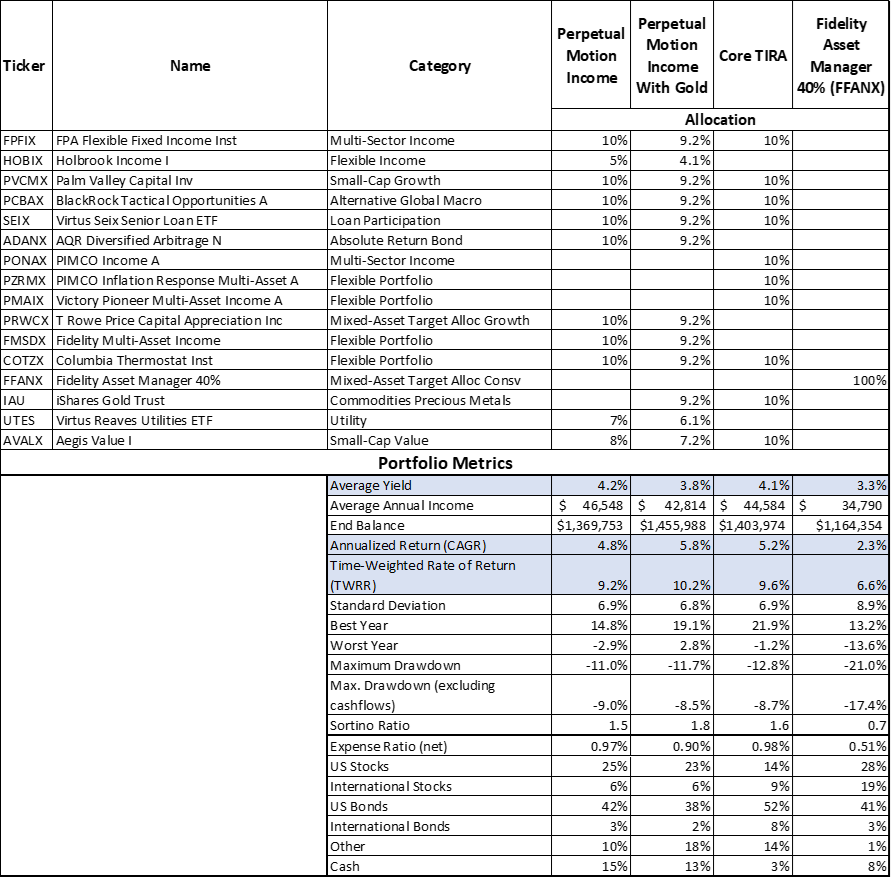
Source: Author Using Portfolio Visualizer
Note: I substituted Virtus Seix Senior Loan ETF (SEIX) for Janus Henderson AAA CLO ETF (JAAA) in the Core TIRA in order to evaluate a longer time period.
Figure #4 shows the results graphically. All would have been subject to loss of inflation-adjusted purchasing power because of inflation and the Great Normalization.
Figure #4: Perpetual Motion Income Machine Portfolio
Source: Author Using Portfolio Visualizer
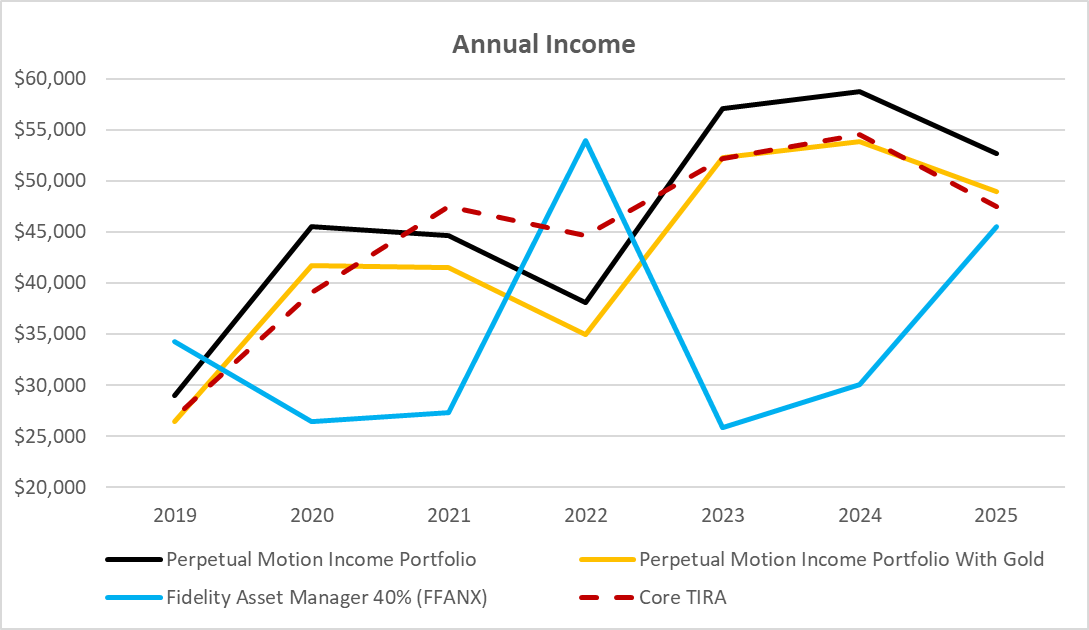
The Perpetual Motion Income Machine Portfolio was designed to produce a steady income, which is evident in Figure #5. Having more funds within reason smooths out distributions. The dip in 2022 might have been reduced with Fidelity Series Real Estate Income (FSREX) or an international equity fund (DBEF, LVHI).
Figure #5: Perpetual Motion Income Annual Income
Source: Author Using Portfolio Visualizer
Funds for Mid-Year Review
The Perpetual Income Portfolio has five new funds compared to the Core TIRA, one of which is an alternative fund. I will evaluate these at mid-year when a bond matures. The funds are shown in Figure #6.
Figure #6: New Funds in Perpetual Income Portfolio
Source: Author using MFO Premium fund screener and Lipper global dataset.
Closing
Over the past two years, I recognized that my overall stock to bond ratio was higher than the long-term environment justified, lowered my risk profile with financial advisors, adapted the concept of having aggressive and conservative Traditional IRA sub-portfolios, adapted the concept that a portfolio can extend across more than one account, realized that my bond ladder is an integral part of the conservative Traditional IRA sub-portfolio, and changed my strategy to have each rung in a ten-year bond ladder contain 3% of the portfolio value. It will take several years to wind down my bond ladder to 30% of the portfolio value. The Core TIRA will evolve slowly.
With the Bucket Approach, the short-term bucket contains safe short-term funds to meet spending needs for the next three years and to cover emergencies. For this reason, I may be too conservative in the Core TIRA Portfolio because I developed it as a standalone portfolio. The Core TIRA has 23% allocated to stocks. I would like to increase this a little over time. I have three funds identified to consider adding during my mid-year review: 1) T Rowe Price Capital Appreciation Income (PRWCX), and 2) Fidelity Multi-Asset Income (FMSDX). AQR Diversified Arbitrage (ADANX) has also caught my attention.
The Perpetual Motion Income Portfolio doesn’t entirely eliminate the sequence of return risk from the silent thief inflation, nor a secular bear market. It does provide enough income to cover withdrawals so that no funds would have to be sold in a down market. Bond ladders provide an additional buffer to the variability of distributions. It is important to build a margin of safety into financial plans.