


At the time of publication, this fund was named AMG Chicago Equity Partners Balanced.
Objective and strategy
The managers aim to provide “high total investment return, consistent with the preservation of capital and prudent economic risk.” The fund normally holds 50-75% in equities with the remainder in bonds and cash. The equity sleeve is mostly mid- to large-cap US stocks; direct foreign investment is minimal. The income sleeve is mostly high quality, intermediate-term bonds. The managers have the freedom to invest up to 25% in high-yield securities or in longer maturity bonds but, mostly, don’t.
Adviser
AMG (Affiliated Managers Group) advises the fund. AMG partners with forty small, distinctive investment management firms which then offer funds or separately managed accounts through the AMG umbrella. Its partner firms include River Road, Yacktman and SouthernSun. AMG has about $730 billion in assets under management.
Chicago Equity Partners manages the fund. CEP is a Chicago-based (duh) firm founded in 1989 to provide “bespoke equity offerings” to institutional clients. They have more than 100 institutional clients and about $10 billion in assets under management. AMG holds a 60% stake in CEP.
Manager
A team composed of Daniel Miller, William Sterling, Aaron Clark, Thomas A. Masi, and Mary Kane. Messrs Miller and Sterling are responsible for the portfolio’s asset allocation. Messrs. Clark and Masi are responsible for equity investments and Ms. Kane is responsible for fixed income. All are members of GW&K’s investment committee and all joined the fund in April 2020. With the exception of Masi and Clark, they are also responsible for co-managing other GW&K funds.
Strategy capacity and closure
The managers anticipate no meaningful constraints in the foreseeable future since they have a small fund trading in with highly-liquid asset classes.
Management’s stake in the fund
None of the managers has chosen to invest any of their money in the fund (as of June 2023).
Opening date
January 2, 1997.
Minimum investment
$2,000 on the “N” (formerly “Investor”) shares, reduced to $1,000 for IRAs. The lower-cost “I” and “Z” share classes have minimums of $100,000 and $5,000,000, respectively.
Expense ratio
1.06%, after waivers, on assets of $23 million as of June 2023.
Comments
The evidence is indisputable: we’re cowards. All investors talk about “investing for the long term” and “short-term volatility is just noise, just a part of the game,” which are nice sentiments. Unfortunately, they’re not descriptions of investor behavior: investors undercut their gains by trading too much, buying too late and selling too early. That’s particularly pronounced with ETFs, which are destructively easy to trade, and high-volatility strategies, which are terrifying to hold.
That often means that funds which balance equities, bonds and cash in their portfolios are an investor’s least exciting and most profitable choice. The best might offer 80% of the stock market’s gains with just 60% of its risks. That’s called an “asymmetrical risk-reward profile.”
The Observer recognizes that fact and our fund screener is calibrated to be much more risk-aware than most. Each month we screen decades’ worth of data to answer the question, which managers are earning their keep? That is, which managers consistently offer positive absolute return with the least risk? In assessing balanced funds, we don’t just compare those funds against an anonymous peer group, but also against two excellent, low-cost alternatives from Vanguard: the utterly passive Balanced Index (VBINX) which is always and only 60% CRSP U.S. Total Stock Market Index and 40% Bloomberg Barclays U.S. Aggregate Float Adjusted Bond Index and Vanguard STAR (VGSTX), a fund of actively-managed Vanguard funds.
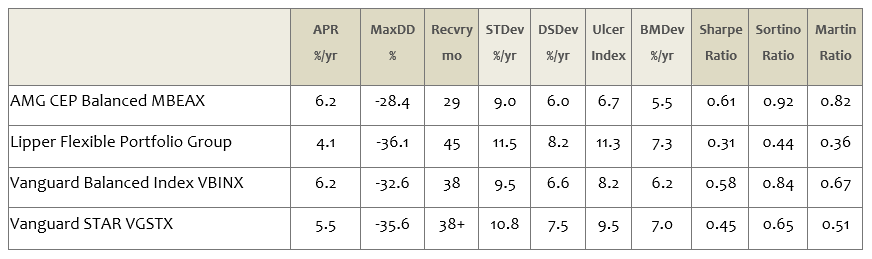
If you don’t glance at a Martin Ratio of 0.82 and think “cool! Excellent score on the most risk-sensitive measure, I’m feeling good,” we’ve prepared a simple translation for you in the table below. We tell you what each metric, above, actually measures and then how MBEAX’s performance over this particular 10-year-period compares to the others.
A quick example: APR %/yr translates to “annual percentage return, for the period measured, expressed in percents.” In the table below we describe those as the raw (i.e., not risk-adjusted) returns and let you know that MBEAX had higher raw returns than its peers or STAR.
How do you measure success?
| CEP Balanced | vs its peer group | vs Balanced Index | vs STAR | |
| Raw returns | APR | CEP wins | Tie! | CEP wins |
| Worst-case loss | MaxDD | CEP wins | CEP wins | CEP wins |
| Time it takes to recover from the worst case | Recvry | CEP wins | CEP wins | CEP wins |
| Normal volatility | Std Dev | CEP wins | CEP wins | CEP wins |
| Bad volatility | DS Dev | CEP wins | CEP wins | CEP wins |
| Combined effect of big losses and small recovery | Ulcer | CEP wins | CEP wins | CEP wins |
| Losses during months when the market is falling a lot | Bear market dev | CEP wins | CEP wins | CEP wins |
| Standard balance of risk and return | Sharpe | CEP wins | CEP wins | CEP wins |
| A more risk-sensitive balance of risk and return | Sortino | CEP wins | CEP wins | CEP wins |
| A very risk-sensitive balance of risk and return | Martin | CEP wins | CEP wins | CEP wins |
That comparison measures a meaningful period, we think: the span of time since the current management team fully settled in-place until now. If you do the same calculations for two other meaningful periods – the full market cycle that includes the 2007-09 crash and the current bull market plus the down market cycle that covers the 2007-09 crash – you see the exact same pattern. By every measure of reward, risk and risk-reward balance that we employed, CEP outperformed its peers (by a lot) and two entirely-excellent competitors.
Readers with MFO Premium access are able to look at the data for themselves by entering “MBEAX” into the multi-screener. We default to including the comparisons above. For those just interested in the data on the full- and down-market cycles I just mentioned, there’s a “Commentary” post with the tables for you at MFO Premium. Here is link to full Risk Profile.
The picture changes over shorter time periods, and that’s important to you.
The fund’s 1-, 3- and 5-year data show some wins and some losses, particularly against a purely-passive competitor. That makes perfect sense: a steadily rising, some say irrationally rising, market always punishes risk-conscious strategies and rewards maximum exposure to risk assets. Our ten-year and full-cycle comparisons take into account the reality of markets that rise and fall; shorter, arbitrary periods reflect just the upside performance.
And MBEAX is risk conscious. Manager Patricia Halper notes that “we ‘re very focused on risk control, which is reflected in the fact that our downside capture ratios are consistently in the top decile.” She describes the fund as “a pretty straightforward balanced fund, the sort of fund an investor would use as a core holding.” As we’ve researched the fund, we’ve come to agree that its strength is in a risk-conscious discipline and consistently strong execution of the strategy. There are no bells or whistles. The equity sleeve offers broadly diversified exposure to the domestic market, which noticeably more mid- and small-cap exposure but noticeably less direct international exposure than its peers. The fixed income sleeve targets mostly intermediate-term, high quality bonds. The asset allocation overlay allows for substantial changes in equity exposure, but significant tilts are infrequent. “We’re pretty slow moving on that,” Ms. Halper allows. “We’ve had 12 shifts since 2006, but exposure typically stays around 60-65%.”
That’s reflected in the fund’s high correlation to a 60/40 index; over the full market cycle, the correlation is .99.
Are there reasons for caution? Two occur to us.
First, long-term lead equity manager David C. Coughenour, a founding partner of CEP, resigned in January 2017. The equity team is now led by Robert Kramer, who has also managed the fund since 2000 and is also a founding partner at CEP. Given the fund’s reliance on quantitative screens and the team’s tenure, that risk seems manageable.
Second, the retail shares call an above-average expense ratio (1.09%) and expenses, as CEP itself notes in a white paper, matter. Expenses are, in part, a function of asset base: larger funds enjoy economies of scale which the best of them actively pass along to their investors. The picture is better when we compare MBEAX to other flexible funds with under a billion in assets; against that group, MBEAX is in the lowest-cost third. And, they might reasonably argue, “we’ve been earning our keep for a long time now.”
We agree.
Bottom Line
If you are willing to wager your financial security on the bet that the long bull markets in stocks and bonds, abetted by sensible and far-sighted actions being pushed by the president, will continue into the foreseeable future, you’re best served by a passive product that gives you naked exposure to those conditions. If you are increasingly dubious about how markets and economies will react to those same forces, you need to strongly consider entrusting a larger share of your assets to experienced, risk-conscious managers who’ve gotten it right in the past. The Chicago Equity Partners are one such set of managers.
Fund website
AMG Chicago Equity Partners Balanced