


“Put your trust in God but keep your powder dry.”
Oliver Cromwell, 1650, to the soldiers of the New Model Army as they prepared to forge an Irish river and head into battle.
Cromwell was a dour, humorless (or “humourless”) religious fanatic charged with squashing every Catholic and every independent thought in the British Isles because, well, that’s what God demanded. Famine, plague, deportations, mass death and deportations followed.
But even Cromwell knew that the key to victory was prudent preparation; faith did not win battles in the absence of the carefully stocked dry gunpowder that powered the army. There were time to charge ahead and there were times to gather powder.
With investing likewise: there are times to be charge ahead and times to withdraw. Most investors struggle with that decision. Why?
- Most investment products feed our worst impulses. The investment industry has come to be dominated by passive, fully-invested products over the past five years; not coincidentally, that period has seen just one break in the upward rush. In cap-based funds, more money goes to the best performing stocks in the index so markets get driven by the momentum of fewer and fewer stocks. In 2015, for instance, just four stocks accounted for the S&P 500’s entire gain.
- Most professional investors worry more about accumulating assets than about serving investors. By most measures, the U.S. stock market is substantially overpriced but the cash reserves at mutual funds are low; Morningstar gives the average domestic funds cash at 4.2%. Why? Because, as Jason Zweig writes, “cash is now a sin.” Cash is a drag on short-term returns and investors fixated on 1/3/5 year returns have poured their money into funds that are fully invested all the time, both index products and the cowardly “active” managers who merely shadow them. The technical term for “skilled investors who do not attract assets to the firm” is “unemployed.”
- Most of us are too optimistic. Most guys think of themselves as “good investors” or “above average” investors, mostly because “good” is such a vague term and almost none of us actually know how or what we’ve done. Quick quiz: what’s your personal rate of return over the last five years? How much of your portfolio was invested cautiously as the market approached its top in October 2007 and how much was invested aggressively at its bottom in March 2009? The honest answers for most of us are “dunno, dunno, dunno.”
It’s not just about investing. 95% of us think we’re above average drivers. One 1965 study of drivers responsible for car accidents that put people in the hospital found the same: the majority of those drivers rated themselves as “really good.” Stan Clark, a Canadian adviser, wrote a thoughtful little piece on the phenomenon.
The result is that we’re tempted to take on too much risk, sublimely confident that it will all work out.
But it won’t. It never does. You need a manager who’s got your back, and you need him now. Here are three arguments in three pictures.
Argument one: stock prices are too danged high.
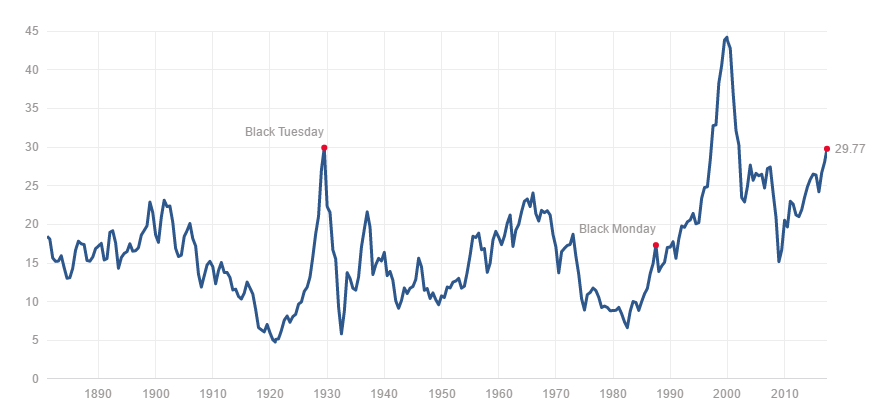
This chart shows valuation of the US stock market back to 1880; numbers get really sketchy before that. Valuation, on the left axis, is the CAPE P/E ratio which tries to adjust for the fact that earnings tend to be “lumpy” so it averages them over time. The “mean” or average value over 140 years is 16.8; as of late May 2017, we’re at 177% of the market’s long-term average valuation.
The U.S. market went over a CAPE P/E of 24 just three times in the 20th century; it’s lived there in the 21st. The market’s P/E at its February 2016 bottom was still higher than the P/E at its October 2007 top.
Argument two: Price matters.
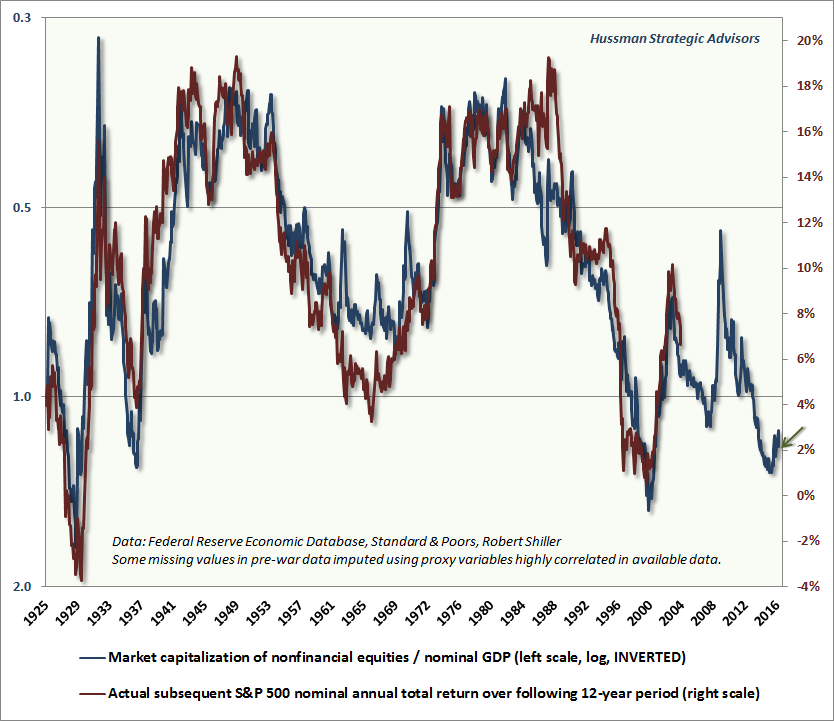
Thanks for Ryan Leggio of FPA for sharing this chart and John Hussman for creating it.
If you overpay for something, whether it’s $72 million for a “franchise quarterback” who’s only started seven NFL games ever or 211 years’ worth of earnings for a share of Netflix stock, you’re going to be disappointed.
The chart above reflects the stock market’s valuation (measured by the value of the stock market as a percentage of the value of the “real economy,” so when the blue line is high, stocks are relatively inexpensive) overlaid with its returns over the following 12 years. With considerable consistency, price predicts future returns. By this measure, U.S. stocks are priced to return 2% a year. The only ways for that number to go up is for the U.S. economy to grow at an eye-watering rate or for prices to come down. A lot. Based on the market’s performance over the past 60 years, the folks at the Leuthold Group find that a return to the valuations seen in the average bear market would require a fall of 27-35% from where we were at the end of April.
Vigorous economic growth, even if possible, would be a double-edged sword. It might serve to justify current prices but considerable disruption of Corporate America would be required to achieve it. Three researchers at Research Affiliates, Rob Arnott’s firm, wrote in late May 2017:
[T]he ‘Trump bump’ reveals market expectations of continuing public policies prioritizing stability, inhibiting creative destruction, depressing yields and wage growth, and inflating a profits bubble. If instead the Administration delivers reforms that allow creative destruction, invigorate growth, and raise returns to capital and wages, then the lofty profits of corporate incumbents will be at risk.
Argument three: Market collapses are scary
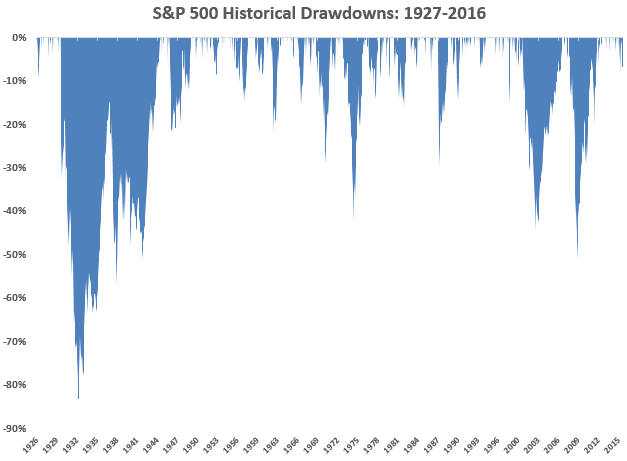 I think of this as “the icicle chart.” Ben Carlson, one of the Ritholtz managers, wrote a really thoughtful essay, rich in visuals, in April. He posted it on his Wealth of Commonsense blog under the name “180 years of market drawdowns.” He provided this graph as an antidote to those relentlessly cheerful logarithmic “mountain charts.” Those are the ones that show the stock market’s relentless climb with just niggling little “oopsies” from time to time. Losing half your portfolio is, viewed from the perspective of a few decades or a century, just a minor annoyance. Losing half your portfolio is, viewed from the perspective of a guy who needs to meet a mortgage, fund a college education and plan for the end of a teaching career, rather a bigger deal. Mr. Carlson concludes:
…stocks are constantly playing mind games with us. They generally go up but not every day, week, month or year. No one can predict what the future returns will be in the market … But predicting future risk is fairly easy — markets will continue to fluctuate and experience losses on a regular basis.
Market losses are the one constant that don’t change over time — get used to it.
The ideal approach is a strong contrarian discipline; famously, being fearful when others are greedy and greedy when others are fearful. As Mr. Zweig wrote in May 2017:
Having the cash and courage to buy from [panicking sellers] at bargain prices is a good way to raise your future returns. Not joining them as blind-faith buyers is an excellent way to reduce your risk, now and in the future.
Managers who’ve got your back
There are only a handful of managers left who take all of that seriously. The rest have been driven to unemployment or retirement by the relentless demand: fully invested, price be damned. They typically follow a simple model: stock by stock, determine a reason price for everyone in our investable universe. Recognized that stocks are risky, so buy them only when they’re selling at a healthy discount to that price. Hold them until they’re around full value, then move on regardless of whether their prices are still rising. Get out while the getting is good. If you can’t find anything worth buying today, hold cash, keep your powder dry and know that the next battle awaits.
They bear a terrible price for hewing to the discipline. Large firms won’t employ them since large firms, necessarily, value “sticky assets” above all else. 99.7% of the investment community views them as relics and their investors steadily drift away in favor of “hot hands.”
They are, in a real sense, the individual investor’s best friends. They’re the people who are willing to obsess over stocks when you’d rather obsess over the NFL draft or the Cubs’ resurgence. And they’re willing, on your behalf, to walk away from the party, to turn away from the cliff, to say “no” and go. They are the professionals who might reasonably claim …

This chart reflects every equity-oriented mutual fund that currently has somewhere between “a lot” and “the vast majority” of their portfolio in cash, awaiting the return of good values. Here’s how to read it. The first two columns are self-explanatory. The third represents how their portfolios have been repositioned between 2011 (when there are still reasonable valuations) and now. Endurance, for example, had two-thirds of its money in stocks in 2011 but only a seventh invested now. The fourth column is fund’s annual return for the period noted (full market cycle or since inception). The fifth shows the fund’s Sharpe ratio, a measure of risk-adjusted returns, against its peers. The sixth column shows you how it’s performed, again relative to its peer group, in bear market months. The last column is the comparison time frame. I’ve marked decisive superiority in blue, comparable performance in amber and underperformance in red. All date is month end, April 2017.
| Style | Change in equity exposure from 2011 – 2017 | Annual return | Sharpe ratio, compared to peers | Bear market rating, compared to peers | Comparison period | |
| Intrepid Endurance ICMAX | Small-cap value | 64%->16% | 7.7% | 0.65 vs 0.31 | 1 vs 6 | FMC |
| FPA Crescent FPACX | Flexible | 57 -> 54 | 6.9 | 0.65 vs 0.33 | 4 vs 6 | FMC |
| Bruce BRUFX | Flexible | 41 -> 50 | 7.0 | 0.57 vs 0.33 | 4 vs 6 | FMC |
| Centaur Total Return TILDX | Equity-income | 89 -> 32 | 7.7 | 0.56 vs 0.39 | 1 vs 5 | FMC |
| FMI Common Stock FMIMX | Small-cap core | 88 -> 81 | 9.1 | 0.51 vs 0.34 | 1 vs 6 | FMC |
| Weitz Partners III Opportunity WPOIX | Multi-cap growth | 67 -> 57 | 7.9 | 0.50 vs 0.34 | 1 vs 6 | FMC |
| Pinnacle Value PVFIX | Small-cap core | 51 -> 55 | 4.7 | 0.49 vs 0.34 | 1 vs 6 | FMC |
| Intrepid Disciplined Value ICMCX | Mid-cap value | 81 -> 48 | 5.9 | 0.43 vs 0.35 | 1 vs 6 | FMC |
| Shelton Core Value EQTIX | Equity income | 100 -> 74 | 6.8 | 0.42 vs 0.39 | 6 vs 5 | FMC |
| Hennessy Total Return HDOGX | Large-cap value, Dogs of the Dow | 73 -> 48 | 4.0 | 0.30 vs 0.30 | 1 vs 5 | FMC |
| Frank Value FRNKX | Mid-cap core | 83 -> 36 | 4.9 | 0.25 vs 0.37 | 1 vs 6 | FMC |
| Bread & Butter BABFX | Multi-cap value | 69 -> 68 | 3.2 | 0.22 vs 0.31 | 1 vs 5 | FMC |
| Funds with records >5 years but less than the full market cycle | ||||||
| Cook & Bynum COBYX | Global large-cap core | 67% -> 64% | 9.1% | 1.18 vs 0.74 | 1 vs 6 | 08/2009 |
| Castle Focus MOATX | Global multi-cap core | 67 -> 70 | 8.1 | 1.14 vs 0.74 | 1 vs 5 | 08/2010 |
| Chou Opportunity CHOEX | Flexible | 74 -> 60 | 3.6 | 0.18 vs 0.79 | 10 vs 6 | 08/2010 |
| Two plausible benchmarks | ||||||
| Vanguard Total Stock Market VTSMX | Multi-cap core | 100 -> 100 | 7.1% | 0.42 | 4 | FMC |
| Vanguard Balanced Index VBINX | Hybrid | 60 -> 60 | 6.2% | 0.61 | 1 | FMC |
No single measure is perfect and no strategy, however sensible, thrives in the absence of a sufficiently talented, disciplined manager. This is not a “best funds” list, much less a “you must buy it now, now, now!” list.
Bottom Line: being full invested in stocks all the time is a bad idea. Allowing greed and fear, alternately, to set your market exposure is a worse idea. Believing that you, personally, are magically immune from those first two observations is the worst idea of all.
You should invest in stocks only when you’ll be richly repaid for the astronomical volatility you might be exposed to. Timing in and out of “the market” is, for most of us, far less reliable and far less rewarding than finding a manager who is disciplined and who is willing to sacrifice assets rather than sacrifice you. The dozen teams listed above have demonstrated that they deserve your attention, especially now.