


In last month’s commentary, David challenged readers to review their portfolios and be sure they understand how bad it could get when markets head south. “There’s a break in the rain. Get up on the roof!” he’ll often advise. He shared his own portfolio, which maintains a modest 50/50 stock/bond allocation. He estimated his drawdown to be 30% for perhaps three to five years, using the bear market of 2008 as guide. A look back at US market volatility since 1926 helps provide further insight into the question of just “How Bad Can It Get?”
The results presented below use the monthly database maintained by Amit Goyal, the same database referenced in Timing Method Performance Over Ten Decades, but updated as appropriate from January 1960 through April 2017 with our Lipper Data Feed Service. The three principal indicies modeled are S&P 500 Monthly Reinvested Index, Bloomberg Barclays US Treasury Long Total Return Index, and US 3-Month Treasury Bill Total Return Index.
By far the largest and most devastating bear market over the past 10 decades occurred during The Great Depression, as depicted below:
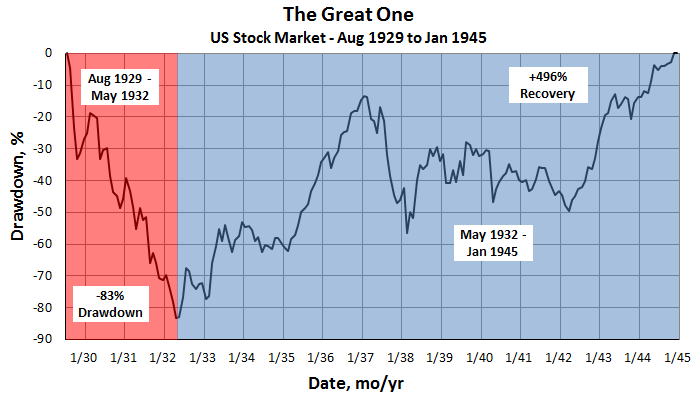

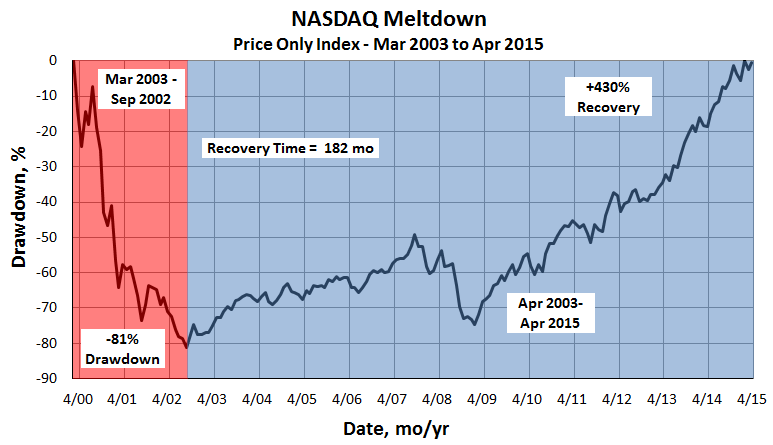
Only a heavy dose of bonds insulated investors from the gut-wrenching drawdown. In its aftermath, numerous safeguards were established to help prevent such economic catastrophes, beginning with Roosevelt and America’s New Age. But then you never know … Though the scale was narrower, fortunately, the NASDAQ meltdown reflects scarily similar numbers, beginning less than 20 years ago:
Cambria’s Meb Faber writes often of market bubbles, old and new, broad and narrow (eg., Japan in ‘90s, cryptocurrency). Nonetheless, let’s have a little faith and focus on broader US market beginning in January 1932. Using month ending stock data, we find 11 bear markets, each defined when the market retracts from its previous peak by 20% or more. The table below summarizes the drawdown for each of the bear periods, along with beneficial impact of allocating a portion of one’s portfolio to bonds. (Since -20% represents a common pain threshold, those periods are highlight in red in all tables.)
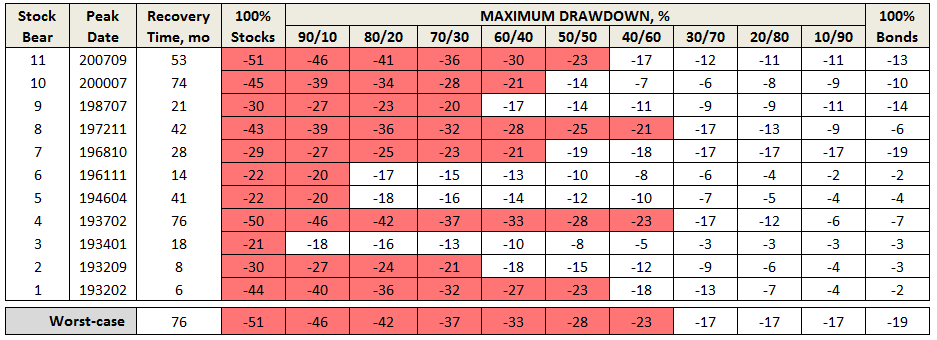
Five times since 1932, about half of all bears, the broad equity market has retracted 40-50% and remained underwater up to 76 months, or more than six years! Three other times, equities were down 30%. Bottom-line: if you are heavily invested in equities, brace for a drawdown of 30-50% during the next bear market. That means chances are very likely the Fidelity monthly statement on your retirement savings, which now reads say $150,000, will be below $100,000, or even just $75,000.
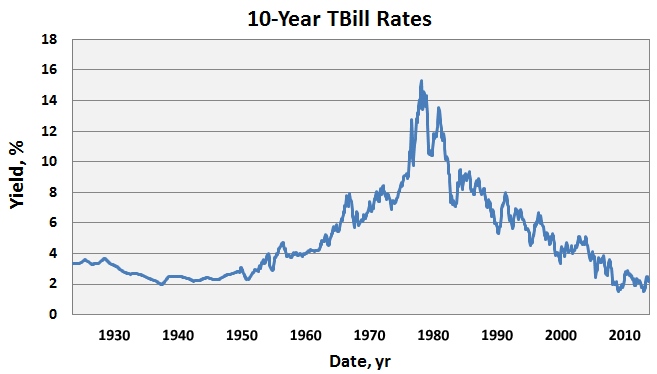
Thoughtful MFO Discussion Board contributor bee writes of the beneficial allocation to bonds, like TLT or EDV as “portfolio insurance” … “flight to safety” when stock markets head south. For most of the equity bear markets since 1932, it certainly appears to be the case. A review shows only once have bonds retracted more than 20% … and just that. It occurred when rates spiked in the late 1970’s:

Finally, we take a closer look at worst-case drawdown scenarios, not by bear periods, but by stock/bond portfolio allocation, again since 1932. In addition to maximum drawdown, the table also provides other attendant risk and return metrics:
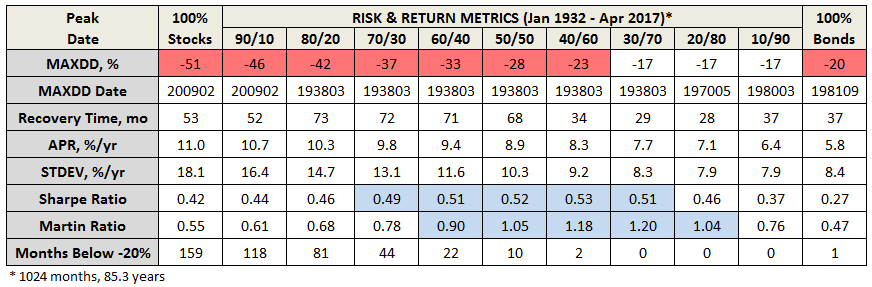
Extraordinary that highest Sharpe, which measures excess return (over cash) versus volatility, a kind of “gain for pain” metric, is highest for portfolios with stock/bond allocations of between 70/30 and 30/70, which is precisely the range legendary investor Jack Bogle likes to target, as shared at the recent Morningstar conference.
Similarly for Martin, which measures same return but versus drawdown (or the so-called Ulcer Index), results are highest for portfolios with stock/bond allocations of between 60/40 and 20/80. Our Discussion Board colleague teapot believes that the higher the Martin, the less chance of investors bailing when things get tough.
Ben Graham touted the 50/50 portfolio in the Intelligent Investor. Over the 85 year evaluation period examined in this piece, longer than the average lifespan, a simple 50/50 stock/bond (eg., SPY/TLT) portfolio delivered nearly 9% per year while breaking the -20% pain threshold for less than a year. Something to think about, even as we anticipate increasing rates.