
From the Mutual Fund Observer discussion board, November 2012
Several recent posts prompted me to take a closer look at DODGX historical performance. Ted posted the most recent: Dodge & Cox: The San Francisco Treat. Basically, an article from Morningstar defending why D&C has been a top pick for years, based on a strong corporate fiduciary culture and long term record, despite its struggle in 2008 and poor stock selections since, like HPQ, a DODGX heavy for years. hank and Shostakovich made good comments about AUM, definition of value, intrinsic risk management, and debated whether a better approach for a value shop is to be all-in or have some assets in cash at times.
An earlier post: 3 Former Star Funds to Avoid, a stunner by Steve Goldberg, which challenged DODGX exalted status, pointing to “deep flaws in the fund’s stock picking” in 2008 and mediocre performance since. The article took its share of lashings from most, but not all, MFO readers.
I lamented a bit on an earlier related post: Dodge & Cox Balanced Regains Its Stride, Finally? A look back at my decision to buy DODBX over VWELX in 2002. This post includes more recent entries describing HPQ’s 13% plunge on Oct 3. scott weighed in on transient nature of defining value for technology companies. (This week HPQ had another 12% downer-day on suspected fraud disclosure over recent acquisition. Can you believe? This is Hewlett Packard for crying out loud. Good grief.) And fundalarm noted how Dodge & Cox doesn’t appear to “have price targets at which point to book profits or cut losses,” which again brings into question D&C’s risk management philosophy.
OK, stage set. I was very interested in looking at DODGX from a perspective both before and after the real estate collapse in 2008. With David’s assertion that folks are more concerned about loses than gains, and VintageFreaks’ comment about it’s “WHEN you buy, not WHAT you buy,” I looked at worst-case rolling performance, initiated every month over the periods noted, from DODGX’s inception in Feb 65.
The figure below illustrates one reason why everybody was clamoring to own shares in DODGX before 2008. Basically, its worst-case return beat SP500’s worst-case return consistently over just about any period:
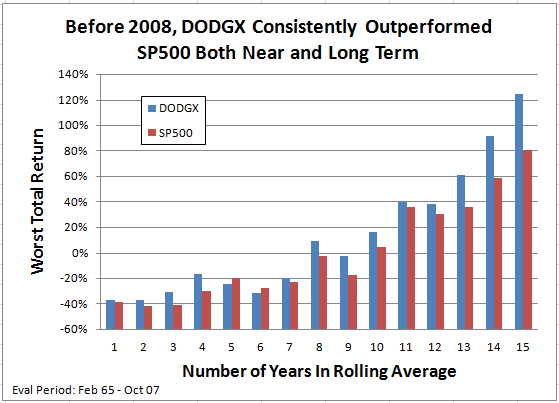
Note also that DODGX lost virtually no money for any 8-year or longer period, whereas an unlucky investor in SP500 could still be looking at nearly 20% loss, even after 9 years.
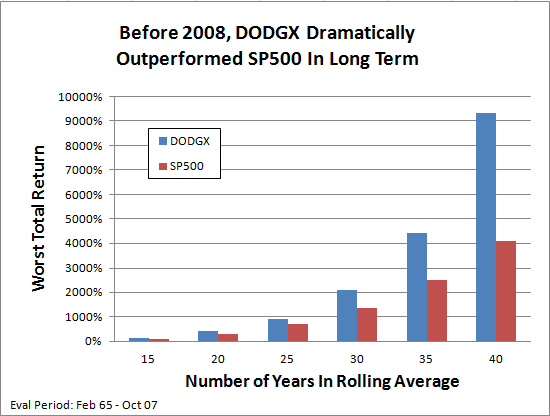
Even longer term, depicted below, DODGX trounced SP500. Basically, the worst period for DODGX was substantially better than the worst period for SP500.
After 2007, however, an investor could have worse return in near-term with DODGX than with SP500:
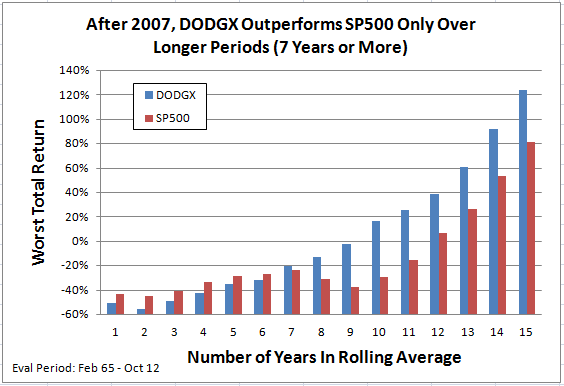
But despite this near-term under-performance, an investor with DODGX for periods of about 9 years or more has still never lost money, even periods including 2008, whereas SP500 investors must have invested for periods of 12 years or more to avoid loss.
OK, so that is worst-case DODGX versus worst-case SP500.
Next, I compared DODGX relative to SP500 for same rolling periods. Basically, wanting to see, depending on WHEN, whether it was better to be in DODGX or SP500. So, below are comparisons of DODGX best and worst total returns relative to SP500 for rolling periods dating back to Feb 65 through to present Oct 12:
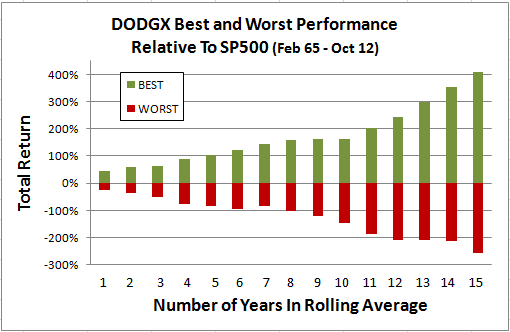
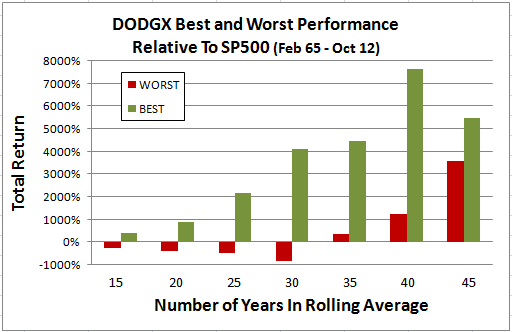
Clearly, there are periods when DODGX has under-performed the SP500, especially over the short-term. But then its periods of over-performance tend to be more impressive. Over its life, DODGX has bested the SP500 hands-down.
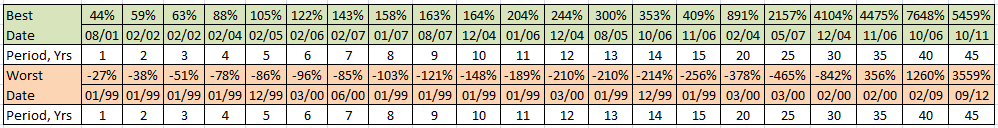
Taking a closer look at WHEN, data from above two charts are tabulated below, along with ending month/year of the corresponding best and worst periods. At a glance, most of the best over-performance were during periods leading up to the real estate bubble in 2008, while most of the worst under-performance actually occurred in the years leading up the tech bubble in 2000.
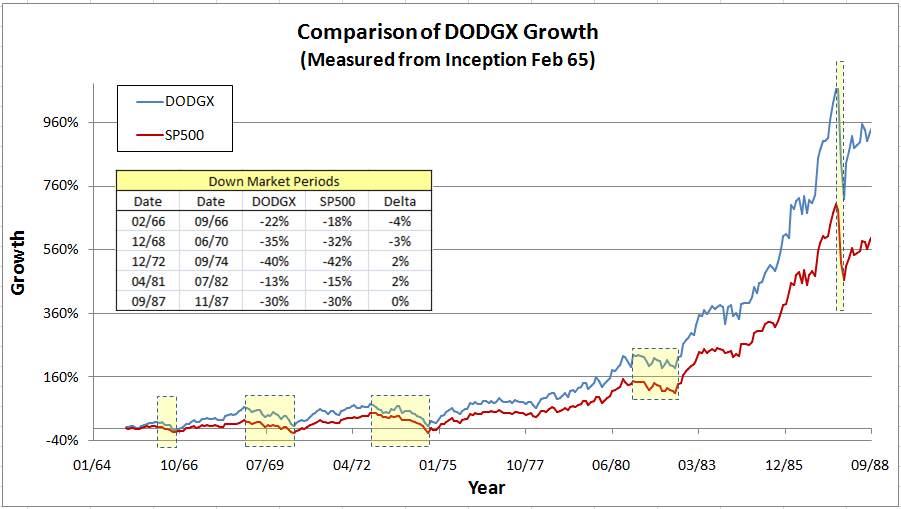
Going still further, the chart below shows growth comparison from DODGX inception through 1987 market crash. Basically, for first 20 plus years of DODGX existence, it beat SP500 handsomely overall. Perhaps more important is that DODGX performed comparable to the market, within 2-4%, during the five or so significant down-markets during this time.
Then, during the next 20 years, shown below, DODGX had its most extraordinary performance, which surely helped establish the many recommendations for DODGX, by M*, Kiplinger, and others.
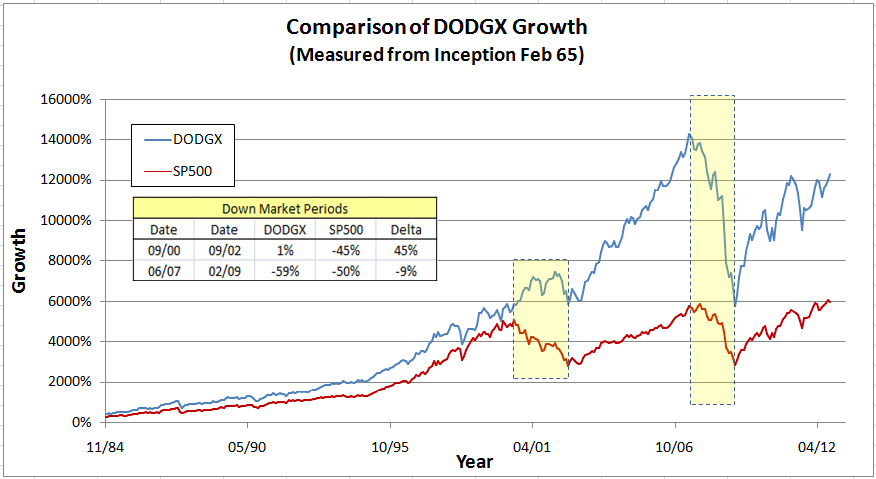
Leading up to late ’90s, DODGX actually lagged the SP500 somewhat; in fact, that’s where its worst total returns relative to SP500 actually occurred. But when the tech bubble popped in 2000, DODGX sailed-on through. While the SP500 lost 45% in the down-market from Sep 00 through Sep 02, DODGX lost nothing. In the five years after the bubble, it continued to handsomely beat the SP500. No doubt, DODGX’s stellar reputation was born during this extraordinary period of performance. Everybody clamored to get in, AUM grew, and the fund closed. It had become the perfect equity fund, avoiding down-side losses, while over-performing in up-markets. Until, of course, 2007. The funny thing here is that DODGX lost only 9% more than the SP500 during the great recession, but its reputation–that of being the perfect equity fund–was tarnished, if not shattered.
Just a few more comparisons, and I will stop, promise.
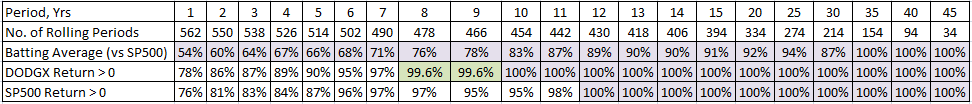
The tabulation below shows a “batting average,” basically number of times DODGX beat SP500 in rolling periods considered since Feb 65. On any given year, it has beaten SP500 more than 50% of time. More than 60% in any 2-year period. More than 70% any 7-year period. More than 80% in any 10-year period.
The tabulation also shows the number of these periods that DODGX and SP500 have lost money. Since Feb 1965, SP500 has never lost money over any 12 year period or longer. DODGX has never lost money over any 10-year period. A closer look shows that it only lost 2% in its worst case 9-year period. In fact, there were only two 8-year periods out of 478 considered that DODGX lost money: the period ending Feb 09 when its total return was -13.2% and Mar 09 when it was -4.2%.
Here is link to original thread.