
From the Mutual Fund Observer discussion board, December 2012, compiled from original five parts
Wise advice by MJG in the recent post “Will you revise your fund holdings going into 2013, regardless of “fiscal cliff”, etc.?” got me thinking…
He said, “The accumulated data finds that only a small percentage of wizards beat their proper benchmarks annually, and that percentage drops precipitously as the time horizon is expanded. Superior performance persistence is almost nonexistent.”
So I dug into it a bit. Here are the results, divided into five sections: Summary, Equity, Asset Allocation, Fixed Income, and Money Market.
Summary
The table below summarizes how many funds have beaten the market since their inception (or since Jan 1962, as far back as my Steele Mutual Fund Expert database goes). I used only whole months in the calculations so that I could be consistent with two market benchmarks, the SP500 total return (since 1970, price only before) and the 30-day Treasury Bill.
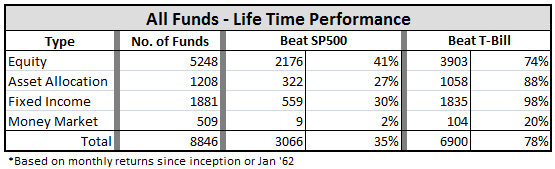
Nearly 9000 mutual funds and ETFs were evaluated. I used load adjusted returns and only the oldest share class. I apologize to the bench mark police for using only SP500 and T-Bill. Nonetheless, I find the results interesting.
First, MJG is right. Less than half of all equity funds have beaten the SP500 over their life times; in fact, one in four have not even beaten the T-Bill, which means their Sharpe Ratios are less than zero!
Second, nearly all fixed income funds have beaten T-Bill performance, which is re-assuring, but fuels the perception that you can’t lose money with bonds. The money market comparison is a bit skewed, because many of these funds are tax exempt. Still, expense ratios must be having their negative effect as only one in five such funds beat the T-Bill.
Digging a bit further, I looked at how the funds did by inception date. Here is a result I can’t yet explain and would ask for the good help on MFO to better understand. It seems like the period from 1998 to 2002, which book-end the tech bubble, is a golden age, if you will, for funds, as more than 60% of the funds initiated during this period have beaten the SP500 over their life times. That’s extraordinary, no? I thought maybe that it was because they were heavily international, small cap, or other, but I have not yet found the common thread for the superior performance.
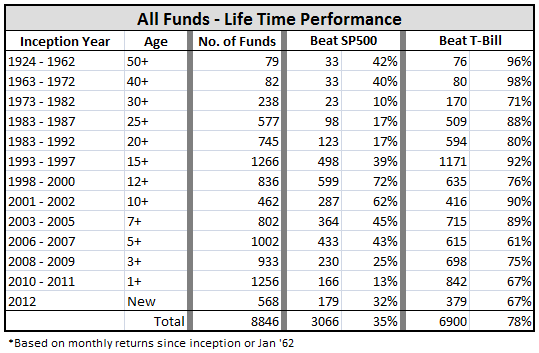
On the other hand, the period from 1973 to 1982 was abysmal for funds, since only one in ten equity funds created during these years have beaten the SP500 over their life times. And it is not much better between 1983 and 1992.
I next broke-out this same performance by type: equity, asset allocation, fixed income, and money market:
Note that fixed income funds helped contribute to the “golden period” as more than a quarter of those incepted between 1998 and 2000 beat the SP500.
Some other interesting points:
- Relatively few money market funds have been created since the cash bull run of the ’80s.
- But otherwise, fund creation is alive and well, with nearly 2000 funds established in the past three years, which accounts for one fifth of all funds in existence.
- Fixed income fund performance has dropped a bit this year with 15 out of 100 losing money.
I next looked at the best and worst performers in their respective time frames.
Best being top three funds, typically, producing highest APR relative to SP500 for equity and asset allocation types and relative to T-Bill for fixed income and money market types, color coded purple. Best also includes funds with highest Sharpe Ratios, color coded blue, when different from top APR funds. Again, I tried to pick three if there were enough funds for the inception period evaluated. Worst being relative APR, color coded yellow.
I included other notables based on David’s fund profiles (there are nearly 70 in the index), suggestions by other MFO folks, a few runner-ups, and some funds of my own interest.
First up, equity funds…
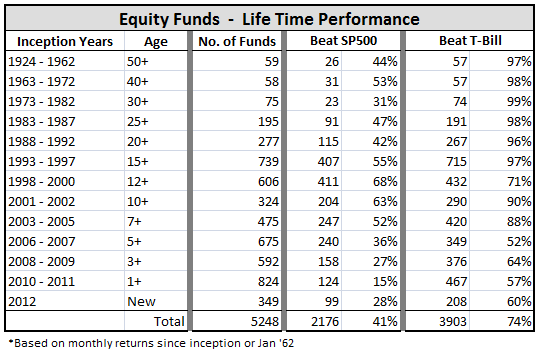
Equity Funds
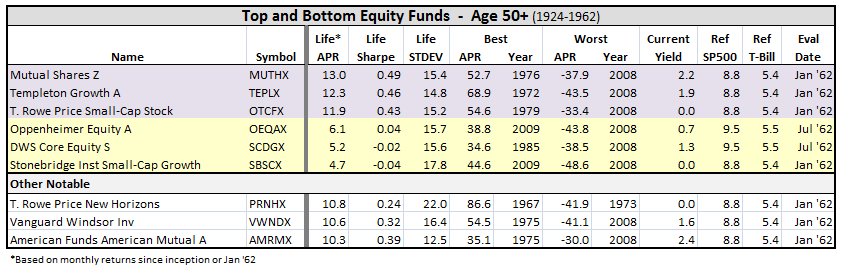
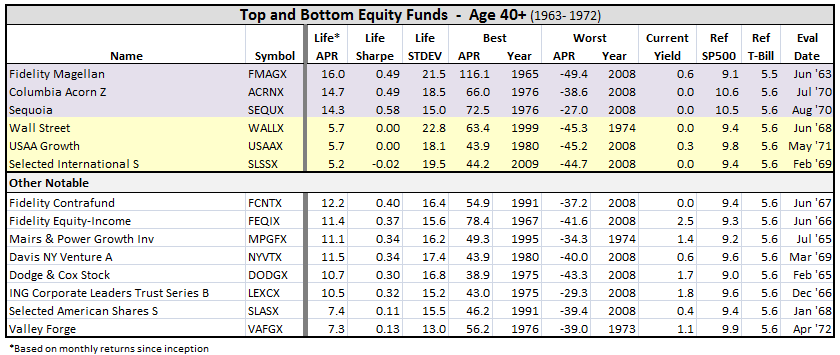
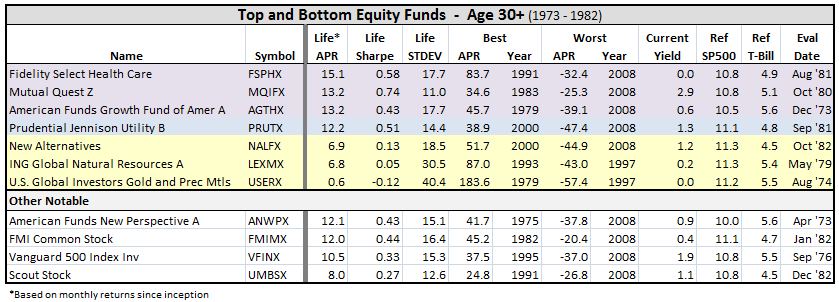
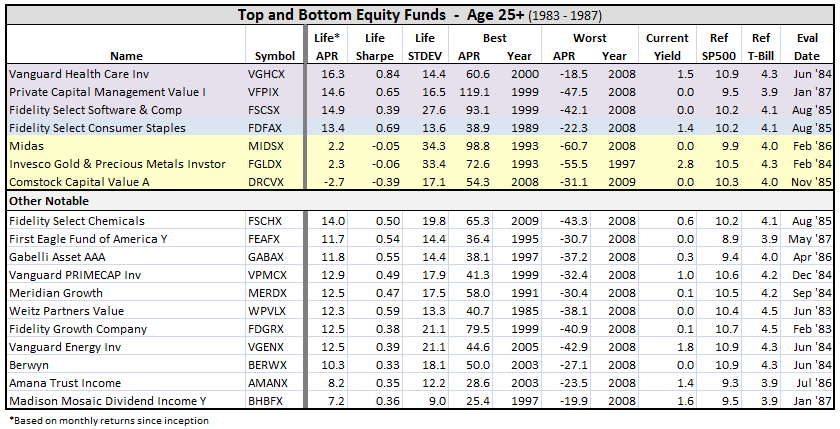
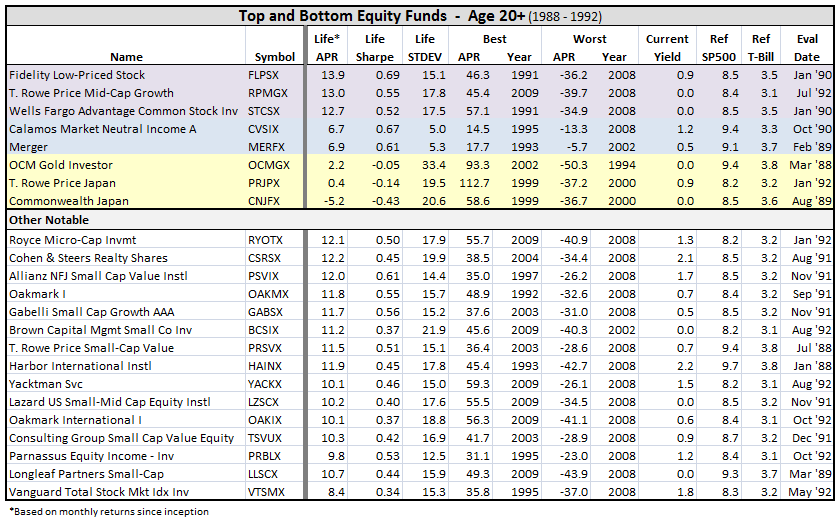
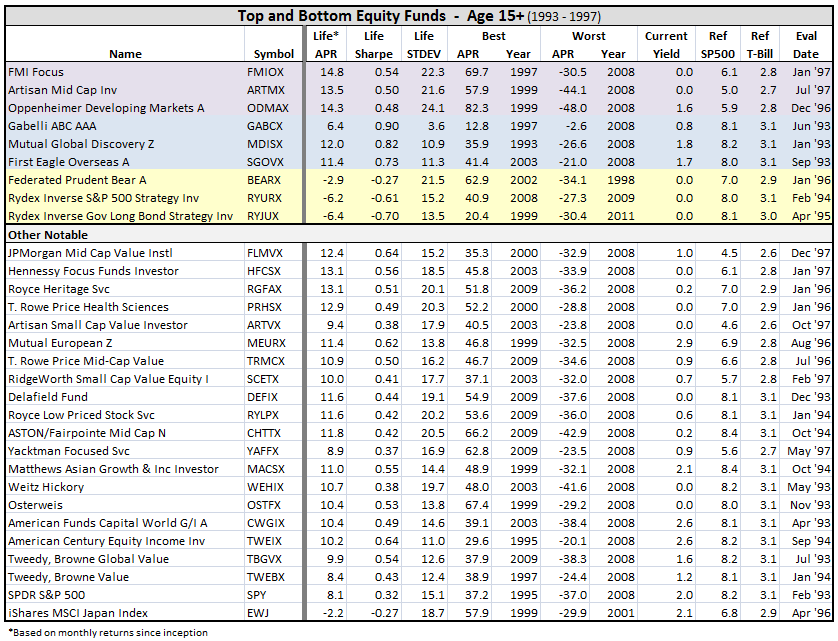
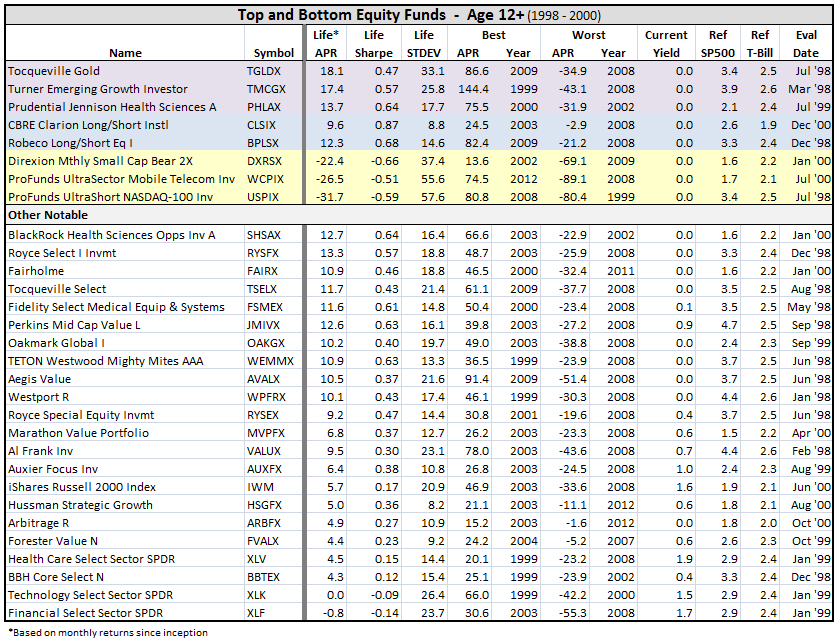
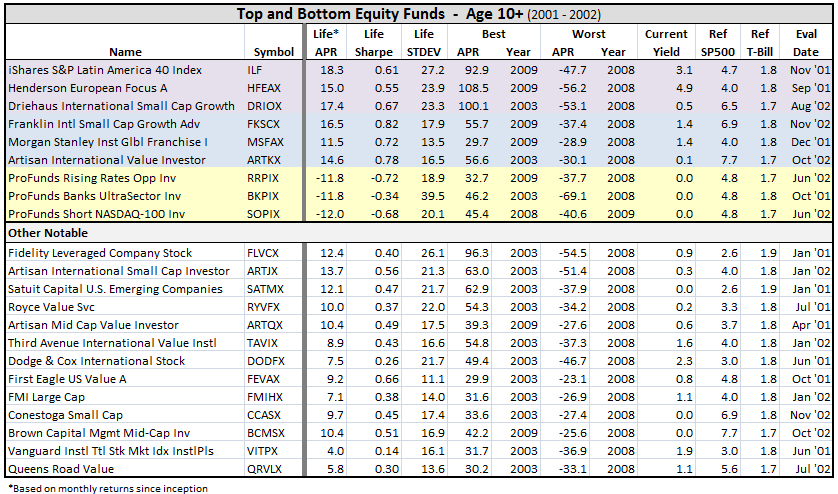

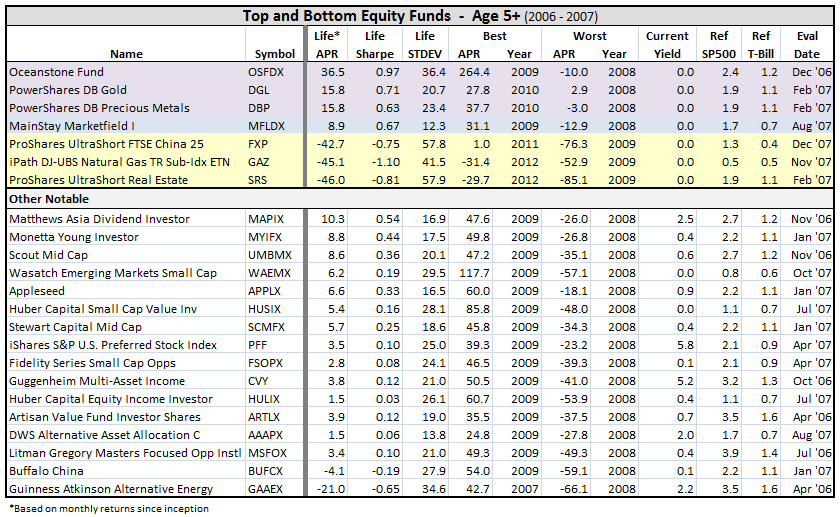
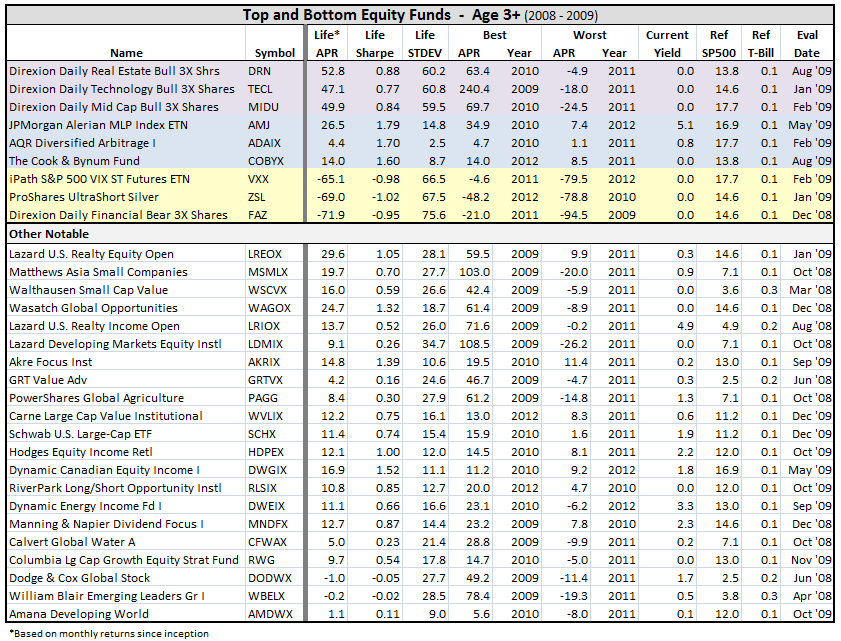
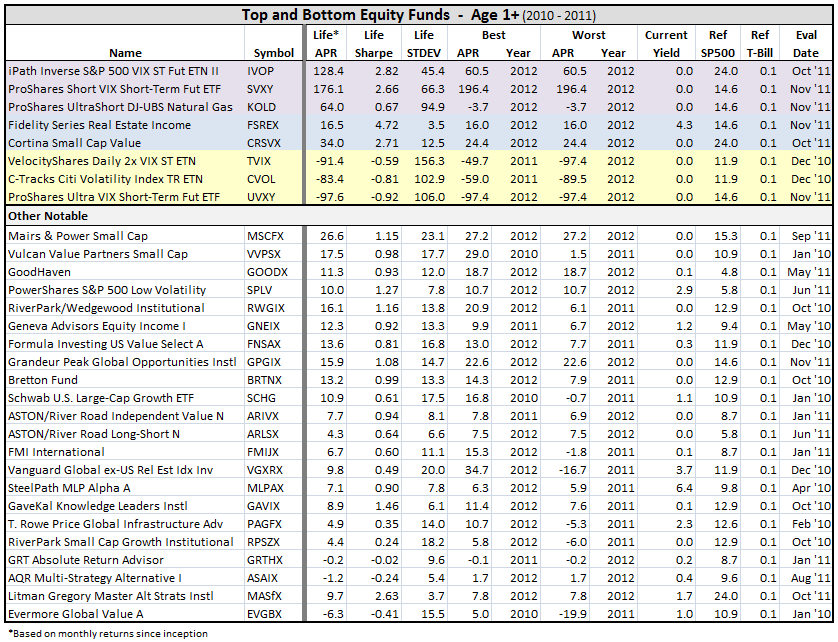
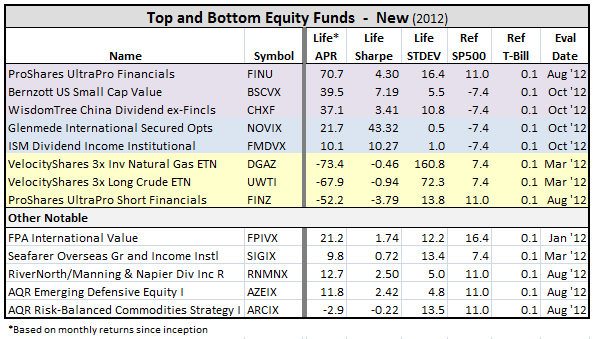
Some items that jump out:
- ETFs take top and bottom APR slots in recent years, but their volatility is frighteningly high.
- If you invested $10,000 in Fidelity Magellan Fund FMAGX in June of 1963 (fourteen years prior to Peter Lynch’s rein), you are looking at more than $15 million today. Can you believe? Of course, to MJG’s point, the fund’s best years were in the ’60’s when it had two 10er years, then again during Lynch’s reign from 1977 to 1990, when it averaged more than 29% APR. Unfortunately, you have less money today than you did in 2000.
- Oceanstone Fund OSFDX made all its gains in 2009 with an extraordinary 264% return. That said, it avoided the 2008 financial collapse with only a -10% loss versus -37% for the SP500, and it retains the highest Sharpe Ratio of ALL funds five years or older, except PIMCO Equity Series Long/Short Institutional PMHIX. And, the mysterious OSFDX is up about 21% YTD or 7% higher than the SP500.
- Four notable funds score top life time Sharpe Ratio for their periods, but did not beat the SP500: Calamos Market Neutral Income A CVSIX and Merger MERFX, both 20+ year funds, Gabelli ABC AAA GABCX, a 15+ year fund, and AQR Diversified Arbitrage I ADAIX, a 3+ year fund. I would think all would be considered as alternatives to bond funds. (Note: MERFX and GABCX are both no load and open to new investors.)
- Similarly, Pinnacle Value PVFIX from the 7+ year class, MainStay Marketfield I MFLDX from the 5+ year class, and The Cook & Bynum Fund COBYX from the 3+ year class all have superior life time Sharpe performance with STDEVs less than SP500.
- On the other hand, Evermore Global Value A EVGBX is not yet living up to expectations. It was first reviewed on MFO in April 2011. Guinness Atkinson Alternative Energy GAAEX is doing downright terribly. It was first reviewed in FundAlarm in September 2007.
Next up, a review of asset allocation…
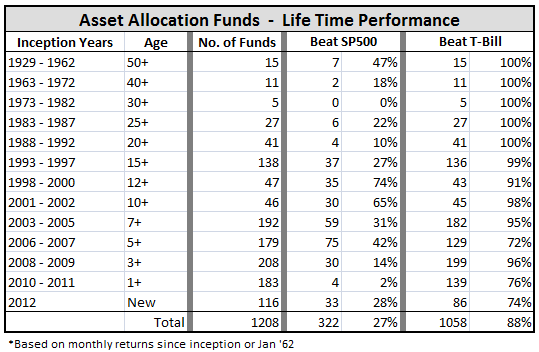
Asset Allocation Funds
Asset allocation or so-called balanced funds, of which there are more than 1200 (oldest share class only). This type of fund can hold a mixed portfolio of equities, bonds, cash and/or property.
I followed consistent methodology used for the equity funds.
Again, I realize that balanced funds do not use either SP500 or T-Bill as a benchmark, but nonetheless I find the comparison helpful. More than one in four such funds actually have beaten the SP500 over their life times. It’s a bit re-assuring to me, since these funds typically have lower volatility. And, nearly nine in ten have done better than cash.
In the tabulation below, purple means the fund was a top performer relative to SP500 over its life time, blue represents highest Sharpe (if not already a top APR), and yellow represents worst performing APR. I included other notables based on David’s commentaries, past puts by catch22, scott, and other folks on MFO, and some funds of my own interest.
Here’s the break-out, by inception date:
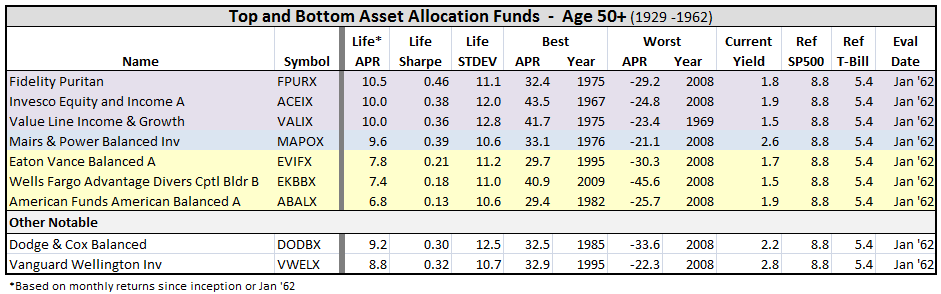
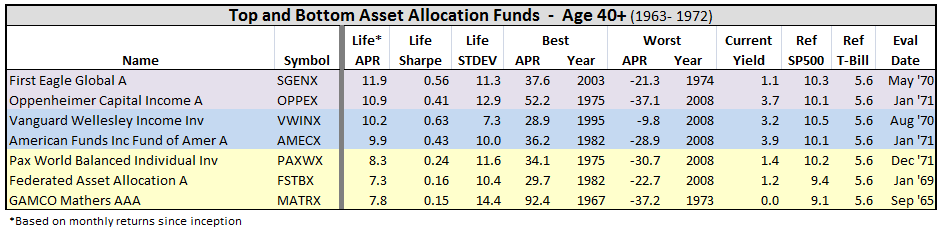
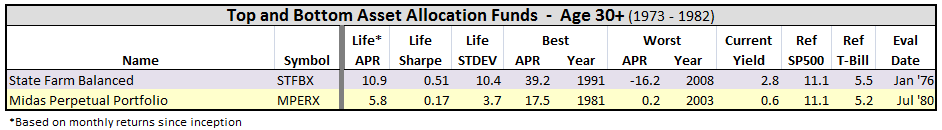
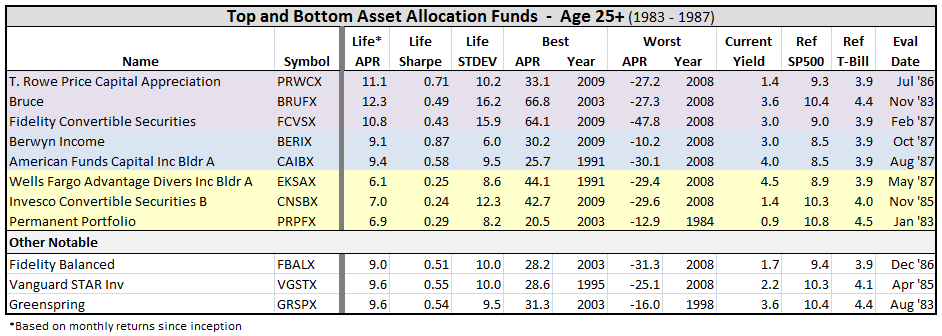
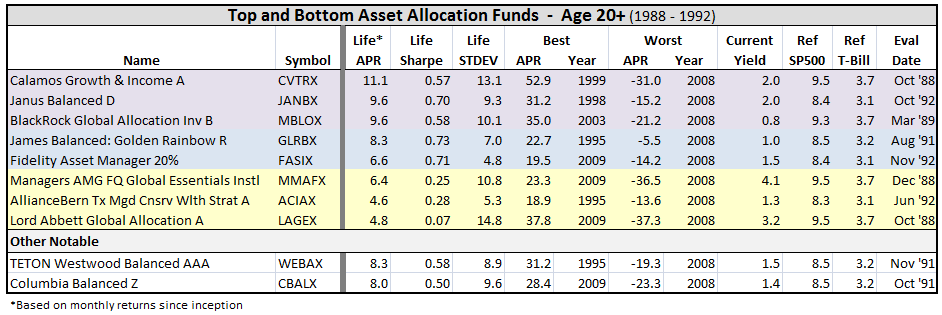
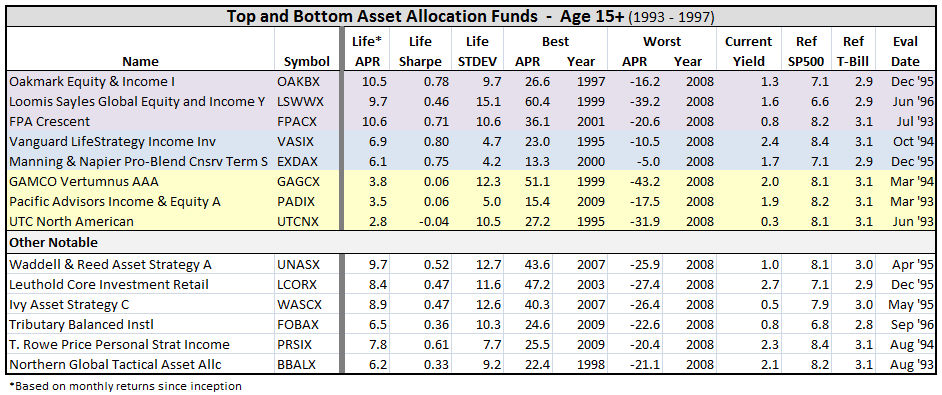
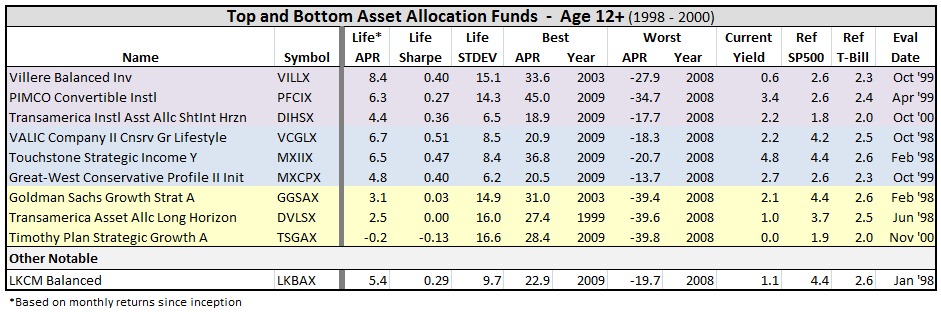
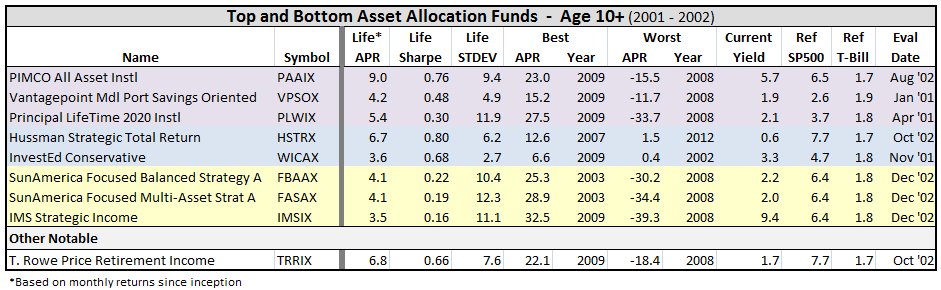
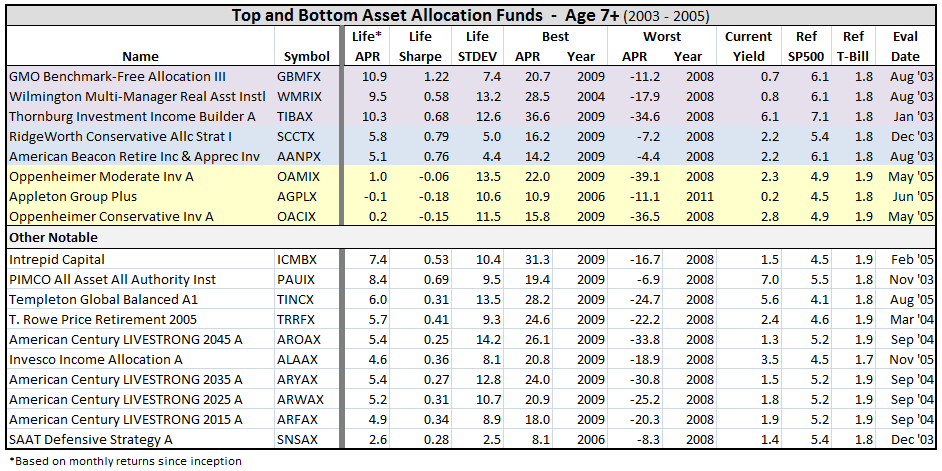
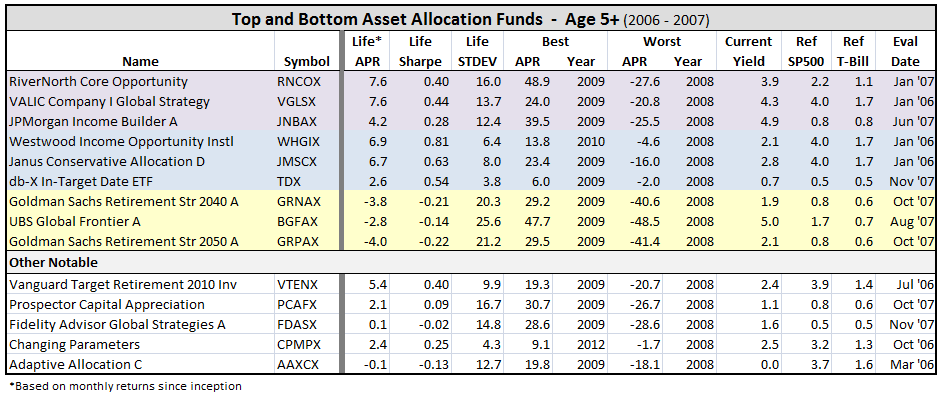
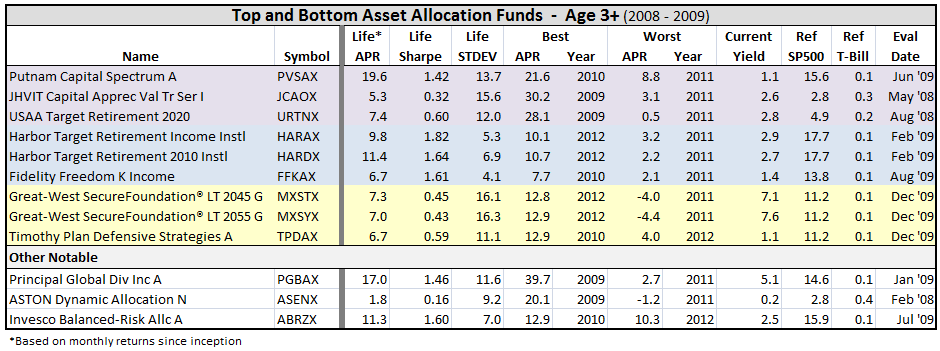
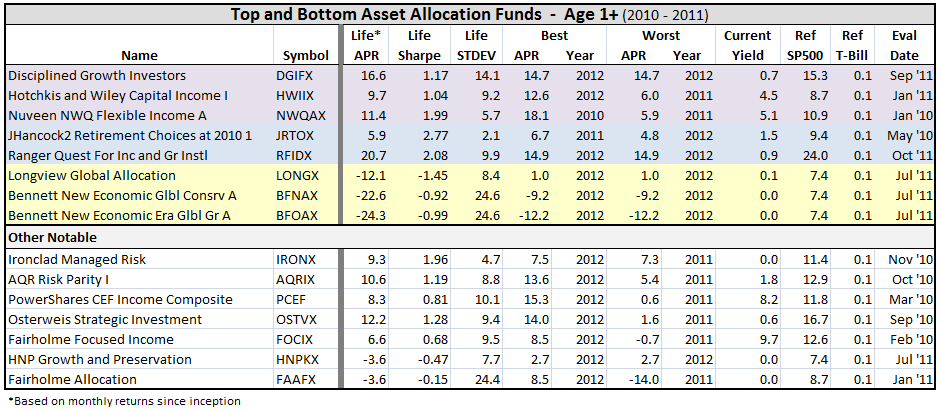
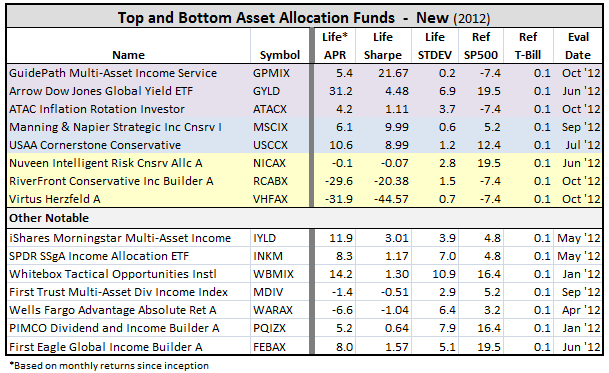
Some observations:
- If you invested $10K in Mairs & Power Balanced MAPOX in Jan 1962, you would have more than $1M today and nearly four times more than if you had invested in American Funds American Balanced ABALX. But ABALX has $56B AUM, while the five star MAPOX has attracted less than $300M.
- Value Line Income & Growth VALIX does not even warrant coverage by M*.
- 2008 was a really bad year.
- Some attractive ETFs have started to emerge in this generally moderate fund type, including iShares Morningstar Multi-Asset Income IYLD.
- Putnam Capital Spectrum A PVSAX, managed by David Glancy, has outperformed just about everybody in this category since its inception mid 2009.
- RiverNorth Core Opportunity RNCOX, first reviewed on MFO in June 2011, has had a great run since its inception in 2007. Unfortunately, its availability is now limited.
Next up, fixed income funds.
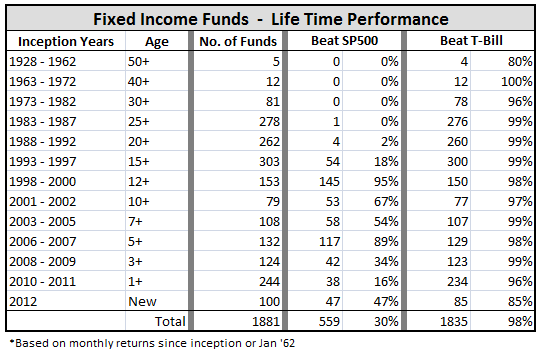
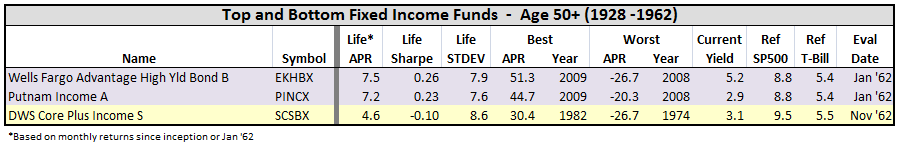
Fixed Income Funds
A review of fixed income funds, which for this post includes funds that invest in government or corporate bonds, loan stock and non-convertible preferred stock. This type of fund has been getting considerable attention lately on MFO with a growing concern that investors could be lulled into false sense of security.
To recap a little, there are about 1880 funds of this type, of which 30% have actually delivered higher life-time returns than the SP500, and more importantly and relevant, 98% have beaten cash.
In the tabulation below, purple means the fund was a top performer relative to T-Bill over its life time, blue represents highest Sharpe (if not already a top APR), and yellow represents worst performing APR. I included other notables based on David’s profiles, numerous suggestions in the various threads by MFO readers (bee, catch22, claimui, fundalarm, hank, Hiyield007, Investor, johnN, MaxBialystock, MikeM, Mona, msf, Old_Joe, scott, Shostakovich, Skeeter, Ted and others), and some of my own interest.
A reminder that I only used oldest share class, so for popular funds like PONDX, you will find PONAX, similarly MAINX is MINCX, etc.
Here’s the break-out, by fund inception date:
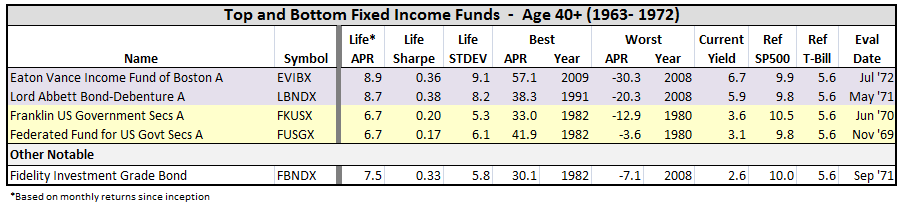
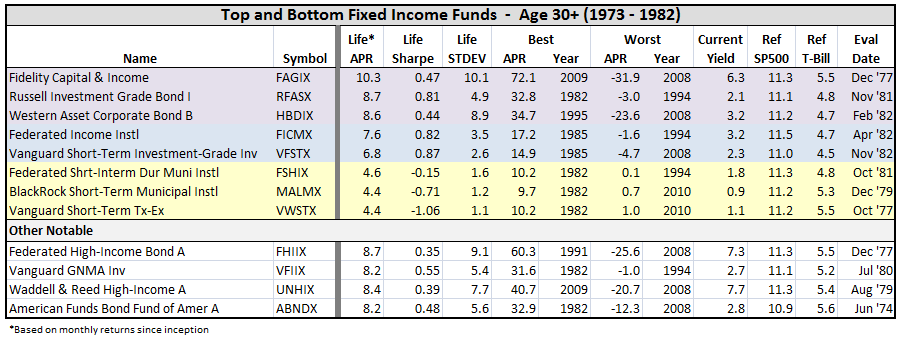
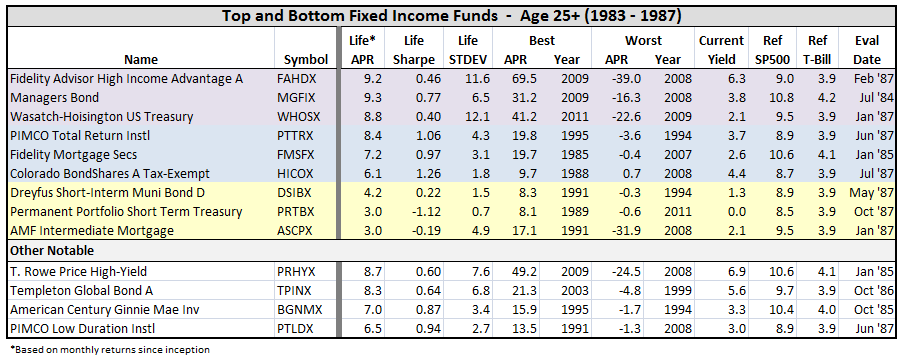
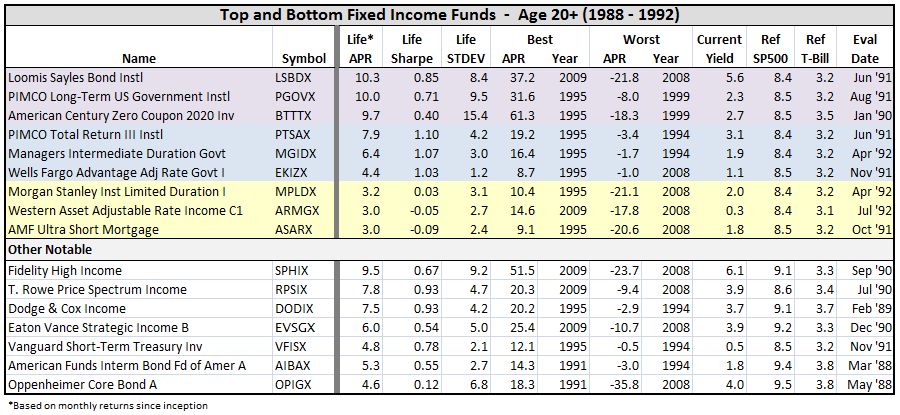
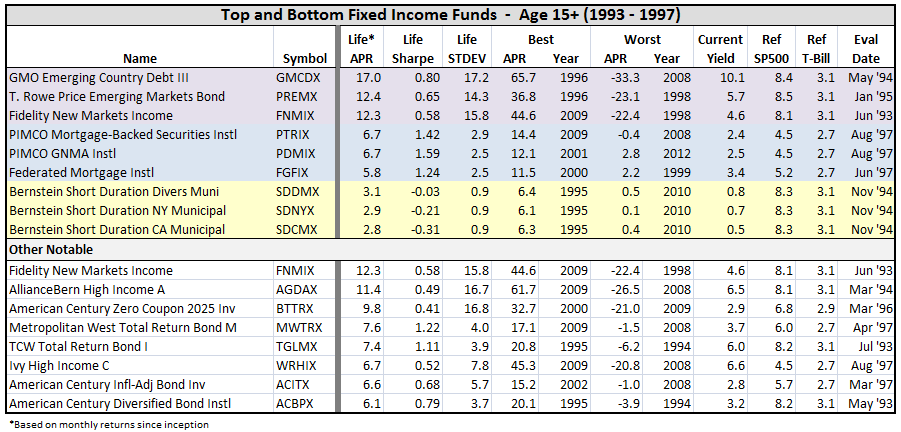
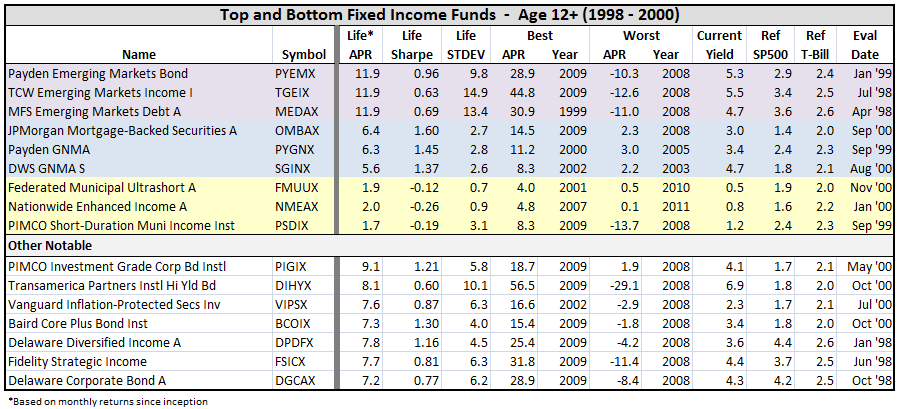
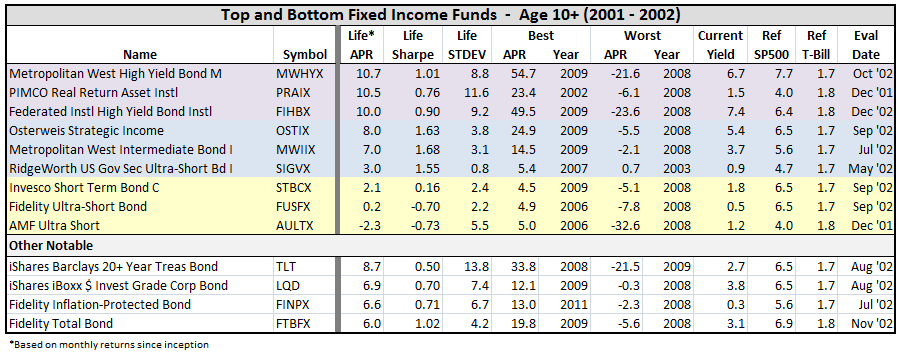
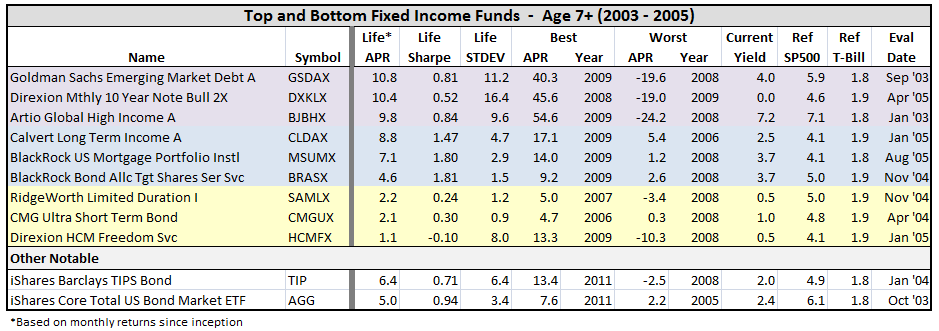
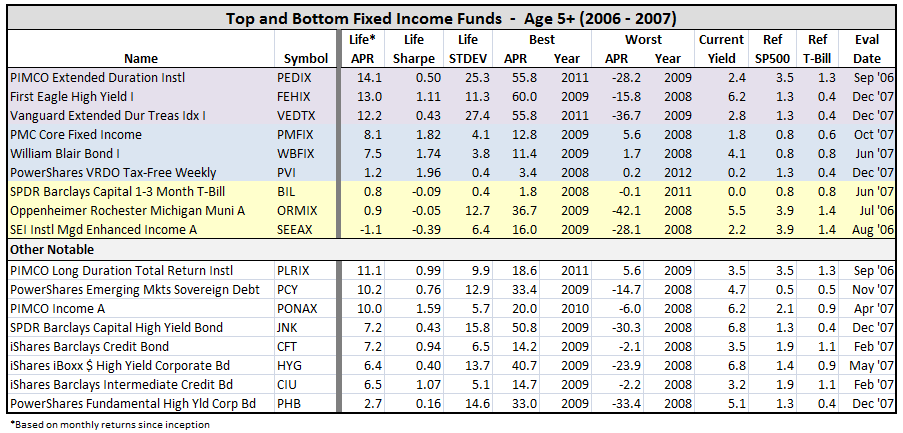
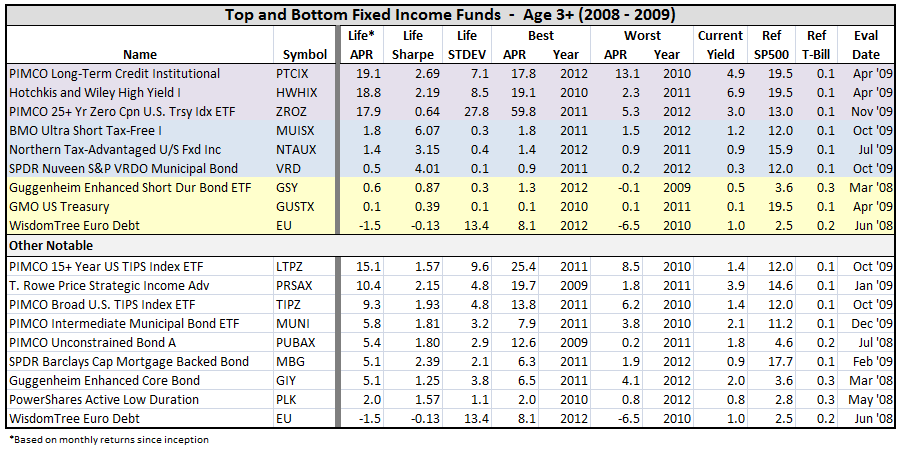
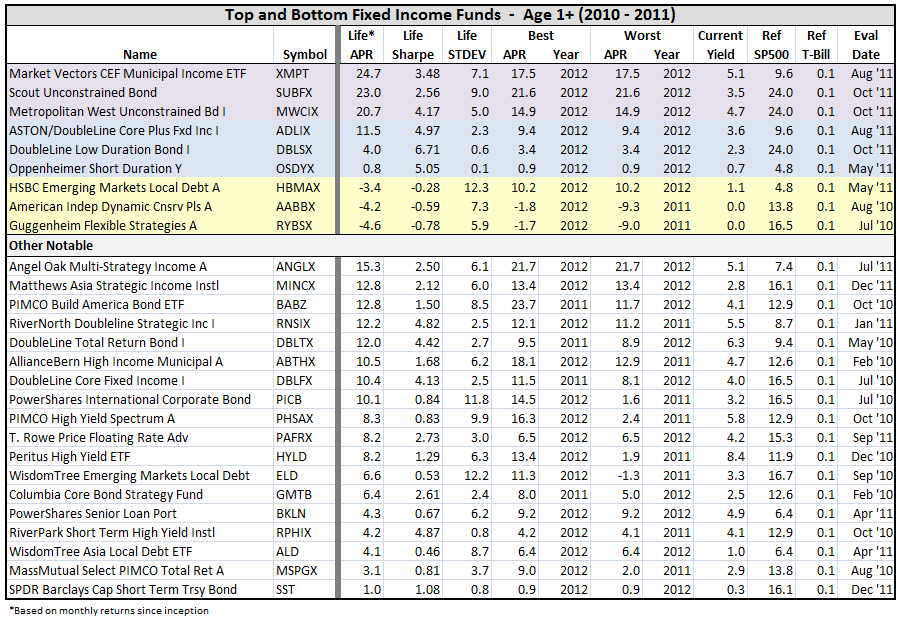
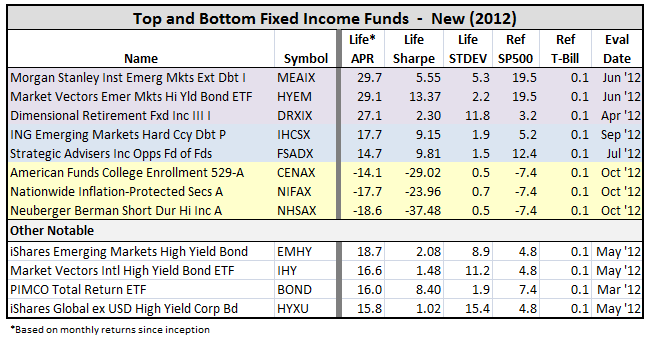
Some observations:
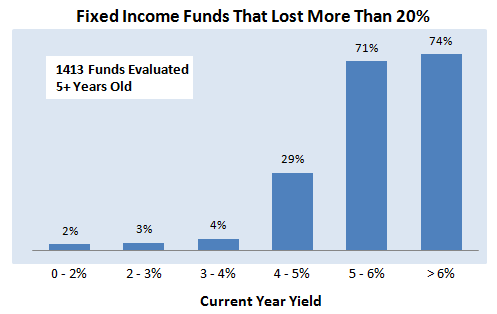
- Every fund listed (5 years or older) with current yields of 6% or more, lost more than 20% of its value in 2008, except three: PIMCO Income A PONAX, which lost only 6.0%; TCW Total Return Bond I TGLMX, which lost only 6.2% (in 1994); and First Eagle High Yield I FEHIX, which lost 15.8%.
- In fact, of all fixed income funds more than five years or older that have current yields of 6% or more, nearly 3 out of 4 had a down-year of 20% or more. Those yielding 5% or more did not do much better. For what it’s worth, the break point appears to be between 4 and 5%. Funds with less than 4% current yield did much, much better. Here is summary…
- Just glance over the list…you will see that PIMCO has produced many top performing fixed income funds.
- Fortunately, again, nearly every fixed income fund existing today has beaten cash over its life time, some 98%. The 44 funds with negative Sharpe actually fall into two distinct categories: First, those with negative Sharpe, but positive life-time APR. These are generally funds with short duration and/or tax exempt funds. Second, those with negative Sharpe and negative life-time APR. There are 25 such funds, but it’s reassuring to find only 3 older than three years old, which presumably means fixed income funds that actually lose money don’t stay around very long. The three enduring poor performers, tabulated below, are: AMF Ultra Short AULTX, SEI Instl Mgd Enhanced Income A SEEAX, and WisdomTree Euro Debt EU.
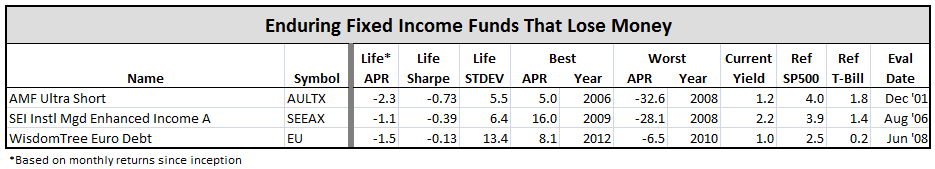
Both AULTX and EU have less than $10M AUM, but SEEAX is fairly substantial AUM at $170M, which is simply hard to believe…
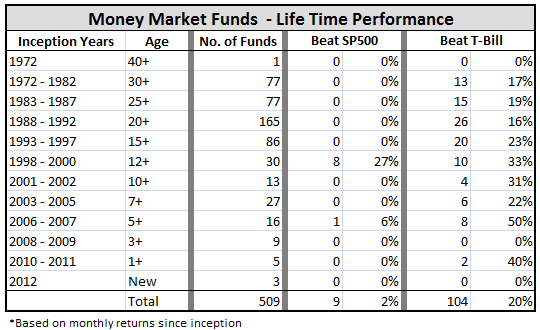
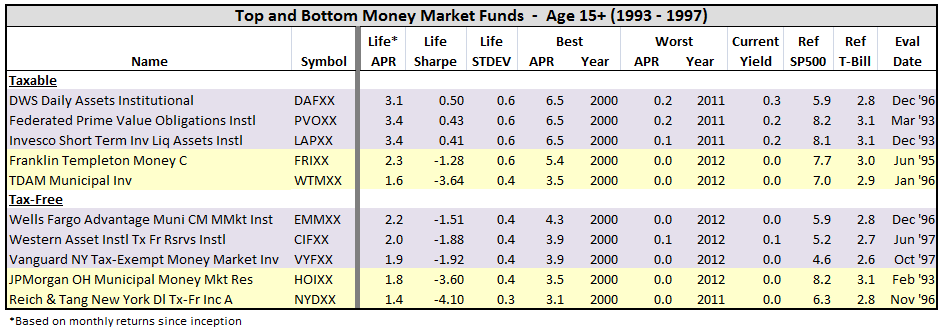
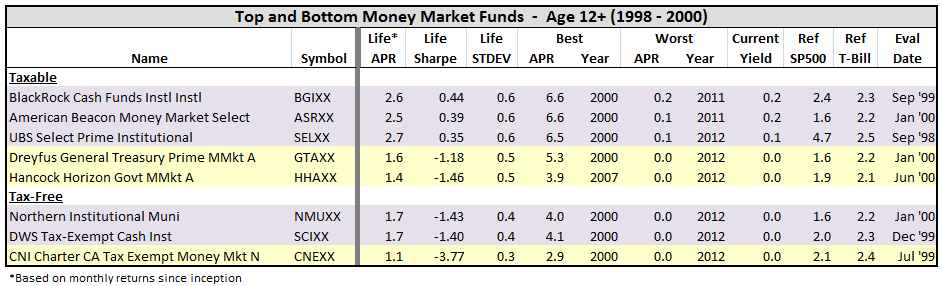
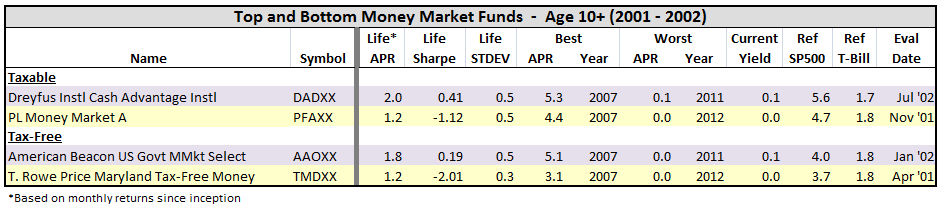
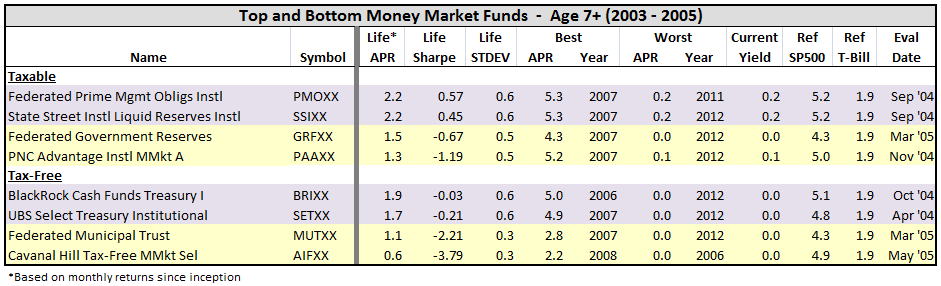
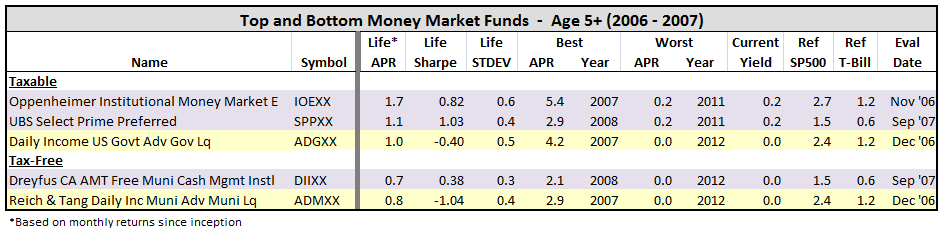
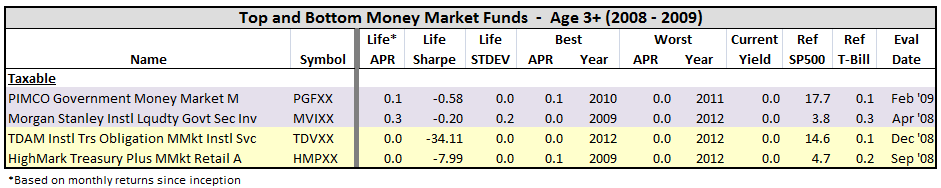
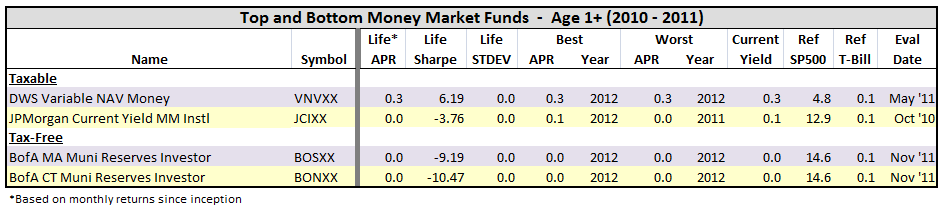
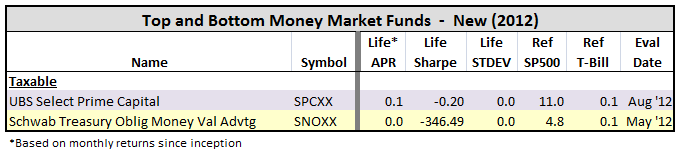
Money Market Funds
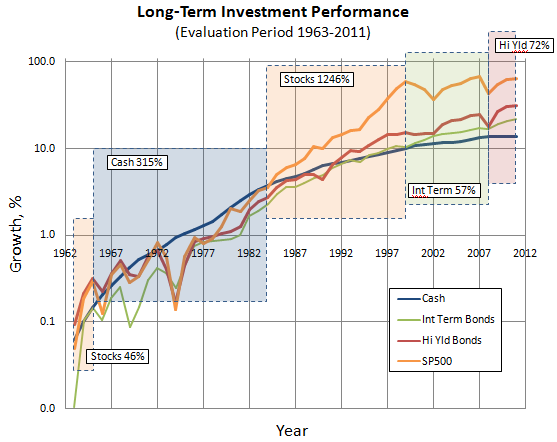
The last part – money market funds, which tend to offer lowest risk, but with attendant lowest return over the long run. There have been times, however, when money market or “cash” has ruled, like from 1966 – 1984 when cash provided a strong 7.8% APR. Here’s a reminder from Bond Fund Performance During Periods of Rising Interest Rates:
Some observations up-front:
- There are only 500 or so money market funds.
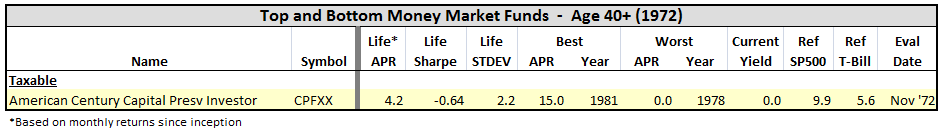
- The earliest inception date is 1972. It belongs to American Century Capital Presv Investor CPFXX. (But it is not one of better offerings.)
- Few new money market funds have been created in recent years.
- Few MFO readers discuss them and none have been profiled. M* does not appear to rate them or provide analyst reports of money market funds.
- No money market funds have loads, but many impose 12b-1 fees. The average EP is 0.5%.
- Fortunately, none have a negative absolute return over their life times.
- There are two main categories of money market funds: taxable and tax-free. The latter have existed since 1981 and represent about a third of offerings today. This plot summarizes average performance for the two types compared to the T-Bill:
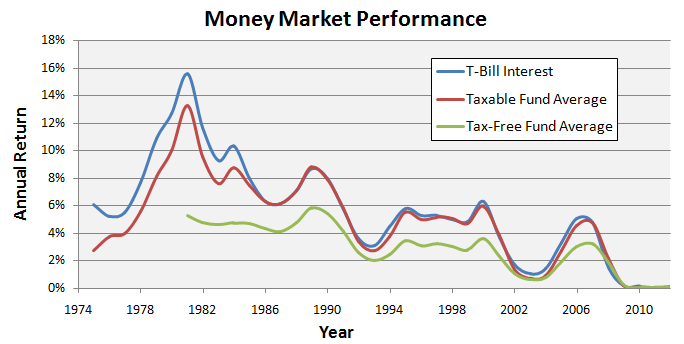
- Since 1981, the annualized return for T-Bill is 5.0%. For money market funds, the average APR is 4.6% for the taxable (about the difference in average EP), and 2.9% for tax-free.
- Only 1 in 3 taxable money market funds have beaten the T-Bill over their life times. And virtually no tax-free funds have beaten, as you would expect.
Because of the strong tax dependency with these funds, I broke out this distinction in the tabulation below. Purple means the fund was a top performer relative to T-Bill over its life time, and yellow represents worst performing APR. (For the money market funds, I did not break-out top Sharpe in blue, since APR ranking relative T-Bill is fairly close to Sharpe ranking.)
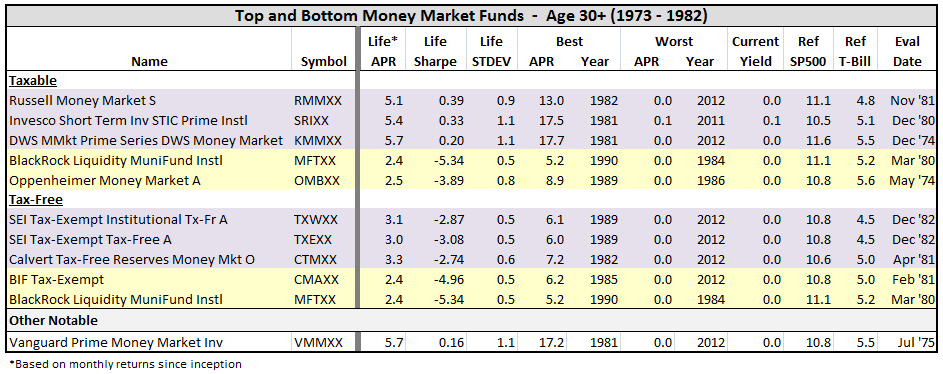
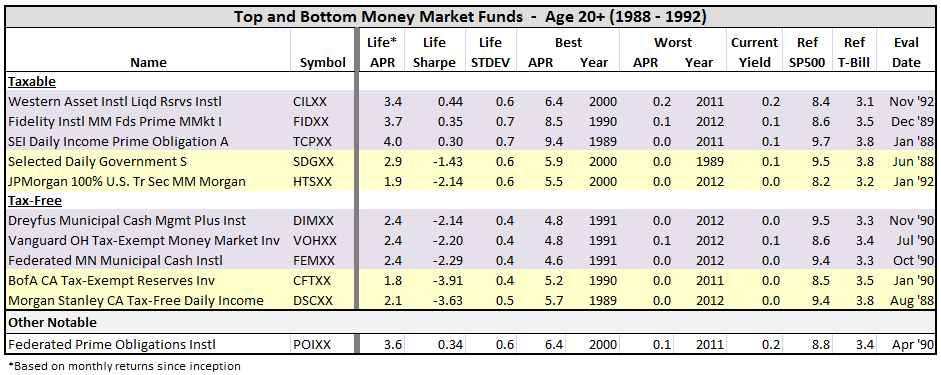
Here’s the break-out, by fund inception date:

For those interested, I’ve posted results of this thread in an Excel file Funds That Beat The Market – Nov 12.
Here is link to original thread.