
Originally published in March 1, 2014 Commentary
Central to any fund rating system is the performance measure used to determine percentile rank order. MFO uses Martin ratio, as described Rating System Definitions. Morningstar developed its own risk adjusted return (MRAR), which Nobel Laureate William Sharpe once described as a measure that “…differs significantly from more traditional ones such as various forms of the Sharpe ratio.” While the professor referred to an earlier version of MRAR, the same holds true today.
Here is how Morningstar describes MRAR on its Data FAQ page: Morningstar adjusts for risk by calculating a risk penalty for each fund based on “expected utility theory,” a commonly used method of economic analysis. Although the math is complex, the basic concept is relatively straightforward. It assumes that investors are more concerned about a possible poor outcome than an unexpectedly good outcome and that those investors are willing to give up a small portion of an investment’s expected return in exchange for greater certainty. A “risk penalty” is subtracted from each fund’s total return, based on the variation in its month-to-month return during the rating period, with an emphasis on downward variation. The greater the variation, the larger the penalty. If two funds have the exact same return, the one with more variation in its return is given the larger risk penalty.
For the curious and mathematically inclined, the detailed equations are well documented in The Morningstar Rating Methodology. The following figure illustrates how MRAR behaves for three hypothetical funds over a 3 year period ending Dec 2013:
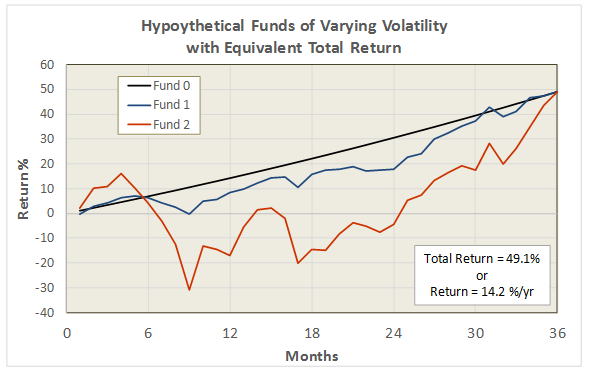
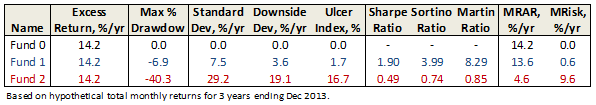
Each fund in the illustration delivers the same total return, but with varying levels of volatility. The higher the volatility, the lower the risk adjusted return. Fund 0 delivers consistent returns every month with zero volatility; consequently, it receives the highest MRAR, which in this case is the fund’s annualized total return minus the risk-free T-Bill (i.e., it’s the annualized “excess” return).
Morningstar computes MRAR for all funds over equivalent periods, and then percentile ranks them within their respective categories to assign appropriate levels, 1 star for those funds in the lowest group and the coveted 5 star rating for the highest.
It also computes a risk measure MRisk and performs a similar ranking to designate “low” to “high” risk funds within each category. MRisk is simply the difference between the annualized excess return of the fund and its MRAR.
The following figure provides further insight into how MRAR behaves for funds of varying volatility. This time, fund total returns have been scaled to match their category averages, again for the 3 year period ending Dec 2013. The figure includes results from several categories showing MRAR versus the tradition volatility measure, annualized standard deviation.
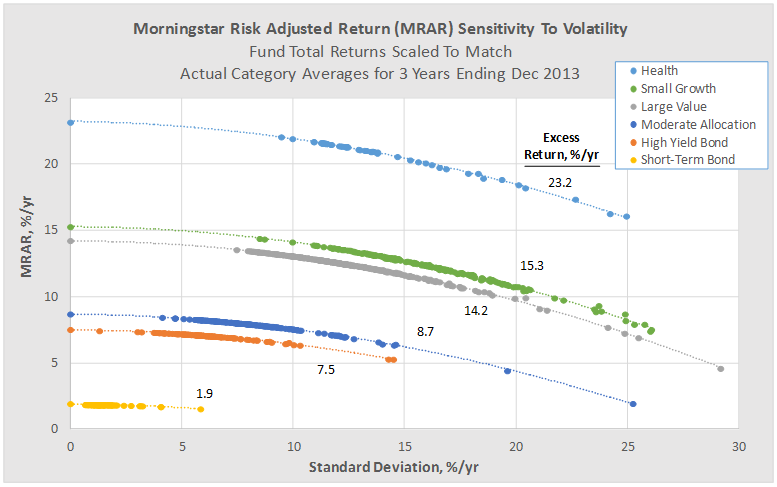
Once again we see that funds with higher volatility generally receive lower MRARs and that the highest possible MRAR is equal to a fund’s annualized excess return, which occurs at zero standard deviation.
A consequence of Morningstar’s methodology is that low volatility funds with below average returns can quite possibly be out-ranked by average volatility funds with average returns. Put another way, the methodology generally penalizes funds with high volatility more so than it rewards funds with low volatility, since with the latter the benefit is “capped.”
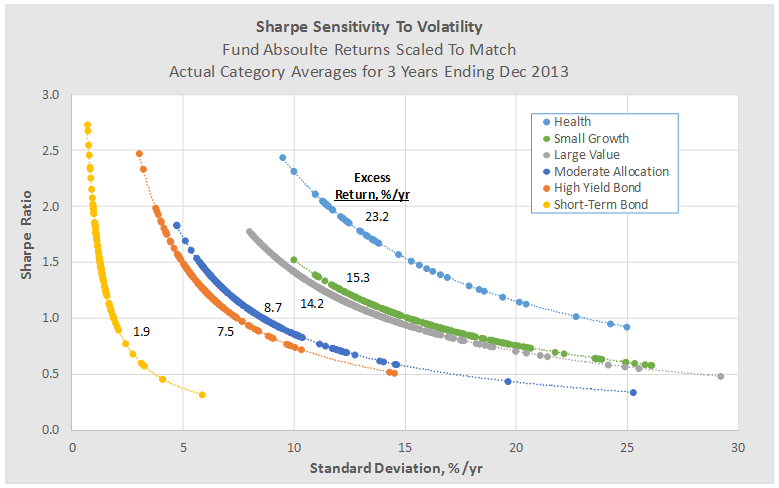
This behavior is different from other risk adjusted return measures based on say Sharpe ratio, as can be seen in the figure below. Here the same funds from above are plotted against Sharpe, but now funds with low volatility are rewarded handsomely, even if they have below average total returns.
Revisiting the Morningstar risk measure MRisk, one finds another observation: it appears to correlate rather satisfactorily against a simple function based on standard deviation (up to about 30% for funds of positive total return without load):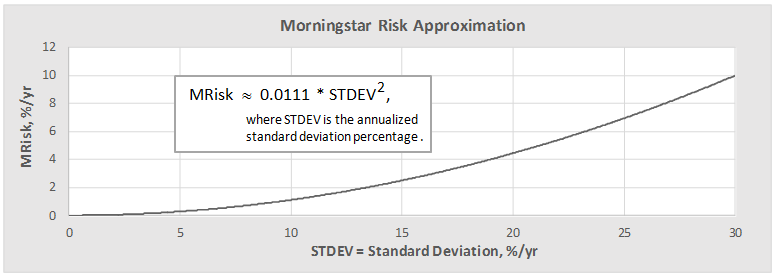
Which means that Morningstar’s risk adjusted return can be estimated from the following:
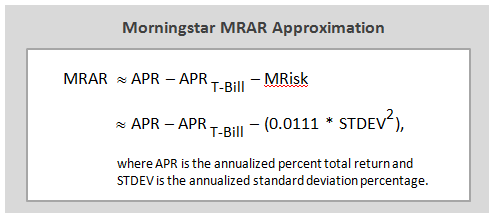
This simple approximation may come in handy, like when David wonders: “Why do RPHIX and ICMYX, which have superior 3 year Sharpe ratios, rate a very inferior 1 star by Morningstar?” He can use the above calculation to better understand, as illustrated here:
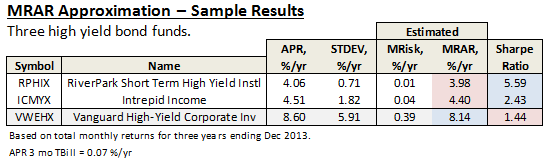
While both do indeed have great 3 year Sharpe ratios – RPHIX is highest of any US fund – they both have below average total returns relative to their current peer group, as represented by say VWEHX, a moderate risk and average returning high yield bond “reference” fund.
Their low volatilities simply get no love from Morningstar’s risk adjusted return measure.
27Feb2014/Charles