
Originally published in April 1, 2014 Commentary
In response to the article In Search of Persistence, published in David’s January commentary, NumbersGirl posted the following on the MFO board:
I am not enamored of using rolling 3-year returns to assess persistence.
A 3-year time period will often be all up or all down. If a fund manager has an investing personality or philosophy then I would expect strong relative performance in a rising market to be negatively correlated with poor relative performance in a falling market, etc.
It seems to me that the best way to measure persistence is over 1 (or better yet more) market cycles.
There followed good discussion about pros and cons of such an assessment, including lack of consistent definition of what constitutes a market cycle.
Echoing her suggestion, fund managers also often ask to be judged “over full cycle” when comparing performance against their peers.
A quick search of literature (eg., Standard & Poor’s Surviving a Bear Market and Doug Short’s Bear Markets in the S&P since 1950) shows that bear markets are generally “defined as a drop of 20% or more from the market’s previous high.” Here’s how the folks at Steele Mutual Fund Expert define a cycle:
Full-Cycle Return: A full cycle return includes a consecutive bull and bear market return cycle.
Up-Market Return (Bull Market): A Bull market in stocks is defined as a 20% rise in the S&P 500 Index from its previous trough, ending when the index reaches its peak and subsequently declines by 20%.
Down-Market Return (Bear Market): A Bear market in stocks is defined as a 20% decline in the S&P 500 Index from its previous peak, and ends when the index reaches its trough and subsequently rises by 20%.
Applying this definition to the SP500 intraday price index indicates there have indeed been ten such cycles, including the current one still in process, since 1956:
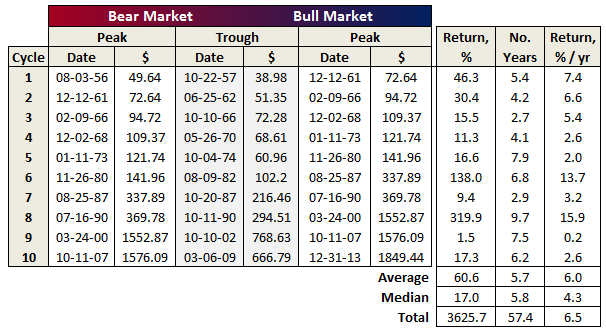
The returns shown are based on price only, so exclude dividends. Note that the average duration seems to match-up pretty well with so-called “short term debt cycle” (aka business cycle) described by Bridgewater’s Ray Dalio in the charming How the Economic Machine Works – In 30 Minutes video.
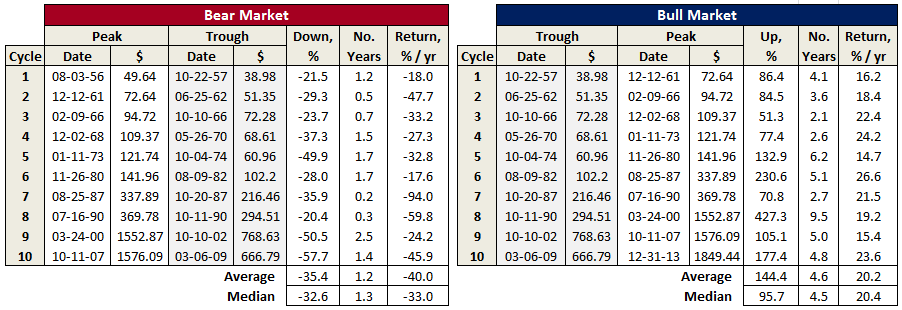
Here’s break-out of bear and bull markets:
The graph below depicts the ten cycles. To provide some historic context, various events are time-lined – some good, but more bad. Return is on left axis, measured from start of cycle, so each builds where previous left off. Short-term interest rate is on right axis.
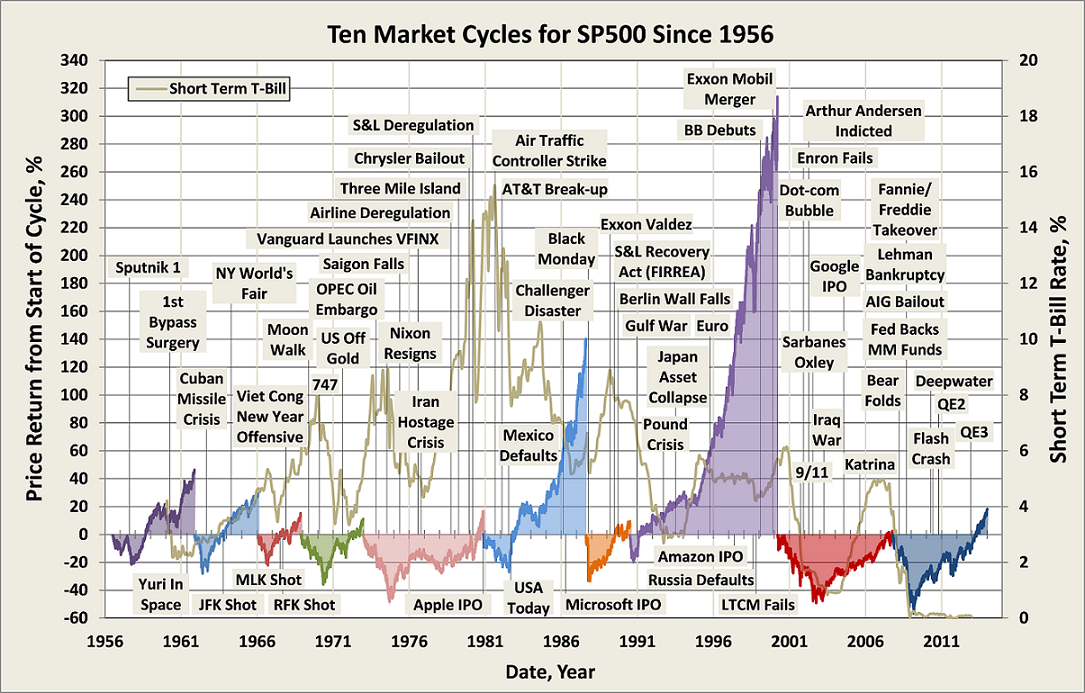
Note that each cycle resulted in a new all-time market high, which seems rather extraordinary. There were spectacular gains for the 1980 and 1990 bull markets, the latter being 427% trough-to-peak! (And folks worry lately that they may have missed-out on the current bull with its 177% gain.) Seeing the resiliency of the US market, it’s no wonder people like Warren Buffett advocate a buy-and-hold approach to investing, despite the painful -50% or more drawdowns, which have occurred three times over the period shown.
Having now defined the market cycles, which for this assessment applies principally to US stocks, we can revisit the question of mutual fund persistence (or lack of) across them.
Based on the same methodology used to determine MFO rankings, the chart below depicts results across nine cycles since 1962:
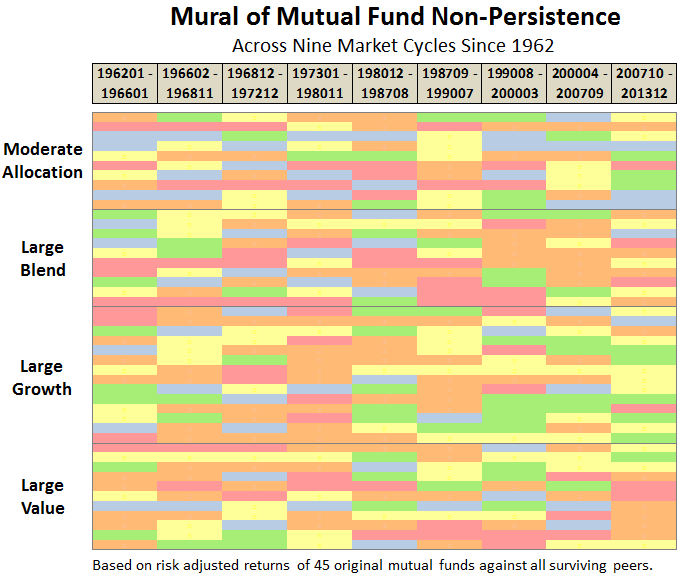
Blue indicates top quintile performance, while red indicates bottom quintile. The rankings are based on risk adjusted return, specifically Martin ratio, over each full cycle. Funds are compared against all other funds in the peer group. The number of funds was rather small back in 1962, but in the later cycles, these same funds are competing against literally hundreds of peers.
(Couple qualifiers: The mural does not account for survivorship-bias or style drift. Cycle performance is determined using monthly total returns, including any loads, between the peak-to-peak dates listed above, with one exception…our database starts Jan 62 and not Dec 61.)
Not unexpectedly, the result is similar to previous studies (eg., S&P Persistence Scorecard) showing persistence is elusive at best in the mutual fund business. None of the 45 original funds in four categories delivered top-peer performance across all cycles – none even came close.
Looking at the cycles from 1973, a time when several now well know funds became established, reveals a similar lack of persistence – although one or two come close to breaking the norm. Here is a look at some of the top performing names:
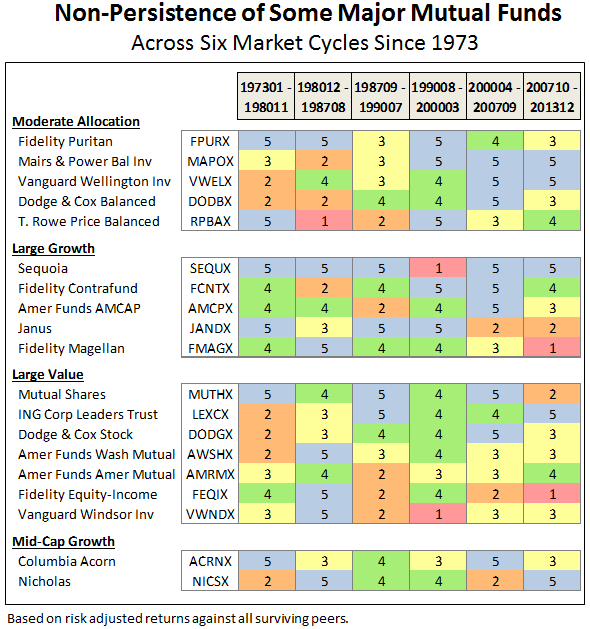
MFO Great Owls Mairs & Powers Balanced (MAPOX) and Vanguard Wellington (VWELX) have enjoyed superior returns the last three cycles, but not so much in the first. The reverse is true for legendary Fidelity Magellan (FMAGX).
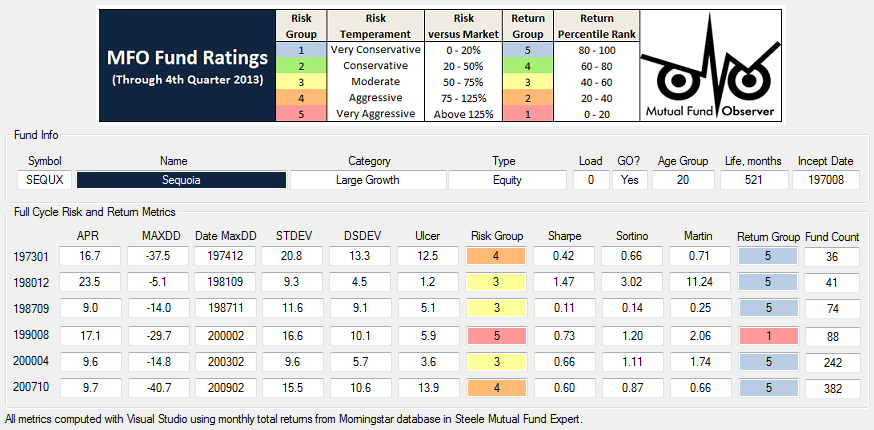
Even a fund that comes about as close to perfection as possible, Sequoia (SEQUX), swooned in the late ‘90s relative to other growth funds, like Fidelity Contrafund (FCNTX), resulting in underperformance for the cycle. The table below details the risk and return metrics across each cycle for SEQUX, showing the -30% drawdown in early 2000, which marked the beginning of the tech bubble. In the next couple years, many other growth funds would do much worse.
So, while each cycle may rhyme, they are different, and even the best managed funds will inevitably spend some time in the barrel, if not fall from favor forever.
We will look to incorporate full-cycle performance data in the single-ticker MFO Risk Profile search tool. As suggested by NumbersGirl, it’s an important piece of due diligence and risk cognizance for all mutual fund investors.
26Mar14/Charles