
Originally published in August 1, 2014 Commentary
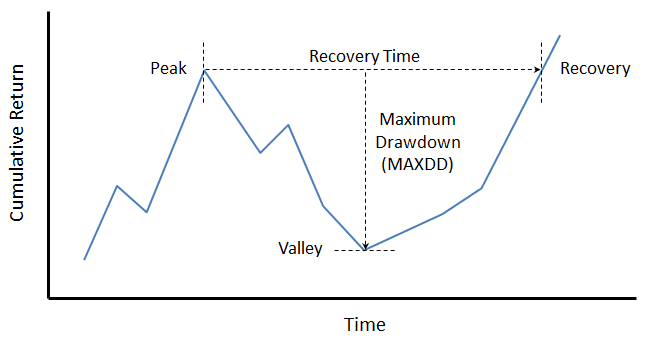
In the book “Practical Risk-Adjusted Performance Measurement,” Carl Bacon defines recovery time or drawdown duration as the time taken to recover from an individual or maximum drawdown to the original level. In the case of maximum drawdown (MAXDD), the figure below depicts recovery time from peak. Typically, for equity funds at least, the descent from peak to valley happens more quickly than the ascent from valley to recovery level.
An individual’s risk tolerance and investment timeline certainly factor into expectations of maximum drawdown and recovery time. As evidenced in “Ten Market Cycles” from our April commentary, 20% drawdowns are quite common. Since 1956, the SP500 has fallen nearly 30% or more eight times. And, three times – a gut wrenching 50%. Morningstar advises that investors in equity funds need “investment horizons longer than 10 years.”
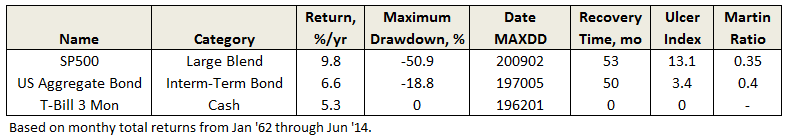
Since 1962, SP500’s worst recovery time is actually a modest 53 months. Perhaps more surprising is that aggregate bonds experienced a similar duration, before the long bull run. The difference, however, is in the drawdown level itself.
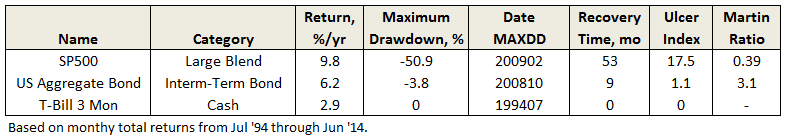
During the past 20 years, bonds have recovered much more quickly, even after the financial crisis.
Long time MFO board contributor Bee posted recently:
MAXDD or Maximum Drawdown is to me only half of the story.
Markets move up and down. Typically the more aggressive the fund the more likely it is to have a higher MAXDD. I get that. What I find “knocks me out of a fund” in a down market is the fund’s inability to bounce back.
Ulcer Index, as defined by Peter Martin and central to MFO’s ratings system, does capture both the MAXDD and recovery time, but like most indices, it is most easily interpreted when comparing funds over same time period. Shorter recovery times will have lower UIcer Index, even if they experience the same absolute MAXDD. Similarly, the attendant risk-adjusted-return measure Martin Ratio, which is excess return divided by Ulcer Index, will show higher levels.
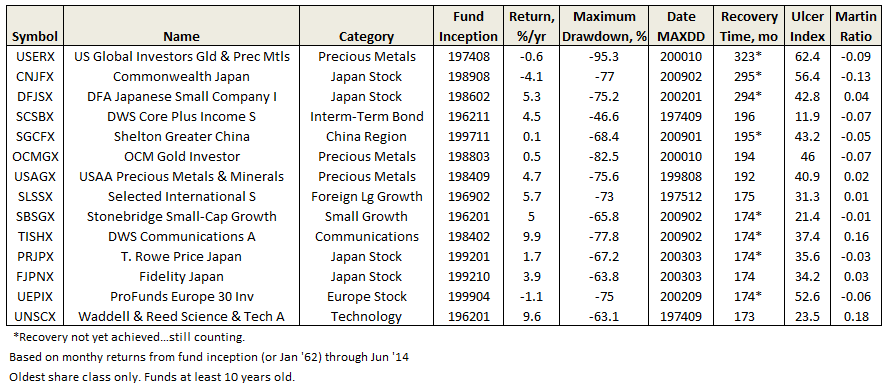
But nothing hits home quite like maximum drawdown and recovery time, whose absolute levels are easily understood. A review of lifetime MAXDD and recoveries reveals the following funds with some dreadful numbers, representing a cautionary tale at least:
In contrast, some notable funds, including three Great Owls, with recovery times at 1 year or less:
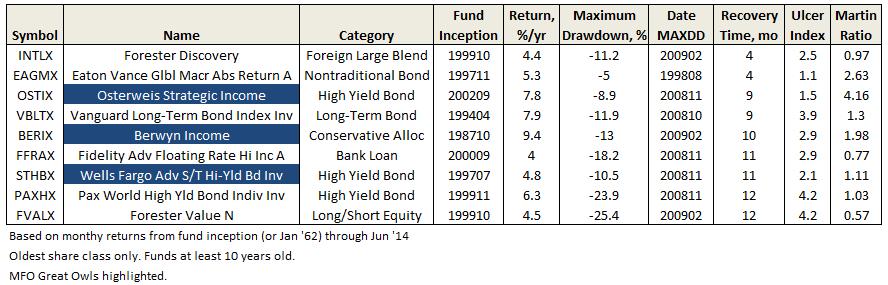
On Bee’s suggestion, we will be working to make fund recovery times available to MFO readers.