


Blessed are the forgetful, for they “get the better” even of their blunders. Friedrich Nietzsche, “Our Virtues,” Beyond Good and Evil (1886)
Our summer tradition is to update you on our ruminations and recommendations from three (or five) years ago. That exercise serves three purposes:
- It provides a reality check on whether our recommendations for options to consider bear fruit. (Or are bare of fruit.)
- It provides a reminder of how much chaos you’ve already experienced. If we did a pop quiz (quick: the market three years ago this week was a. crashing, b. flat, c. soaring, d. huh? The best answer is “d” but the historic pattern for 2022 was crash into a bear in spring, soar into a bull in summer, crash again in fall.)
- It provides focus. For me, mostly. Summers are some combination of lazy, hazy, and crazy. The discipline of looking back precisely three years and reassessing our lead story keeps me from spending time obsessively cataloging the types of bees (at least eight species, including two distinct sets of bumblebees) swarming the garden.
In August 2022, we had just been through a stunning market reversal: the S&P 500 fell over 20% coming into June, then jumped 12% in a July-August rally. A second crash and a second rally were in our immediate future. Our lead feature, the Publisher’s Letter, started with a question:
What does this mean for investors?
First, it means you have a choice to make. You need to decide to what degree you believe the optimists – traders think the Fed is about done, FundStrat says “the bottom is in” and we’ve got a 16% upside by year’s end, Morningstar declares that stocks are trading at historically cheap prices – and to what extent you’re willing to bet your financial future that they’re right. If you’re very confident, it’s risk-on time. If you’re not, it’s time for caution. (A warning about letting your guard down: Don’t, August 2022)
Our recommendation flowed from two sets of research.
First, when the market is rising, investors only remember rising markets.
We forget our worst investment mistakes while vividly remembering our successes, with this selective memory being strongest among inexperienced investors who frequently check stock prices. This “motivated forgetting” protects our egos but sets us up to repeat the same costly errors. (King King Li and Kang Rong, “Real-life Investors’ Memory Recall Bias: A Lab-in-the-Field Experiment,” Journal of Behavioral and Experimental Finance, 2023)
This rosy-glasses memory bias creates a distorted view of actual performance, making us more likely to repeat risky behaviors that once paid off while ignoring the hard-learned lessons from our mistakes. (Katrin Gödker, Peiran Jiao, and Paul Smeets. “Investor memory.” The Review of Financial Studies 2025)
 We consistently remember our wins as bigger than they were. This inflated self-assessment directly fuels overconfident decision-making in future trades. This memory distortion helps explain why investors keep engaging in wealth-destroying behaviors like excessive trading and poor diversification: we literally can’t remember how badly these strategies worked before. (Daniel J. Walters and Philip M. Fernbach, “Investor memory of past performance is positively biased and predicts overconfidence,” Proceedings of the National Academy of Sciences, 2021)
This memory problem matters because it blinds us to a crucial investment reality that actually does persist: risk. Hence …
Second, returns may be only skin-deep, but risk goes to the bone. There is strong and reliable academic and professional evidence that past volatility predicts future volatility for mutual funds and similar investments. This is in sharp contrast to the widely accepted view that past returns do not reliably predict future performance.
Academic studies show that the standard deviation of a mutual fund’s past returns (its past volatility) is a strong predictor of its future volatility. For example, one large-scale study found that past volatility significantly and positively predicted future volatility for all funds in their sample—meaning that funds with high volatility in the past tend to remain volatile, and low-volatility funds stay relatively stable.
The statistical significance of this relationship is very high. In a comprehensive sample covering over 1,800 mutual funds and two decades of data, the correlation between past and future volatility was consistently positive and highly significant across the board. (see, for example, Feifei Wang, Xuemin Yan and Lingling Zheng, “Should mutual fund investors time volatility?” Financial Analysts Journal, 2021).
Wang, et al conclude that it’s far more profitable to invest based on past volatility than on past returns.
In 2022, we recommended that you might start adding defensive stars to your due diligence list. We commended six funds for your consideration. In particular, ones run by
folks who understand that the surest path to long-term success is avoiding overconfidence and overexposure to risk. They tend to favor high quality businesses purchased at a discount and generally have the ability to scale back equity exposure when things get frothy.
Four of the six went on to post both higher alpha (i.e., excess gains) and lower beta (muted losses) than their peers. One mostly excelled in loss management, and one foundered after losing its founding manager. Here’s the snapshot:
| Style notes | 3-year Performance | MFO’s take | |
| Ariel Global AGLOX | Global large value, manager deeply skeptical of “a market on opioids” | Lower alpha, lower beta, lower Sharpe ratio, less upside capture, less downside capture | Founding manager Rupal Bhansali left Ariel in 2023 and founded Double Duty Money Management |
| FPA Crescent FPACX | Unconstrained multi-asset portfolio whose manager has been getting it right for 30 years | Higher alpha, lower beta, higher Sharpe, more upside capture, less downside capture | MFO Great Owl, outperforming its peers by nearly 6% annually. |
| SmartETFs Dividend Builder DIVS | Formerly an active mutual fund, Guinness Atkinson Dividend Builder, which screens for companies with low debt and consistently growing dividends | Higher alpha, lower beta, higher Sharpe ratio, lower upside capture, much lower downside capture | Categorized as a global equity income fund, DIVS has beaten its peers by 2.7% annually |
| Leuthold Core LCORX | Multi-asset portfolio driven by rigorous quantitative screens. | Higher alpha, lower beta, higher Sharpe, more upside capture, less downside capture | Has outperformed its peers, with lower volatility, in every longer-term trailing period, 0.79% |
| Osterweis Strategic Income OSTIX | Multi-asset income fund from a famously independently shop, essentially unconstrained in the search for the most-attractive risk-adjusted opportunities | Lower alpha, lower beta, higher Sharpe ratio, less upside capture, negative downside capture | MFO Great Owl for consistently top tier risk adjusted returns over all our measurement peers, with a 3.6% annual outperformance against its multisector income peers. |
| Palm Valley Capital PVCMX | Small value, two absolute value investors with 50 years of experience between them, still caustic about current valuations | Higher alpha, lower beta, lower Sharpe ratio, very low upside capture, even lower downside capture | MFO Great Owl, despite trailing peers by 5.4% annually. |
Except for Ariel and Palm Valley, Morningstar rates all of them as either four- or five-star funds (as of 7/30/2025). We cannot recommend Ariel just now. Palm Valley Capital, nominally a small-value equity fund, might best be assigned to the more speculative wing of your fixed-income portfolio, along with global or high-yield bonds. The managers are incredibly disciplined and talented; the problem is that the market has not fallen to valuations that allow them to find many stocks that meet their value + quality criteria. So 70-80% of the portfolio has been invested in short-term bonds and cash, making it a sort of bond fund with a potential upside punch.
For visual learners, here’s the same three-year data, color-coded. In all instances, remember “blue is best, green is good.”
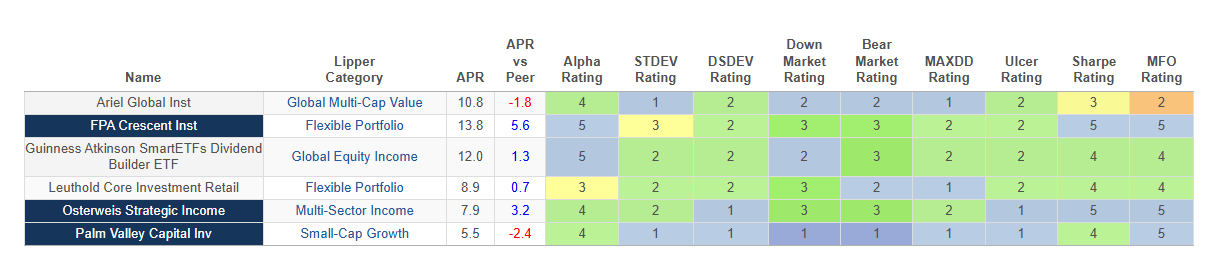
How do you read the table? APR is the annual percentage return over the past three years; the next column compares those returns to its Lipper peers, followed by its Alpha (excess returns) rating, where a blue box means “top 20% of its peer group for this period.” Since risk is important, we provide a snapshot of five volatility measures (standard deviation, downside or “bad” deviation, volatility in down markets and bear markets, then the depth of the fund’s worst decline). Finally, we combine returns and volatility into three risk-return measures: the fund’s Ulcer Index (which looks at how far a fund falls plus how long it stays down), Sharpe ratio (the most widely used of all risk-return metrics) and the fund’s MFO rating which places greater weight on risk aversion than does the Sharpe rating.
Returns / risks / risk-return balance. Got it?
Good!
Much more complete information – more time periods, more metrics, and 10,000 more investments – is available at our sister site, MFO Premium. Folks contributing $120 or more to help support MFO get a year’s access to MFO Premium.
Bottom line
The US stock market hovers at or near record valuations. It might be that we’ve actually achieved the “permanently high plateau” that Yale economist Irving Fisher foresaw for stocks … in his comments around October 15, 1929.
Or we might have achieved the same state that the market was actually in on October 15, 1929.
I don’t know. Do you? If not, then the advice stands: seek outstanding risk managers who have demonstrated, over time, their willingness and ability to protect you even if it means “leaving money on the table” when markets are high.