Dear friends,
Welcome to summer, a time of year when heat records are rather more common than market records.

What’s in your long/short fund?
 Everybody’s talking about long/short funds. Google chronicles 273,000 pages that use the phrase. Bloomberg promises “a comprehensive list of long/short funds worldwide.” Morningstar, Lipper and U.S. News plunk nearly a hundred funds into a box with that label. (Not the same hundred funds, by the way. Not nearly.) Seeking Alpha offers up the “best and less long/short funds 2013.”
Here’s the Observer’s position: Talking about “long/short funds” is dangerous and delusional because it leads you to believe that there are such things. Using the phrase validates the existence of a category, that is, a group of things where we perceive shared characteristics. As soon as we announce a category, we start judging things in the category based on how well they conform to our expectations of the category. If we assign a piece of fruit (or a hard-boiled egg) to the category “upscale dessert,” we start judging it based on how upscale-dessert-y it seems. The fact that the assignment is random, silly and unfair doesn’t stop us from making judgments anyway. The renowned linguist George Lakoff writes, “there is nothing more basic than categorization to our thought, perception, action and speech.”
Do categories automatically make sense? Try this one out: Dyirbal, an Australian aboriginal language, has a category balan which contains women, fire, dangerous things, non-threatening birds and platypuses.
When Morningstar groups 83 funds together in the category “long/short equity,” they’re telling us “hey, all of these things have essential similarities. Feel free to judge them against each other.” We sympathize with the analysts’ need to organize funds. Nonetheless, this particular category is seriously misleading. It contains funds that have only superficial – not essential – similarities with each other. In extended conversations with managers and executives representing a half dozen long/short funds, it’s become clear that investors need to give up entirely on this simple category if they want to make meaningful comparisons and choices.
Each of the folks we spoke to have their own preferred way of organizing these sorts of “alternative investment” funds. After two weeks of conversation, though, useful commonalities began to emerge. Here’s a manager-inspired schema:
- Start with the role of the short portfolio. What are the managers attempting to do with their short book and how are they doing it? The RiverNorth folks, and most of the others, agree that this should be “the first and perhaps most important” criterion. Alan Salzbank of the Gargoyle Group warns that “the character of the short positions varies from fund to fund, and is not necessarily designed to hedge market exposure as the category title would suggest.” Based on our discussions, we think there are three distinct roles that short books play and three ways those strategies get reflected in the fund.
Role
Portfolio tool
Translation
Add alpha
Individual stock shorts
These funds want to increase returns by identifying the market’s least attractive stocks and betting against them
Reduce beta
Shorting indexes or sectors, generally by using ETFs
These funds want to tamp market volatility by placing larger or smaller bets against the entire market, or large subsets of it, with no concern for the value of individual issues
Structural
Various option strategies such as selling calls
These funds believe they can generate considerable income – as much as 1.5-2% per month – by selling options. Those options become more valuable as the market becomes more volatile, so they serve as a cushion for the portfolio; they are “by their very nature negatively correlated to the market” (AS).
-
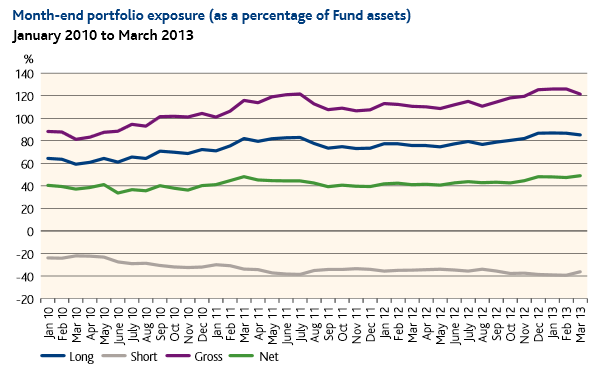
Determine the degree of market exposure. Net exposure (% long minus % short) varies dramatically, from 100% (from what ARLSX manager Matt Moran laments as “the faddish 130/30 funds from a few years ago”) to under 25%. An analysis by the Gargoyle Group showed three-year betas for funds in Morningstar’s long/short category ranging from 1.40 to (-0.43), which gives you an idea of how dramatically market exposure varies. For some funds the net market exposure is held in a tight band (40-60% with a target of 50% is pretty common). Some of the more aggressive funds will shift exposure dramatically, based on their market experience and projections. It doesn’t make sense to compare a fund that’s consistently 60% exposure to the market with one that swings from 25% – 100%.
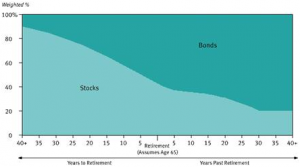
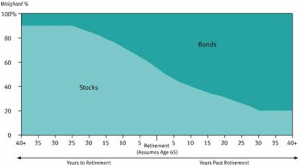
Ideally, that information should be prominently displayed on a fund’s fact sheet, especially if the manager has the freedom to move by more than a few percent. A nice example comes from Aberdeen Equity Long/Short Fund’s (GLSRX) factsheet:
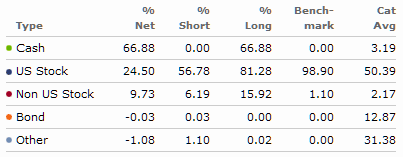
Greg Parcella of Long/Short Advisors maintains an internal database of all of long/short funds and expressed some considerable frustration in discovering that many don’t make that information available or require investors to do their own portfolio analyses to discover it. Even with the help of Morningstar, such self-generated calculations can be a bit daunting. Here, for example, is how Morningstar reports the portfolio of Robeco Boston Partners Long/Short Equity BPLEX in comparison to its (entirely-irrelevant) long-short benchmark and (wildly incomparable) long/short equity peers:
So, look for managers who offer this information in a clear way and who keep it current. Morty Schaja, president of RiverPark Advisors which offers two very distinctive long/short funds (RiverPark Long/Short Opportunity RLSFX and RiverPark/Gargoyle Hedged Value RGHVX) suggest that such a lack of transparency would immediately raise concerns for him as an investor; he did not offer a flat “avoid them” but was surely leaning in that direction.
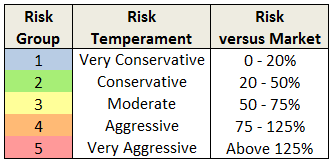
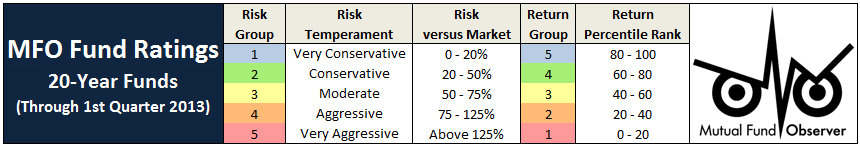
- Look at the risk/return metrics for the fund over time. Once you’ve completed the first two steps, you’ve stopped comparing apples to rutabagas and mopeds (step one) or even cooking apples to snacking apples (step two). Now that you’ve got a stack of closely comparable funds, many of the managers call for you to look at specific risk measures. Matt Moran suggests that “the best measure to employ are … the Sharpe, the Sortino and the Ulcer Index [which help you determine] how much return an investor is getting for the risk that they are taking.”
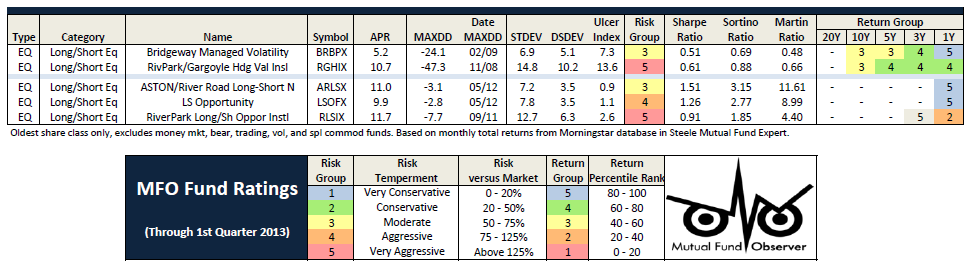
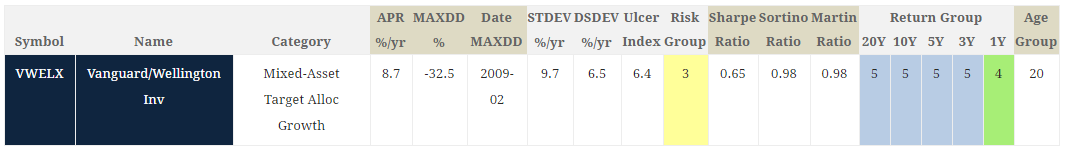
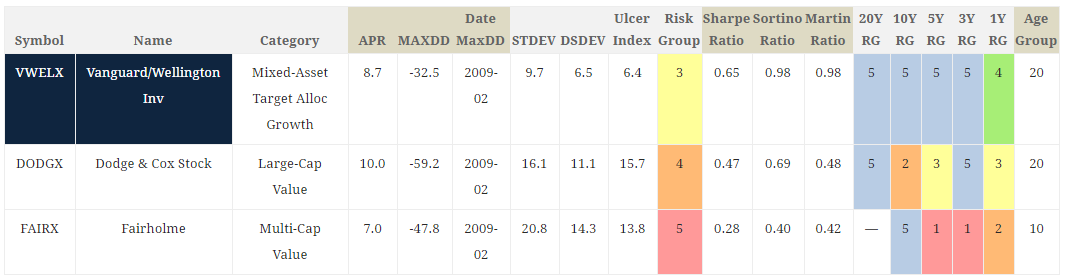
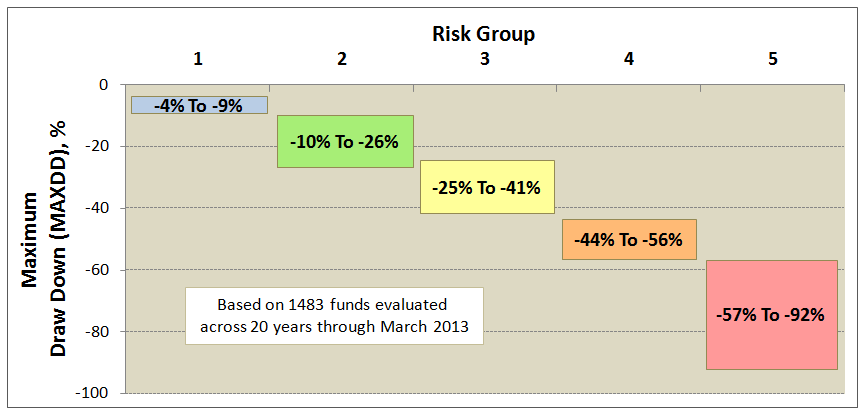
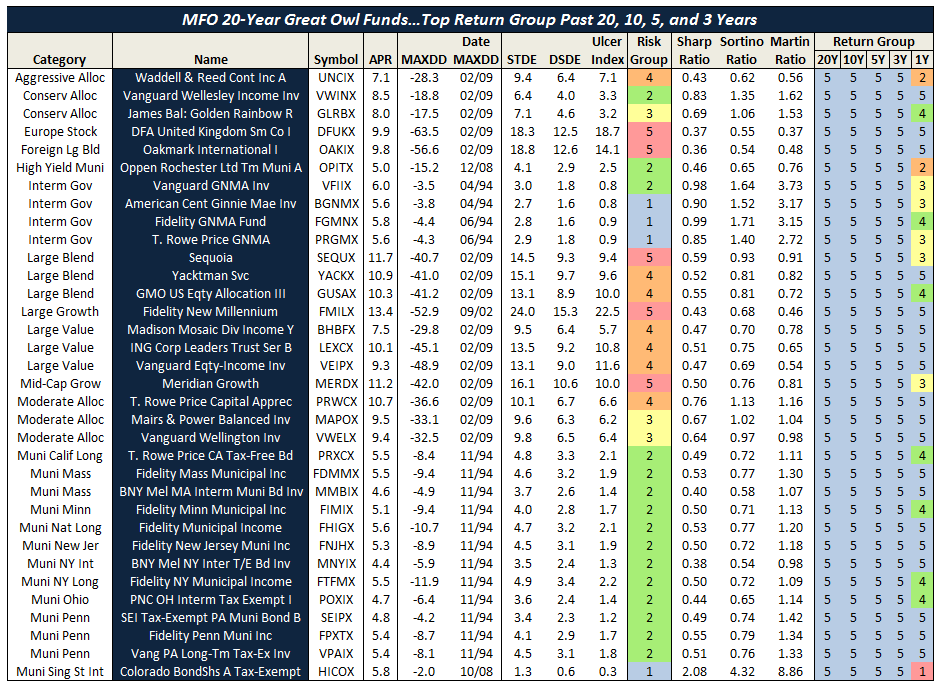
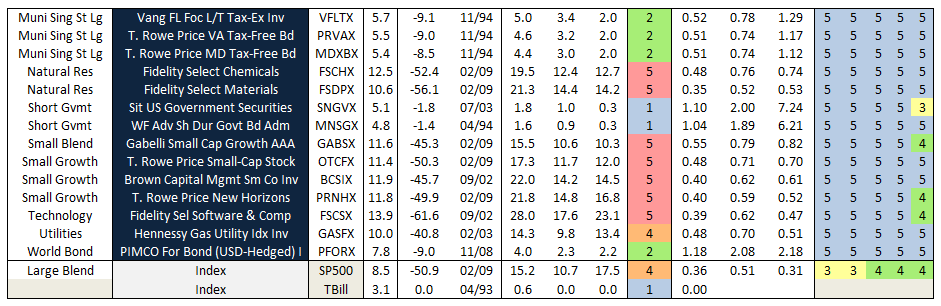
As part of the Observer’s new risk profiles of 7600 funds, we’ve pulled all of the funds that Morningstar categorizes as “long/short equity” into a single table for you. It will measure both returns and seven different flavors of risk. If you’re unfamiliar with the varied risk metrics, check our definitions page. Remember that each bit of data must be read carefully since the fund’s longevity can dramatically affect their profile. Funds that were around in the 2008 will have much greater maximum drawdowns than funds launched since then. Those numbers do not immediately make a fund “bad,” it means that something happened that you want to understand before trusting these folks with your money.
As a preview, we’d like to share the profiles for five of the six funds whose advisors have been helping us understand these issues. The sixth, RiverNorth Dynamic Buy-Write (RNBWX), is too new to appear. These are all funds that we’ve profiled as among their categories’ best and that we’ll be profiling in August.
Long/short managers aren’t the only folks concerned with managing risk. For the sake of perspective, we calculated the returns on a bunch of the risk-conscious funds that we’ve profiled. We looked, in particular, at the recent turmoil since it affected both global and domestic, equity and bond markets.
Downside protection in one ugly stretch, 05/28/2013 – 06/24/2013
|
Strategy |
Represented by |
Returned |
|
Traditional balanced |
Vanguard Balanced Index Fund (VBINX) |
(3.97) |
|
Global equity |
Vanguard Total World Stock Index (VTWSX) |
(6.99) |
|
Absolute value equity a/k/a cash-heavy funds |
ASTON/River Road Independent Value (ARIVX) Bretton (BRTNX) Cook and Bynum (COBYX) FPA International Value (FPIVX) Pinnacle Value (PVFIX) |
(1.71) (2.51) (3.20) (3.30) (1.75) |
|
Pure long-short |
ASTON/River Road Long-Short (ARLSX) Long/Short Opportunity (LSOFX) RiverPark Long Short Opportunity (RLSFX) Wasatch Long/Short (FMLSX) |
(3.34) (4.93) (5.08) (3.84) |
|
Long with covered calls |
Bridgeway Managed Volatility (BRBPX) RiverNorth Dynamic Buy-Write (RNBWX) RiverPark Gargoyle Hedged Value (RGHVX) |
(1.18) (2.64) (4.39) |
|
Market neutral |
Whitebox Long/Short Equity (WBLSX) |
(1.75) |
|
Multi-alternative |
MainStay Marketfield (MFLDX) |
(1.11) |
Charles, widely-read and occasionally whimsical, thought it useful to share two stories and a bit of data that lead him to suspect that successful long/short investments are, like Babe Ruth’s “called home run,” more legend than history.
Notes from the Morningstar Conference
If you ever wonder what we do with contributions to the Observer or with income from our Amazon partnership, the short answer is, we try to get better. Three ongoing projects reflect those efforts. One is our ongoing visual upgrade, the results of which will be evident online during July. More than window-dressing, we think of a more graphically sophisticated image as a tool for getting more folks to notice and benefit from our content. A second our own risk profiles for more than 7500 funds. We’ll discuss those more below. The third was our recent presence at the Morningstar Investment Conference. None of them would be possible without your support, and so thanks!
I spent about 48 hours at Morningstar and was listening to folks for about 30 hours. I posted my impressions to our discussion board and several stirred vigorous discussions. For your benefit, here’s a sort of Top Ten list of things I learned at Morningstar and links to the ensuing debates on our discussion board.
Day One: Northern Trust on emerging and frontier investing
Attended a small lunch with Northern managers. Northern primarily caters to the rich but has retail share class funds, FlexShare ETFs and multi-manager funds for the rest of us. They are the world’s 5th largest investor in frontier markets. Frontier markets are currently 1% of global market cap, emerging markets are 12% and both have GDP growth 350% greater than the developed world’s. EM/F stocks sell at a 20% discount to developed stocks. Northern’s research shows that the same factors that increase equity returns in the developed world (small, value, wide moat, dividend paying) also predict excess returns in emerging and frontier markets. In September 2012 they launched the FlexShares Emerging Markets Factor Tilt Index Fund (TLTE) that tilts toward Fama-French factors, which is to say it holds more small and more value than a standard e.m. index.
Day One: Smead Value (SMVLX)
Interviewed Bill Smead, an interesting guy, who positions himself against the “brilliant pessimists” like Grantham and Hussman. Smead argues their clients have now missed four years of phenomenal gains. Their thesis is correct (as were most of the tech investor theses in 1999) but optimism has been in such short supply that it became valuable. He launched Smead Value in 2007 with a simple strategy: buy and hold (for 10 to, say, 100 years) excellent companies. Pretty radical, eh? He argues that the fund universe is 35% passive, 5% active and 60% overly active. Turns out that he’s managed it to top 1-2% returns over most trailing periods. Much the top performing LCB fund around. There’s a complete profile of the fund below.
Day One: Morningstar’s expert recommendations on emerging managers
Consuelo Mack ran a panel discussion with Russ Kinnel, Laura Lallos, Scott Burns and John Rekenthaler. One question: “What are your recommendations for boutique firms that investors should know about, but don’t? Who are the smaller, emerging managers who are really standing out?”
Dead silence. Glances back and forth. After a long silence: FPA, Primecap and TFS.
There are two possible explanations: (1) Morningstar really has lost touch with anyone other than the top 20 (or 40 or whatever) fund complexes or (2) Morningstar charged dozens of smaller fund companies to be exhibitors at their conference and was afraid to offend any of them by naming someone else.
Since we notice small funds and fund boutiques, we’d like to offer the following answers that folks could have given:
Well, Consuelo, a number of advisors are searching for management teams that have outstanding records with private accounts and/or hedge funds, and are making those teams and their strategies available to the retail fund world. First rate examples include ASTON, RiverNorth and RiverPark.
Or
That’s a great question, Consuelo. Individual investors aren’t the only folks tired of dealing with oversized, underperforming funds. A number of first-tier investors have walked away from large fund complexes to launch their own boutiques and to pursue a focused investing vision. Some great places to start would be with the funds from Grandeur Peak, Oakseed, and Seafarer.
Mr. Mansueto did mention, in his opening remarks, an upcoming Morningstar initiative to identify and track “emerging managers.” If so, that’s a really good sign for all involved.
Day One: Michael Mauboussin on luck and skill in investing
Mauboussin works for Credit Suisse, Legg Mason before that and has written The Success Equation: Untangling Skill and Luck in Business, Sports, and Investing (2012). Here’s his Paradox of Skill: as the aggregate level of skill rises, luck becomes a more important factor in separating average from way above average. Since you can’t count on luck, it becomes harder for anyone to remain way above average. Ted Williams hit .406 in 1941. No one has been over .400 since. Why? Because everyone has gotten better: pitchers, fielders and hitters. In 1941, Williams’ average was four standard deviations above the norm. In 2012, a hitter up by four s.d. would be hitting “just” .380. The same thing in investing: the dispersion of returns (the gap between 50th percentile funds and 90th percentile funds) has been falling for 50 years. Any outsized performance is now likely luck and unlikely to persist.
This spurred a particularly rich discussion on the board.
Day Two: Matt Eagan on where to run now
Day Two started with a 7:00 a.m. breakfast sponsored by Litman Gregory. (I’ll spare you the culinary commentary.) Litman runs the Masters series funds and bills itself as “a manager of managers.” The presenters were two of the guys who subadvise for them, Matt Eagan of Loomis Sayles and David Herro of Oakmark. Eagan helps manage the strategic income, strategic alpha, multi-sector bond, corporate bond and high-yield funds for LS. He’s part of a team named as Morningstar’s Fixed-Income Managers of the Year in 2009.
Eagan argues that fixed income is influenced by multiple cyclical risks, including market, interest rate and reinvestment risk. He’s concerned with a rising need to protect principal, which leads him to a neutral duration, selective shorting and some currency hedges (about 8% of his portfolios).
He’s concerned that the Fed has underwritten a hot-money move into the emerging markets. The fundamentals there “are very, very good and we see their currencies strengthening” but he’s made a tactical withdrawal because of some technical reasons (I have “because of a fund-out window” but have no idea of what that means) which might foretell a drop “which might be violent; when those come, you’ve just got to get out of the way.”
He finds Mexico to be “compelling long-term story.” It’s near the US, it’s capturing market share from China because of the “inshoring” phenomenon and, if they manage to break up Pemex, “you’re going to see a lot of growth there.”
Europe, contrarily, “is moribund at best. Our big hope is that it’s less bad than most people expect.” He suspects that the Europeans have more reason to stay together than to disappear, so they likely will, and an investor’s challenge is “to find good corporations in bad Zip codes.”
In the end:
- avoid indexing – almost all of the fixed income indexes are configured to produce “negative real yields for the foreseeable future” and most passive products are useful mostly as “just liquidity vehicles.”
- you can make money in the face of rising rates, something like a 3-4% yield with no correlation to the markets.
- avoid Treasuries and agencies
- build a yield advantage by broadening your opportunity set
- look at convertible securities and be willing to move within a firm’s capital structure
- invest overseas, in particular try to get away from the three reserve currencies.
Eagan manages a sleeve of Litman Gregory Masters Alternative Strategies (MASNX), which we’ve profiled and which has had pretty solid performance.
Day Two: David Herro on emerging markets and systemic risk
The other breakfast speaker was David Herro of Oakmark International. He was celebrated in our May 2013 essay, “Of Oaks and Acorns,” that looked at the success of Oakmark international analysts as fund managers.
Herro was asked about frothy markets and high valuations. He argues that “the #1 risk to protect against is the inability of companies to generate profits – macro-level events impact price but rarely impact long-term value. These macro-disturbances allow long-term investors to take advantage of the market’s short-termism.” The ’08-early ’09 events were “dismal but temporary.”
Herro notes that he had 20% of his flagship in the emerging markets in the late 90s, then backed down to zero as those markets were hit by “a wave of indiscriminate inflows.” He agrees that emerging markets will “be the propellant of global economic growth for the next 20 years” but, being a bright guy, warns that you still need to find “good businesses at good prices.” He hasn’t seen any in several years but, at this rate, “maybe in a year we’ll be back in.”
His current stance is that a stock needs to have 40-50% upside to get into his portfolio today and “some of the better quality e.m. firms are within 10-15% of getting in.” (Since then the e.m. indexes briefly dropped 7% but had regained most of that decline by June 30.) He seemed impressed, in particular, with the quality of management teams in Latin America (“those guys are really experienced with handling adversity”) but skeptical of the Chinese newbies (“they’re still a little dodgy”).
He also announced a bias “against reserve currencies.” That is, he thinks you’re better off buying earnings which are not denominated in dollars, Euros or … perhaps, yen. His co-presenter, Matt Eagan of Loomis Sayles, has the same bias. He’s been short the yen but long the Nikkei.
In terms of asset allocation, he thinks that global stocks, especially blue chips “are pretty attractively priced” since values have been rising faster than prices have. Global equities, he says, “haven’t come out of their funk.” There’s not much of a valuation difference between the US and the rest of the developed world (the US “is a little richer” but might deserve it), so he doesn’t see overweighting one over the other.
Day Two: Jack Bogle ‘s inconvenient truths
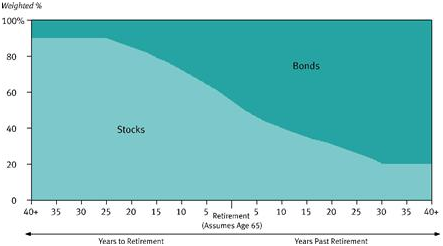
Don Phillips had a conversation with Bogle in a huge auditorium that, frankly, should dang well have had more people in it. I think the general excuse is, “we know what Bogle’s going to say, so why listen?” Uhhh … because Bogle’s still thinking clearly, which distinguishes him from a fair number of his industry brethren? He weighed in on why money market funds cost more than indexed stock funds (the cost of check cashing) and argued that our retirement system is facing three train wrecks: (1) underfunding of the Social Security system – which is manageable if politicians chose to manage it, (2) “grotesquely underfunded” defined benefit plans (a/k/a pension plans) whose managers still plan to earn 8% with a balanced portfolio – Bogle thinks they’ll be lucky to get 5% before expenses – and who are planning “to bring in some hedge fund guys” to magically solve their problem, and (3) defined contribution plans (401k’s and such) which allow folks to wreck their long-term prospects by cashing out for very little cause.
Bogle thinks that most target-date funds are ill-designed because they ignore Social Security, described by Bogle as “the best fixed-income position you’ll ever have.” The average lifetime SS benefit is something like $300,000. If your 401(k) contains $300,000 in stocks, you’ll have a 50/50 hybrid at retirement. If your 401(k) target-date fund is 40% in bonds, you’ll retire with a portfolio that’s 70% bonds (SS + target date fund) and 30% stocks. He’s skeptical of the bond market to begin with (he recommends that you look for a serious part of your income stream from dividend growth) and more skeptical of a product that buries you in bonds.
Finally, he has a strained relationship with his successors at Vanguard. On the one hand he exults that Vanguard’s structural advantage on expenses is so great “that nobody can match us – too bad for them, good for us.” And the other, he disagrees with most industry executives, including Vanguard’s, on regulations of the money market industry and the fund industry’s unwillingness – as owners of 35% of all stock – to stand up to cultures in which corporations have become “the private fiefdom of their chief executives.” (An issue addressed by The New York Times on June 29, “The Unstoppable Climb in CEO Pay.”) At base, “I don’t disagree with Vanguard. They disagree with me.”
Day Three: Sextant Global High Income
This is an interesting one and we’ll have a full profile of the fund in August. The managers target a portfolio yield of 8% (currently they manage 6.5% – the lower reported trailing 12 month yield reflects the fact that the fund launched 12 months ago and took six months to become fully invested). There are six other “global high income” funds – Aberdeen, DWS, Fidelity, JohnHancock, Mainstay, Western Asset. Here’s the key distinction: Sextant pursues high income through a combination of high dividend stocks (European utilities among them), preferred shares and high yield bonds. Right now about 50% of the portfolio is in stocks, 30% bonds, 10% preferreds and 10% cash. No other “high income” fund seems to hold more than 3% equities. That gives them both the potential for capital appreciation and interest rate insulation. They could imagine 8% from income and 2% from cap app. They made about 9.5% over the trailing twelve months through 5/31.
Day Three: Off-the-record worries
I’ve had the pleasure of speaking with some managers frequently over months or years, and occasionally we have conversations where I’m unsure that statements were made for attribution. Here are four sets of comments attributable to “managers” who I think are bright enough to be worth listening to.
More than one manager is worried about “a credit event” in China this year. That is, the central government might precipitate a crisis in the financial system (a bond default or a bank run) in order to begin cleansing a nearly insolvent banking system. (Umm … I think we’ve been having it and I’m not sure whether to be impressed or spooked that folks know this stuff.) The central government is concerned about disarray in the provinces and a propensity for banks and industries to accept unsecured IOUs. They are acting to pursue gradual institutional reforms (e.g., stricter capital requirements) but might conclude that a sharp correction now would be useful. One manager thought such an event might be 30% likely. Another was closer to “near inevitable.”
More than one manager suspects that there might be a commodity price implosion, gold included. A 200 year chart of commodity prices shows four spikes – each followed by a retracement of more than 100% – and a fifth spike that we’ve been in recently.
More than one manager offered some version of the following statement: “there’s hardly a bond out there worth buying. They’re essentially all priced for a negative real return.”
More than one manager suggested that the term “emerging markets” was essentially a linguistic fiction. About 25% of the emerging markets index (Korea and Taiwan) could be declared “developed markets” (though, on June 11, they were not) while Saudi Arabia could become an emerging market by virtue of a decision to make shares available to non-Middle Eastern investors. “It’s not meaningful except to the marketers,” quoth one.
Day Three: Reflecting on tchotchkes
Dozens of fund companies paid for exhibits at Morningstar – little booths inside the McCormick Convention Center where fund reps could chat with passing advisors (and the occasional Observer guy). One time honored conversation starter is the tchotchke: the neat little giveaway with your name on it. Firms embraced a stunning array of stuff: barbeque sauce (Scout Funds, from Kansas City), church-cooked peanuts (Queens Road), golf tees, hand sanitizers (inexplicably popular), InvestMints (Wasatch), micro-fiber cloths (Payden), flashlights, pens, multi-color pens, pens with styluses, pens that signal Bernanke to resume tossing money from a circling helicopter . . .
Ideally, you still need to think of any giveaway as an expression of your corporate identity. You want the properties of the object to reflect your sense of self and to remind folks of you. From that standard, the best tchotchke by a mile were Vanguard’s totebags. You wish you had one. Made of soft, heavy-weight canvas with a bottom that could be flattened for maximum capacity, they were unadorned except for the word “Vanguard.” No gimmicks, no flash, utter functionality in a product that your grandkids will fondly remember you carrying for years. That really says Vanguard. Good job, guys!

The second-best tchotchke (an exceedingly comfortable navy baseball cap with a sailboat logo) and single best location (directly across from the open bar and beside Vanguard) was Seafarer’s.
It’s Charles in Charge!
My colleague Charles Boccadoro has spearheaded one of our recent initiatives: extended risk profiles of over 7500 funds. Some of his work is reflected in the tables in our long/short fund story. Last month we promised to roll out his data in a searchable form for this month. As it turns out, the programmer we’re working with is still a few days away from a “search by ticker” engine. Once that’s been tested, chip will be able to quickly add other search fields.
As an interim move, we’re making all of Charles’ risk analyses available to you as a .pdf. (It might be paranoia, but I’m a bit concerned about the prospect of misappropriation of the file if we post it as a spreadsheet.) It runs well over 100 pages, so I’d be a bit cautious about hitting the “print” button.
Charles’ contributions have been so thoughtful and extensive that, in August, we’ll set aside a portion of the Observer that will hold an archive of all of his data-driven pieces. Our current plan is to introduce each of the longer pieces in this cover essay then take readers to Charles’ Balcony where complete story and all of his essays dwell. We’re following that model in …
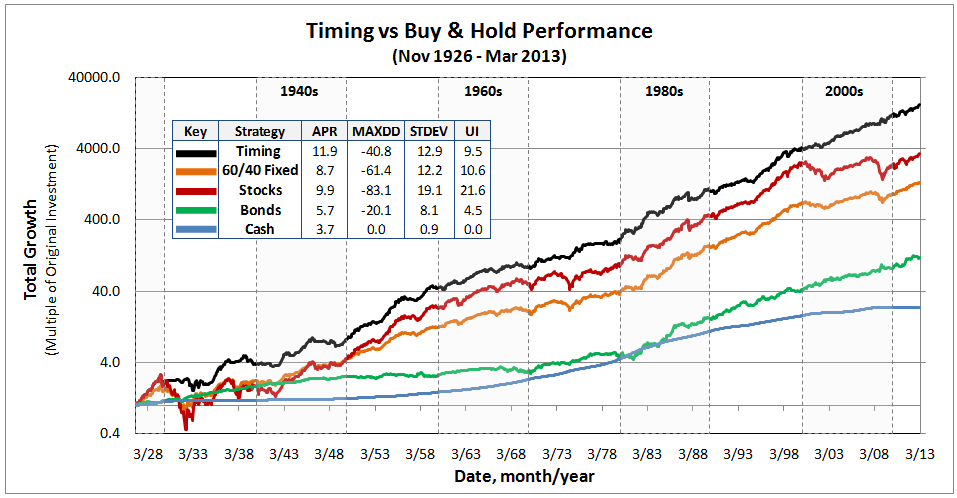
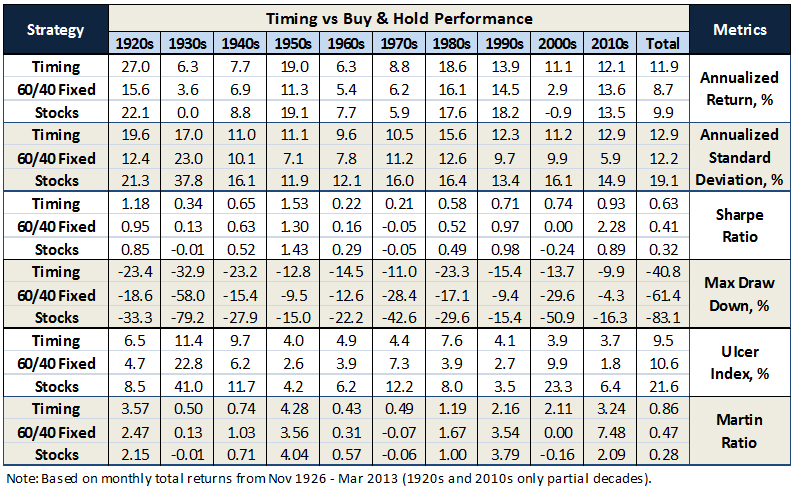
Timing method performance over ten decades
 The Healthy Debate. In Professor David Aronson’s 2006 book, entitled “Evidence-Based Technical Analysis,” he argues that subjective technical analysis, which is any analysis that cannot be reduced to a computer algorithm and back tested, is “not a legitimate body of knowledge but a collection of folklore resting on a flimsy foundation of anecdote and intuition.”
He further warns that falsehoods accumulate even with objective analysis and rules developed after-the-fact can lead to overblown extrapolations – fool’s gold biased by data-mining, more luck than legitimate prediction, in same category as “literate monkeys, Bible Codes, and lottery players.”
Read the full story here.
Announcing Mutual Fund Contacts, our new sister-site
I mentioned some months ago a plan to launch an affiliate site, Mutual Fund Contacts. June 28 marked the “soft launch” of MFC. MFC’s mission is to serve as a guide and resource for folks who are new at all this and feeling a bit unsteady about how to proceed. We imagine a young couple in their late 20s planning an eventual home purchase, a single mom in her 30s who’s trying to organize stuff that she’s not had to pay attention to, or a young college graduate trying to lay a good foundation.
Most sites dedicated to small investors are raucous places with poor focus, too many features and a desperate need to grab attention. Feh. MFC will try to provide content and resources that don’t quite fit here but that we think are still valuable. Each month we’ll provide a 1000-word story on the theme “the one-fund portfolio.” If you were looking for one fund that might yield a bit more than a savings account without a lot of downside, what should you consider? Each “one fund” article will recommend three options: two low-minimum mutual funds and one commission-free ETF. We’ll also have a monthly recommendation on three resources you should be familiar with (this month, the three books that any financially savvy person needs to start with) and ongoing resources (this month: the updated “List of Funds for Small Investors” that highlights all of the no-load funds available for $100 or less – plus a couple that are close enough to consider).
The nature of a soft launch is that we’re still working on the site’s visuals and some functionality. That said, it does offer a series of resources that, oh, say, your kids really should be looking at. Feel free to drop by Mutual Fund Contacts and then let us know how we can make it better.
Everyone loves a crisis
Larry Swedroe wrote a widely quoted, widely redistributed essay for CBS MoneyWatch warning that bond funds were covertly transforming themselves into stock funds in pursuit of additional yield. His essay opens with:
It may surprise you that, as of its last reporting date, there were 352 mutual funds that are classified by Morningstar as bond funds that actually held stocks in their portfolio. (I know I was surprised, and given my 40 years of experience in the investment banking and financial advisory business, it takes quite a bit to surprise me.) At the end of 2012, it was 312, up from 283 nine months earlier.
The chase for higher yields has led many actively managed bond funds to load up on riskier investments, such as preferred stocks. (Emphasis added)
Many actively managed bond funds have loaded up?
Let’s look at the data. There are 1177 bond funds, excluding munis. Only 104 hold more than 1% in stocks, and most of those hold barely more than a percent. The most striking aspect of those funds is that they don’t call themselves “bond” funds. Precisely 11 funds with the word “Bond” in their name have stocks in excess of 1%. The others advertise themselves as “income” funds and, quite often, “strategic income,” “high income” or “income opportunities” funds. Such funds have, traditionally, used other income sources to supplement their bond-heavy core portfolios.
How about Larry’s claim that they’ve been “bulking up”? I looked at the 25 stockiest funds to see whether their equity stake should be news to their investors. I did that by comparing their current exposure to the bond market with the range of exposures they’ve experienced over the past five years. Here’s the picture, ranked based on US stock exposure, starting with the stockiest fund:
|
|
|
Bond category |
Current bond exposure |
Range of bond exposure, 2009-2013 |
|
Ave Maria Bond |
AVEFX |
Intermediate |
61 |
61-71 |
|
Pacific Advisors Government Securities |
PADGX |
Short Gov’t |
82 |
82-87 |
|
Advisory Research Strategic Income |
ADVNX |
Long-Term |
16 |
n/a – new |
|
Northeast Investors |
NTHEX |
High Yield |
54 |
54-88 |
|
Loomis Sayles Strategic Income |
NEFZX |
Multisector |
65 |
60-80 |
|
JHFunds2 Spectrum Income |
JHSTX |
Multisector |
77 |
75-79 |
|
T. Rowe Price Spectrum Income |
RPSIX |
Multisector |
76 |
76-78 |
|
Azzad Wise Capital |
WISEX |
Short-Term |
42 |
20-42 * |
|
Franklin Real Return |
FRRAX |
Inflation-Prot’d |
47 |
47-69 |
|
Huntington Mortgage Securities |
HUMSX |
Intermediate |
85 |
83-91 |
|
Eaton Vance Bond |
EVBAX |
Multisector |
63 |
n/a – new |
|
Federated High Yield Trust |
FHYTX |
High Yield |
81 |
81-87 |
|
Pioneer High Yield |
TAHYX |
High Yield |
57 |
55-60 |
|
Chou Income |
CHOIX |
World |
33 |
16-48 |
|
Forward Income Builder |
AIAAX |
Multisector |
35 |
35-97 |
|
ING Pioneer High Yield Portfolio |
IPHIX |
High Yield |
60 |
50-60 |
|
Loomis Sayles High Income |
LSHIX |
High Yield |
61 |
61-70 |
|
Highland Floating Rate Opportunities |
HFRAX |
Bank Loan |
81 |
73-88 |
|
Epiphany FFV Strategic Income |
EPINX |
Intermediate |
61 |
61-69 |
|
RiverNorth/Oaktree High Income |
RNHIX |
Multisector |
56 |
n/a – new |
|
Astor Active Income ETF |
AXAIX |
Intermediate |
74 |
68-88 |
|
Fidelity Capital & Income |
FAGIX |
High Yield |
84 |
75-84 |
|
Transamerica Asset Allc Short Horizon |
DVCSX |
Intermediate |
85 |
79-87 |
|
Spirit of America Income |
SOAIX |
Long-term |
74 |
74-90 |
*WISEX invests within the constraints of Islamic principles. As a result, most traditional interest-paying, fixed-income vehicles are forbidden to it.
From this most stock-heavy group, 10 funds now hold fewer bonds than at any other point in the past five years. In many cases (see T Rowe Price Spectrum Income), their bond exposure varies by only a few percentage points from year to year so being light on bonds is, for them, not much different than being heavy on bonds.
The SEC’s naming rule says that if you have an investment class in your name (e.g. “Bond”) then at least 80% of your portfolio must reside in that class. Ave Maria Bond runs right up to the line: 19.88% US stocks, but warns you of that: “The Fund may invest up to 20% of its net assets in equity securities, which include preferred stocks, common stocks paying dividends and securities convertible into common stock.” Eaton Vance Bond is 12% and makes the same declaration: “The Fund may invest up to 20% of its net assets in common stocks and other equity securities, including real estate investment trusts.”
Bottom line: the “loading up” has been pretty durn minimal. The funds which have a substantial equity stake now have had a substantial equity stake for years, they market that fact and they name themselves to permit it.
Fidelity cries out: Run away!
Several sites have noted the fact that Fidelity Europe Cap App Fund (FECAX) has closed to new investors. Most skip the fact that it looks like the $400 million FECAX is about to get eaten, presumably by Fidelity Europe (FIEUX): “The Board has approved closing Fidelity Europe Capital Appreciation Fund effective after the close of business on July 19, 2013, as the Board and FMR are considering merging the fund.” (emphasis added)
Fascinating. Fidelity’s signaling the fact that they can no longer afford two Euro-centered funds. Why would that be the case?
I can only imagine three possibilities:
- Fidelity no longer finds with a mere $400 million in AUM viable, so the Cap App fund has to go.
- Fidelity doesn’t think there’s room for (or need for) more than one European stock strategy. There are 83 distinct U.S.-focused strategies in the Fidelity family, but who’d need more than one for Europe?
- Fidelity can no longer find managers capable of performing well enough to be worth the effort.
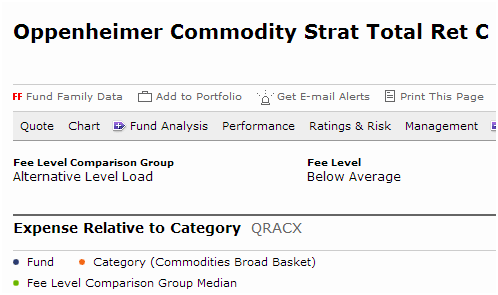
Expenses
Returns TTM
Returns 5 yr
Compared to peers – 5 yr
Fidelity European funds for British investors
Fidelity European Fund A-Accumulation
1.72% on $4.1B
22%
1.86
3.31
Fidelity Europe Long-Term Growth Fund
1.73 on $732M
29
n/a
n/a
Fidelity European Opportunities
1.73 on $723M
21
1.48
3.31
Fidelity European funds for American investors
Fidelity European Capital Appreciation
0.92% on $331M
24
(1.57)
(.81)
Fidelity Europe
0.80 on $724M
23
(1.21)
(0.40)
Fidelity Nordic
1.04% on $340M
32
(0.40)
The Morningstar peer group is “miscellaneous regions” – ignore it
Converted at ₤1 = $1.54, 25 June 2013.
In April of 2007, Fidelity tried to merge Nordic into Europe, but its shareholders refused to allow it. At the time Nordic was one of Fidelity’s best-performing international funds and had $600 million in assets. The announced rationale: “The Nordic region is more volatile than developed Europe as a whole, and Fidelity believes the region’s characteristics have changed sufficiently to no longer warrant a separate fund focused on the region.” The nature of those “changes” was not clear and shareholders were unimpressed.
It is clear that Fidelity has a personnel problem. When, for example, they wanted to bolster their asset allocation funds-of-funds, they added two new Fidelity Series funds for them to choose from. One is run by Will Danoff, whose Contrafund already has $95 billion in assets, and the other by Joel Tillinghast, whose Low-Priced Stock Fund lugs $40 billion. Presumably they would have turned to a young star with less on their plate … if they had a young star with less on their plate. Likewise, Fidelity Strategic Adviser Multi-Manager funds advertise themselves as being run by the best of the best; these funds have the option of using Fidelity talent or going outside when the options elsewhere are better. What conclusions might we draw from the fact that Strategic Advisers Core Multi-Manager (FLAUX) draws one of its 11 managers from Fido or that Strategic Advisers International Multi-Manager (FMJDX) has one Fido manager in 17? Both of the managers for Strategic Advisers Core Income Multi-Manager (FWHBX) are Fidelity employees, so it’s not simply that the SAMM funds are designed to showcase non-Fido talent.
I’ve had trouble finding attractive new funds from Fidelity for years now. It might well be that the contemplated retrenchment in their Europe line-up reflects the fact that Fido’s been having the same trouble.
Observer Fund Profiles:
Each month the Observer provides in-depth profiles of between two and four funds. Our “Most Intriguing New Funds” are funds launched within the past couple years that most frequently feature experienced managers leading innovative newer funds. “Stars in the Shadows” are older funds that have attracted far less attention than they deserve.
Forward Income Builder (IAIAX): “income,” not “bonds.” This is another instance of a fund that has been reshaped in recent years into an interesting offering. Perception just hasn’t yet caught up with the reality.
Smead Value (SMVLX): call it “Triumph of the Optimists.” Mr. Smead dismisses most of what his peers are doing as poorly conceived or disastrously poorly-conceived. He thinks that pessimism is overbought, optimism in short supply and a portfolio of top-tier U.S. stocks held forever as your best friend.
Elevator Talk #5: Casey Frazier of Versus Capital Multi-Manager Real Estate Income Fund
Since the number of funds we can cover in-depth is smaller than the number of funds worthy of in-depth coverage, we’ve decided to offer one or two managers each month the opportunity to make a 200 word pitch to you. That’s about the number of words a slightly-manic elevator companion could share in a minute and a half. In each case, I’ve promised to offer a quick capsule of the fund and a link back to the fund’s site. Other than that, they’ve got 200 words and precisely as much of your time and attention as you’re willing to share. These aren’t endorsements; they’re opportunities to learn more.
 Versus Capital Multi-Manager Real Estate Income Fund is a closed-end interval fund. That means that you can buy Versus shares any day that the market is open, but you only have the opportunity to sell those shares once each quarter. The advisor has the option of meeting some, all or none of a particular quarter’s redemption requests, based on cash available and the start of the market.
The argument for such a restrictive structure is that it allows managers to invest in illiquid asset classes; that is, to buy and profit from things that cannot be reasonably bought or sold on a moment’s notice. Those sorts of investments have been traditionally available only to exceedingly high net-worth investors either through limited partnerships or direct ownership (e.g., buying a forest). Several mutual funds have lately begun creating into this space, mostly structured as interval funds. Vertical Capital Income Fund (VCAPX), the subject of our April Elevator Talk, was one such. KKR Alternative Corporate Opportunities Fund, from private equity specialist Kohlberg Kravis Roberts, is another.
Casey Frazieris Chief Investment Officer for Versus, a position he’s held since 2011. From 2005-2010, he was the Chief Investment Officer for Welton Street Investments, LLC and Welton Street Advisors LLC. Here’s Mr. Frazier’s 200 (and 16!) words making the Versus case:
We think the best way to maximize the investment attributes of real estate – income, diversification, and inflation hedge – is through a blended portfolio of private and public real estate investments. Private real estate investments, and in particular the “core” and “core plus” segments of private real estate, have historically offered steady income, low volatility, low correlation, good diversification, and a hedge against inflation. Unfortunately institutional private real estate has been out of reach of many investors due to the large size of the real estate assets themselves and the high minimums on the private funds institutional investors use to gain exposure to these areas. With the help of institutional consultant Callan Associates, we’ve built a multi-manager portfolio in a 40 Act interval structure we feel covers the spectrum of a core real estate allocation. The allocation includes real estate private equity and debt, public equity and debt, and broad exposure across asset types and geographies. We target a mix of 70% private real estate with 30% public real estate to enhance liquidity, and our objective is to produce total returns in the 7% – 9% range net of fees with 5% – 6% of that coming from income. Operationally, the fund has daily pricing, quarterly liquidity at NAV, quarterly income, 1099 reporting and no subscription paperwork.
Versus offers a lot of information about private real estate investing on their website. Check the “fund documents” page. The fund’s retail, F-class shares carry an annual expense of 3.30% and a 2.00% redemption fee on shares held less than one year. The minimum initial investment is $10,000.
Conference Call Upcoming: RiverNorth/Oaktree High Income, July 11, 3:15 CT
While the Observer’s conference call series is on hiatus for the summer (the challenge of coordinating schedules went from “hard” to “ridiculous”), we’re pleased to highlight similar opportunities offered by folks we’ve interviewed and whose work we respect.
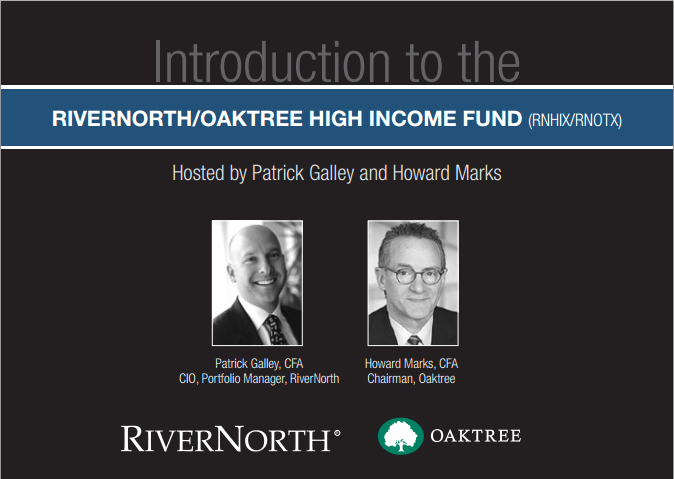
In that vein, we’d like to invite you to join in on a conference call hosted by RiverNorth to highlight the early experience of RiverNorth/Oaktree High Income Fund. The fund is looking for high total return, rather than income per se. As of May 31, 25% of the portfolio was allocated to RiverNorth’s tactical closed-end fund strategy and 75% to Oaktree. Oaktree has two strategies (high yield bond and senior loan) and it allocates more or less to each depending on the available opportunity set.
Why might you want to listen in? At base, both RiverNorth and Oaktree are exceedingly successful at what they do. Oaktree’s services are generally not available to retail investors. RiverNorth’s other strategic alliances have ranged from solid (with Manning & Napier) to splendid (with DoubleLine). On the surface the Oaktree alliance is producing solid results, relative to their Morningstar peer group, but the fund’s strategies are so distinctive that I’m dubious of the peer comparison.
If you’re interested, the RiverNorth call will be Thursday, July 11, from 3:15 – 4:15 Central. The call is web-based, so you’ll be able to read supporting visuals while the guys talk. Callers will have the opportunity to ask questions of Mr. Marks and Mr. Galley. Because RiverNorth anticipates a large crowd, you’ll submit your questions by typing them rather than speaking directly to the managers.
How can you join in? Just click

You can also get there by visiting RiverNorthFunds.com and clicking on the Events tab.
Launch Alert
Artisan Global Small Cap (ARTWX) launched on June 25, after several delays. It’s managed by Mark Yockey and his new co-managers/former analysts, Charles-Henri Hamker and Dave Geisler. They’ll apply the same investment discipline used in Artisan Global Equity (ARTHX) with a few additional constraints. Global Small will only invest in firms with a market cap of under $4 billion at the time of purchase and might invest up to 50% of the portfolio in emerging markets. Global Equity has only 7% of its money in small caps and can invest no more than 30% in emerging markets (right now it’s about 14%). Just to be clear: this team runs one five-star fund (Global), two four-star ones (International ARTIX and International Small Cap ARTJX), Mr. Yockey was Morningstar’s International Fund Manager of the Year in 1998 and he and his team were finalists again in 2012. It really doesn’t get much more promising than that. The expenses are capped at 1.50%. The minimum initial investment is $1000.
RiverPark Structural Alpha (RSAFX and RSAIX) launched on Friday, June 28. The fund will employ a variety of options investment strategies, including short-selling index options that the managers believe are overpriced. A half dozen managers and two fund presidents have tried to explain options-based strategies to me. I mostly glaze over and nod knowingly. I have become convinced that these represent fairly low-volatility tools for capturing most of the stock market’s upside. The fund will be comanaged by Justin Frankel and Jeremy Berman. This portfolio was run as a private partnership for five years (September 2008 – June 2013) by the same managers, with the same strategy. Over that time they managed to return 10.7% per year while the S&P 500 made 6.2%. The fund launched at the end of September, 2008, and gained 3.55% through year’s end. The S&P500 dropped 17.7% in that same quarter. While the huge victory over those three months explains some of the fund’s long-term outperformance, its absolute returns from 2009 – 2012 are still over 10% a year. You might choose to sneeze at a low-volatility, uncorrelated strategy that makes 10% annually. I wouldn’t. The fund’s expenses are hefty (retail shares retain the 2% part of the “2 and 20” world while institutional shares come in at 1.75%). The minimum initial investment will be $1000.
Funds in Registration
New mutual funds must be registered with the Securities and Exchange Commission before they can be offered for sale to the public. The SEC has a 75-day window during which to call for revisions of a prospectus; fund companies sometimes use that same time to tweak a fund’s fee structure or operating details. Every day we scour new SEC filings to see what opportunities might be about to present themselves. Many of the proposed funds offer nothing new, distinctive or interesting.
Funds in registration this month won’t be available for sale until, typically, the end of August 2013. There were 13 funds in registration with the SEC this month, through June 25th. The most interesting, by far, is:
RiverPark Strategic Income Fund. David Sherman of Cohanzick Management, who also manages the splendid but closed RiverPark Short Term High Yield Fund (RPHYX, see below) will be the manager. This represents one step out on the risk/return spectrum for Mr. Sherman and his investors. He’s giving himself the freedom to invest across the income-producing universe (foreign and domestic, short- to long-term, investment and non-investment grade debt, preferred stock, convertible bonds, bank loans, high yield bonds and up to 35% income producing equities) while maintaining a very conservative discipline. In repeated conversations, it’s been very clear that Mr. Sherman has an intense dislike of losing his investors’ money. His plan is to pursue an intentionally conservative strategy by investing only in those bonds that he deems “Money Good” and stocks whose dividends are secure. He also can hedge the portfolio and, as with RPHYX, he intends to hold securities until maturity which will make much of the fund’s volatility more apparent than real. The expense ratio is 1.25% for retail shares, 1.00% for institutional. The minimum initial investments will be $1000 for retail and $1M for institutional.
Details and the list of all of the funds in registration are available at the Observer’s Funds in Registration page or by clicking “Funds” on the menu atop each page.
Manager Changes
On a related note, we also tracked down a near-record 64 fund manager changes.
Briefly Noted . . .
If you own a Russell equity fund, there’s a good chance that your management team just changed. Phillip Hoffman took over the lead for a couple funds but also began swapping out managers on some of their multi-manager funds. Matthew Beardsley was been removed from management of the funds and relocated into client service.
SMALL WINS FOR INVESTORS
Seventeen BMO Funds dropped their 2.00% redemption fees this month.
BRC Large Cap Focus Equity Fund (BRCIX)has dropped its management fee from 0.75% to 0.47% and capped its total expenses at 0.55%. It’s an institutional fund that launched at the end of 2012 and has been doing okay.
LK Balanced Fund (LKBLX) reduced its minimum initial investment for its Institutional Class Shares from $50,000 to $5,000 for IRA accounts. Tiny fund, very fine long-term record but a new management team as of June 2012.
Schwab Fundamental International Small Company Index Fund (SFILX) and Schwab Fundamental Emerging Markets Large Company Index Fund (SFENX) have capped their expenses at 0.49%. That’s a drop of 6 and 11 basis points, respectively.
CLOSINGS (and related inconveniences)
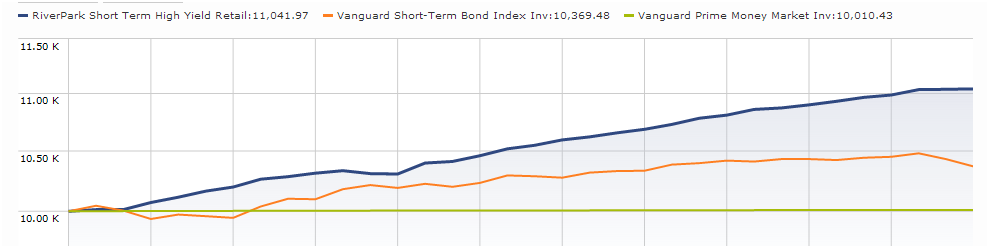
Good news for RPHYX investors, bad news for the rest of you. RiverPark Short Term High Yield (RPHYX) has closed to new investors. The manager has been clear that this really distinctive cash-management fund had a limited capacity, somewhere between $600 million and $1 billion. I’ve mentioned several times that the closure was nigh. Below is the chart of RPHYX (blue) against Vanguard’s short-term bond index (orange) and prime money market (green).
OLD WINE, NEW BOTTLES
For all of the excitement over China as an investment opportunity, China-centered funds have returned a whoppin’ 1.40% over the past five years. BlackRock seems to have noticed and they’ve hit the Reset button on BlackRock China Fund (BACHX). As of August 16, it will become BlackRock Emerging Markets Dividend Fund. One wonders if the term “chasing last year’s hot idea” is new to them?
On or about August 5, 2013, Columbia Energy and Natural Resources Fund (EENAX, with other tickers for its seven other share classes) will be renamed Columbia Global Energy and Natural Resources Fund. There’s no change to the strategy and the fund is already 35% non-U.S., so it’s just marketing fluff.
“Beginning on or about July 1, 2013, all references to ING International Growth Fund (IIGIX) are hereby deleted and replaced with ING Multi-Manager International Equity Fund.” Note to ING: the multi-manager mish-mash doesn’t appear to be a winning strategy.
Effective May 22, ING International Small Cap Fund (NTKLX) may invest up to 25% of its portfolio in REITs.
Effective June 28, PNC Mid Cap Value Fund became PNC Mid Cap Fund (PMCAX).
Effective June 1, Payden Value Leaders Fund became Payden Equity Income Fund (PYVLX). With only two good years in the past 11, you’d imagine that more than the name ought to be rethought.
OFF TO THE DUSTBIN OF HISTORY
Geez, the dustbin is filling quickly.
The Alternative Strategies Mutual Fund (AASFX) closed to new investors in June and will liquidate by July 26, 2013. It’s a microscopic fund-of-funds that, in its best year, trailed 75% of its peers. A 2.5% expense ratio didn’t help.
Hansberger International Value Fund (HINTX) will be liquidated on or about July 19, 2013. It’s moved to cash pending dissolution.
ING International Value Fund (IIVWX) is merging into ING International Value Equity (IGVWX ), formerly ING Global Value Choice. This would be a really opportune moment for ING investors to consider their options. ING is merging the larger fund into the smaller, a sign that the marketers are anxious to bury the worst of the ineptitude. Both funds have been run by the same team since December 2012. This is the sixth management team to run the fund in 10 years and the new team’s record is no better than mediocre.
In case you hadn’t noticed, Litman Gregory Masters Value Fund (MSVFX) was absorbed by Litman Gregory Masters Equity Fund (MSENX) in late June, 2013. Litman Gregory’s struggles should give us all pause. You have a firm whose only business is picking winning fund managers and assembling them into a coherent portfolio. Nonetheless, Value managed consistently disappointing returns and high volatility. How disappointing? Uhh … they thought it was better to keep a two-star fund that’s consistently had higher volatility and lower returns than its peers for the past decade. We’re going to look at the question, “what’s the chance that professionals can assemble a team of consistently winning mutual fund managers?” when we examine the record (generally parlous) of multi-manager funds in an upcoming issue.
Driehaus Large Cap Growth Fund (DRLGX) was closed on June 11 and, as of July 19, the Fund will begin the process of liquidating its portfolio securities.
The Board of Fairfax Gold and Precious Metals Fund (GOLMX and GOLLX) “has concluded that it is in the best interests of the Fund and its shareholders that the Fund cease operations,” which they did on June 29, 2013
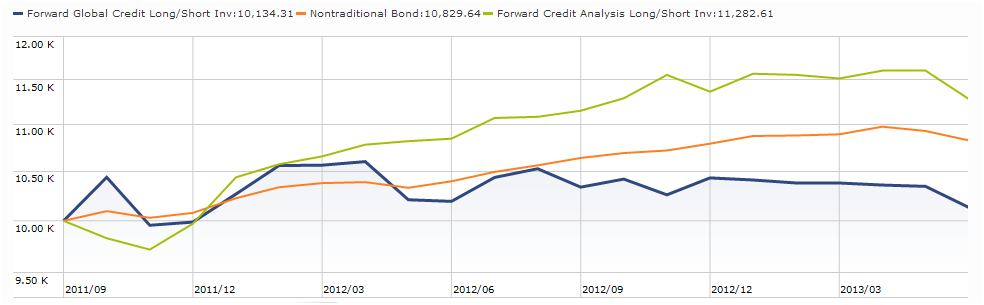
Forward Global Credit Long/Short Fund (FGCRX) will be liquidated on or around July 26, 2013. I’m sure this fund seemed like a good idea at the time. Forward’s domestic version of the fund (Forward Credit Analysis Long/Short, FLSRX) has drawn $800 million into a high risk/high expense/high return portfolio. The global fund, open less than two years, managed the “high expense” part (2.39%) but pretty much flubbed on the “attract investors and reward them” piece. The light green line is the original and dark blue is Global, since launch.
Henderson World Select Fund (HFPAX) will be liquidated on or about August 30, 2013.
The $13 million ING DFA Global Allocation Portfolio (IDFAX) is slated for liquidation, pending shareholder approval, likely in September.
ING has such a way with words. They announced that ING Pioneer Mid Cap Value Portfolio (IPMVX, a/k/a “Disappearing Portfolio”) will be reorganized “with and into the following ‘Surviving Portfolio’ (the ‘Reorganization’):
|
Disappearing Portfolio |
Surviving Portfolio |
|
ING Pioneer Mid Cap Value Portfolio |
ING Large Cap Value Portfolio |
So, in the best case, a shareholder is The Survivor? What sort of goal is that? “Hi, gramma! I just invested in a mutual fund that I hope will survive?” Suddenly the Bee Gees erupt in the background with “stayin’ alive, stayin’ alive, ah, ah, ah … “ Guys, guys, guys. The disappearance is scheduled to occur just after Labor Day.
Stephen Leeb wrote The Coming Economic Collapse (2008). The economy didn’t, his fund did. Leeb Focus Fund (LCMFX) closed at the end of June, having parlayed Mr. Leeb’s insights into returns that trailed 98% of its peers since launch.
On June 20, 2013, the board of directors of the Frontegra Funds approved the liquidation of the Lockwell Small Cap Value Fund (LOCSX). Lockwell had a talented manager who was a sort of refugee from a series of fund mergers, acquisitions and liquidations in the industry. We profiled LOCSX and were reasonably positive about its prospects. The fund performed well but never managed to attract assets, partly because small cap investing has been out of favor and partly because of an advertised $100,000 minimum. In addition to liquidating the fund, the advisor is closing his firm.
Tributary Core Equity Fund (FOEQX) will liquidate around July 26, 2013. Tributary Balanced (FOBAX), which we’ve profiled, remains small, open and quite attractive.
I’ve mentioned before that I believe Morningstar misleads investors with their descriptions of a fund’s fee level (“high,” “above average” and so on) because they often use a comparison group that investors would never imagine. Both Tributary Balanced and Oakmark Equity & Income (OAKBX) have $1000 minimum investments. In each case, Morningstar insists on comparing them to their Moderate Allocation Institutional group. Why?
In Closing . . .
We have a lot going on in the month ahead: Charles is working to create a master listing of all the funds we’ve profiled, organized by strategy and risk. Andrew and Chip are working to bring our risk data to you in an easily searchable form. Anya and Barb continue playing with graphics. I’ve got four profiles underway, based on conversations I had at Morningstar.
And … I get to have a vacation! When you next hear from me, I’ll be lounging on the patio of LeRoy’s Water Street Coffee Shop in lovely Ephraim, Wisconsin, on the Door County peninsula. I’ll send pictures, but I promise I won’t be gloating when I’m doing it.


 This comes up only because I was moved to sudden and profound pity over the cruel ways in which the poor, innocent rich folks are being ruthlessly exploited. Two new articles highlight their plight.
 “it’s somewhere between highly probable and certain that you will underperform [a stock portfolio] if you are being sold commodities, hedge funds and private equity right now.”
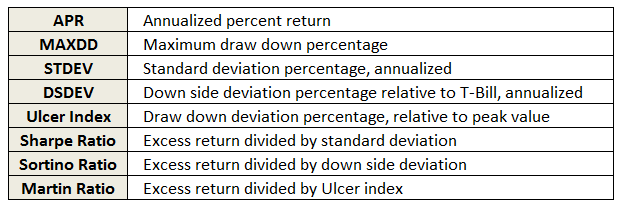
 Does it make sense to you that you could profit from following the real-life choices of the professionals in your life? What hospital does your doctor use when her family needs one? Where does the area’s best chef eat when he wants to go out for a weeknight dinner? Which tablet computer gets Chip and her IT guys all shiny-eyed?
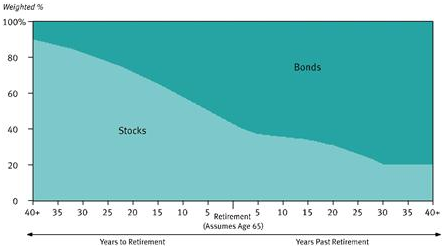

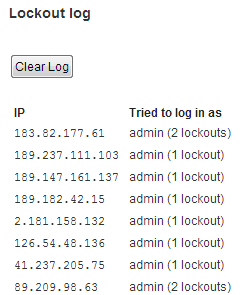 MFO has periodically been the object of as many at 400 break-in attempts an hour. Either manually or through our security software we’ve “blacklisted” nearly a thousand IP addresses, including a vast number from China.
 Alan Abelson (October 12, 1925 – May 9, 2013), Barron’s columnist and former editor, passed away at age 87. He joined Barron’s the year I was born, began his “Up & Down Wall Street” column during the Johnson Administration and continued it for 47 years. His crankiness made him, for a long while, one of the folks I actively sought out each week. In recent years he seemed to have become a sort of parody of his former self, cranky on principle rather than for any particular cause. I’ll remember him fondly and with respect. Randall Forsyth will continue the column.
 Speaking of cranks, John Rekenthaler has resumed his