
Originally published in November 1, 2014 Commentary
I’ve been fully invested in the market for the past 14 years with little to show for it, except frustration and proclamations of even more frustration ahead. During this time, basically since start of 21st century, my portfolio has returned only 3.9% per year, substantially below historical return of the last century, which includes among many other things The Great Depression.
I’ve suffered two monster drawdowns, each halving my balance. I’ve spent 65 months looking at monthly statements showing retractions of at least 20%. And, each time I seem to climb-out, I’m greeted with headlines telling me the next big drop is just around the corner (e.g., “How to Prepare for the Coming Bear Market,” and “Are You Prepared for a Stock Selloff ?“)
I have one Nobel Prize winner telling me the market is still overpriced, seeming every chance he gets. And another telling me that there is nothing I can do about it…that no amount of research will help me improve my portfolio’s performance.
Welcome to US stock market investing in the new century…in the new millennium.
The chart below depicts S&P 500 total return, which includes reinvested dividends, since December 1968, basically during the past 46 years. It uses month-ending returns, so intra-day and intra-month fluctuations are not reflected, as was done in a similar chart presented in Ten Market Cycles. The less frequent perspective discounts, for example, bear sightings from bear markets.
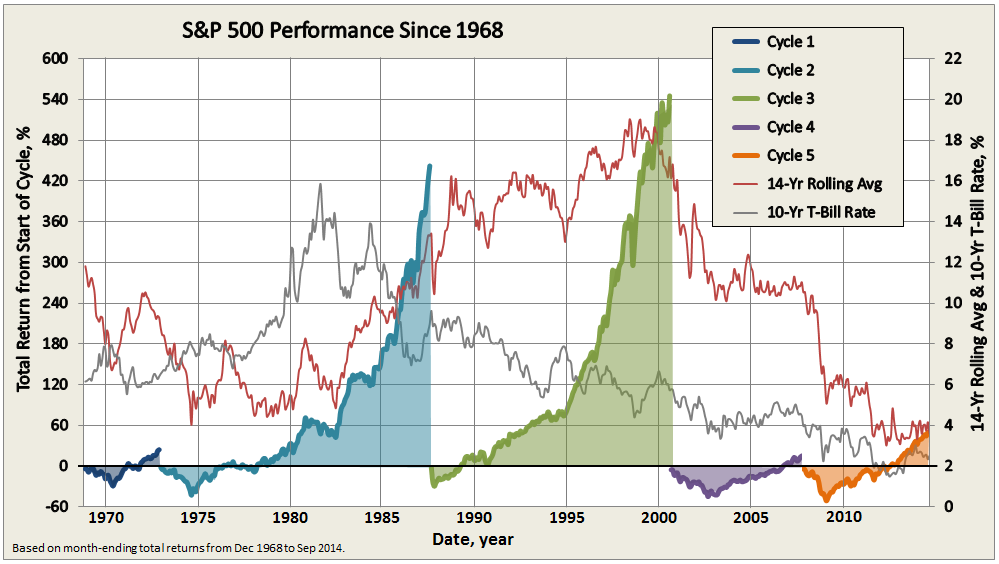
The period holds five market cycles, the last still in progress, each cycle comprising a bear and bull market, defined as a 20% move opposite preceding peak or trough, respectively. The last two cycles account for the mediocre annualized returns of 3.9%, across 14-years, or more precisely 169 months through September 2014.
Journalist hyperbole about how “share prices have almost tripled since the March 2009 low” refers to the performance of the current bull market, which indeed accounts for a great 21.9% annualized return over the past 67 months. Somehow this performance gets decoupled from the preceding -51% return of the financial crisis bear. Cycle 4 holds a similar story, only investors had to suffer 40 months of protracted 20% declines during the tech bubble bear before finally eking out a 2% annualized return across its 7-year full cycle.
Despite advances reflected in the current bull run, 14-year annualized returns (plotted against the secondary axis on the chart above) are among the lowest they been for the S&P 500 since September 1944, when returns reflected impacts of The Great Depression and World War II.
Makes you wonder why anybody invests in the stock market.
I suspect all one needs to do is see the significant potential for upside, as witnessed in Cycles 2-3. Our current bull pales in comparison to the truly remarkable advances of the two bull runs of 1970-80s and 1990s. An investment of $10,000 in October 1974, the trough of 1973-74, resulted in a balance of $610,017 by August 2000 – a 6000% return, or 17.2% for nearly 26 years, which includes the brief bear of 1987 and its coincident Black Monday.
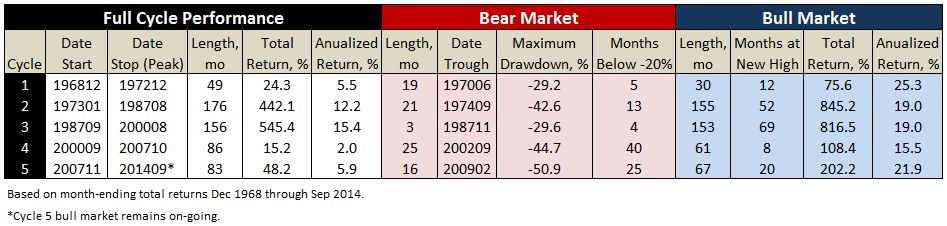
Here’s a summary of results presented in the above graph, showing the dramatic differences between the two great bull markets at the end of the last century with the first two of the new century, so far:
But how many funds were around to take advantage 40 years ago? Answer: Not many. Here’s a count of today’s funds that also existed at the start of the last five bull markets:
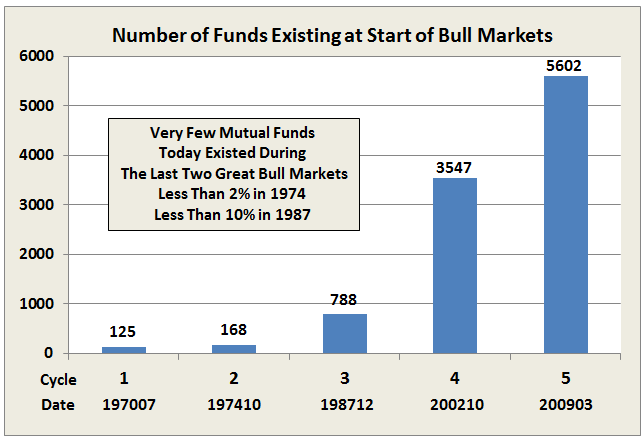
Makes you wonder whether the current mediocrity is simply due to too many people and perhaps too much money chasing too few good ideas?
The long-term annualized absolute return for the S&P 500 is 10%, dating back to January 1926 through September 2014, about 89 years (using database derived from Goyal and Shiller websites). But the position held currently by many value oriented investors, money-managers, and CAPE Crusaders is that we will have to suffer mediocre returns for the foreseeable future…at some level to make-up for excessive valuations at the end of the last century. Paying it seems for sins of our fathers.
Of course, high valuation isn’t the only concern expressed about the US stock market. Others believe that the economy will face significant headwinds, making it hard to repeat higher market returns of years past. Rob Arnott describes the “3-D Hurricane Force Headwind” caused by waves of Deficit spending, which artificially props-up GDP, higher than published Debt, and aging Demographics.
Expectations for US stocks for the next ten years is very low, as depicted in the new risk and return tool on Research Affiliates’ website (thanks to Meb Faber for heads-up here). Forecast for large US equities? Just 0.7% total return per year. And small caps? Zero.
Good grief.
What about bonds?
Plotted also on the first chart above is 10-year average T-Bill interest rate. While it has trended down since the early 1980’s, if there is a correlation between it and stock performance, it is not obvious. What is obvious is that since interest rates peaked in 1981, US aggregate bonds have been hands-down superior to US stocks for healthy, stable, risk-adjusted returns, as summarized below:
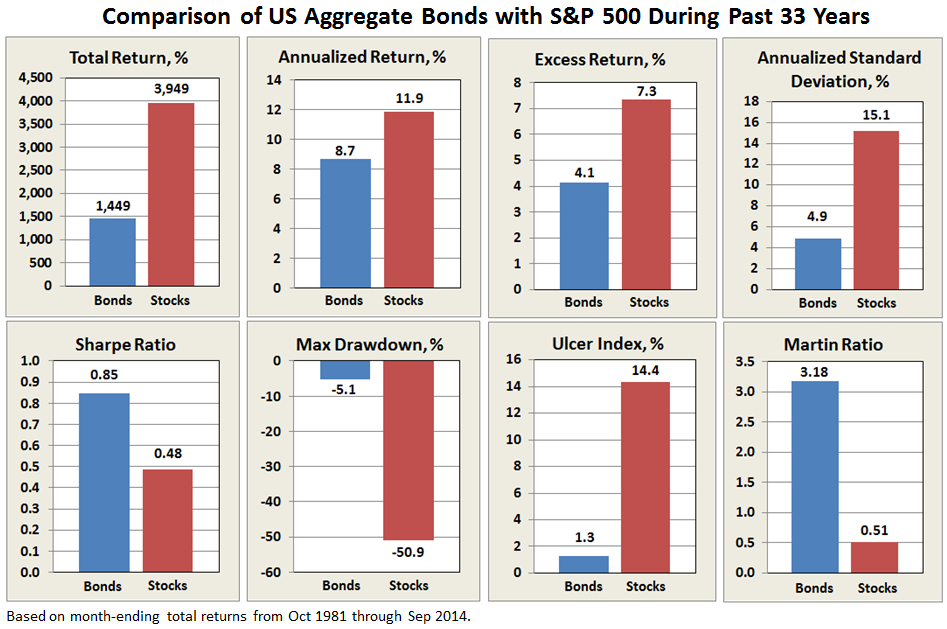
Sure, stocks still triumphed on absolute return, but who would not take 8.7% annually with such low volatility? Based on comparisons of absolute return and Ulcer Index, bonds returned more than 70% of the gain with just 10% of the pain.
With underlining factors like 33 years of declining interest rates, it is no wonder that bond funds proliferated during this period and perhaps why some conservative allocation funds, like the MFO Great Owl and Morningstar Gold Metal Vanguard Wellesley Income Fund (VWINX), performed so well. But will they be as attractive the next 33 years, or when interest rates rise?
As Morningstar’s Kevin McDevitt points out in his assessment of VWINX, “the fund lagged its average peer…from July 1, 1970, through July 1, 1980, a period of generally rising interest rates.” That said, it still captured 85% of the S&P500 return over that period and 76% during the Cycle 2 bull market from October 1974 through August 1987.
Of course, predicting interest rates will rise and interest rates actually rising are two different animals, as evidenced in bond returns YTD. In fact, our colleague Ed Studzinski recently pointed out the long term bonds have done exceptionally well this year (e.g., Vanguard Extended Duration Treasury ETF up 26.3% through September). Who would have figured?
I’m reminded of the pop quiz Greg Ip presents in his opening chapter of “Little Book of Economics”: The year is 1990. Which of the following countries has the brighter future…Japan or US? In 1990, many economists and investors picked Japan. Accurately predicting macroeconomics it seems is very hard to do. Some say it is simply not possible.
Similarly, the difficulty mutual funds have to consistently achieve top-quintile performance, either across fixed time periods or market cycles, or using absolute or risk-adjusted measures, is well documented (e.g., The Persistence Scorecard – June 2014, Persistence is a Killer, In Search of Persistence, and Ten Market Cycles). It does not happen. Due to the many underlying technical and psychological variables of the market place, if not the shear randomness of events.
In his great book “The Most Important Thing,” Howard Marks describes the skillful defensive investor as someone who does not lose much when the market goes down, but gains a fair amount when the market goes up. But this too appears very hard to do consistently.
Vanguard’s Convertible Securities Fund (VCVSX), sub-advised by OakTree Capital Management, appears to exhibit this quality to some degree, typically capturing 70-100% of upside with 70-80% of downside across the last three market cycles.
Since bull markets tend to last much longer than bear markets and produce returns well above the average, capturing a “fair amount” does not need to be that high. Examining funds that have been around for at least 1.5 cycles (since October 2002, oldest share class only), the following delivered 50% or more total return during bull markets, while limiting drawdowns to 50% during bear markets, each relative to S&P 500. Given the 3500 funds evaluated, the final list is pretty short.
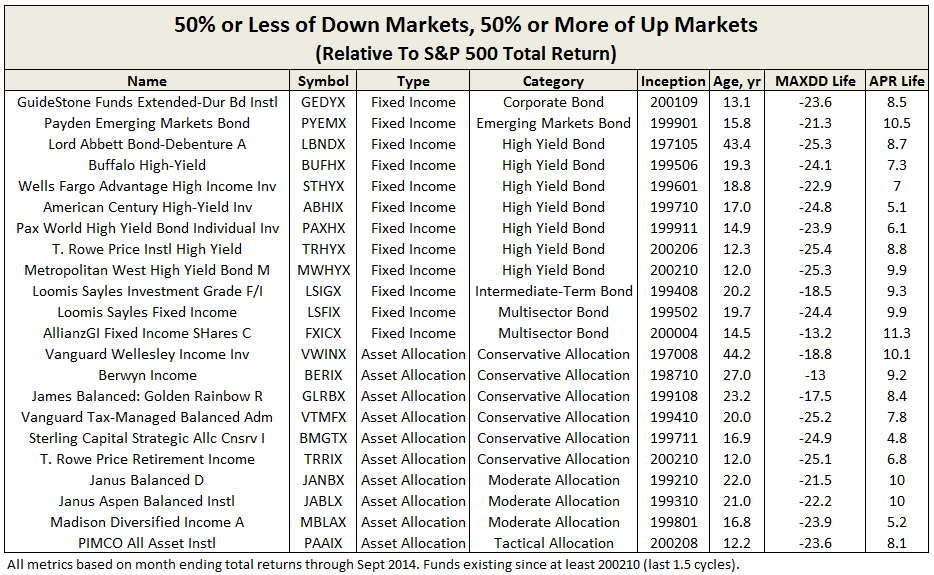
VWINX is the oldest, along with Lord Abbett Bond-Debenture Fund (LBNDX). Both achieved this result across the last four full cycles. As a check against performance exceeding the 50% threshold during out-of-cycle or partial-cycle periods, all funds on this list achieved the same result over their lifetimes.
For moderately conservative investors, these funds have not been mediocre or frustrating at all, quite the contrary. For those with an appetite for higher returns and possess the attendant temperament and investing horizon, here is a link to similar funds with higher thresholds: MFO Pain-To-Gain Funds.
We can only hope to have it so good going forward.